

Factors Influencing Retinal Pigment Epithelium-Atrophy Progression Rate in Stargardt Disease
- PMID: 32832238
- PMCID: PMC7414677
- DOI: 10.1167/tvst.9.7.33
Factors Influencing Retinal Pigment Epithelium-Atrophy Progression Rate in Stargardt Disease
Abstract
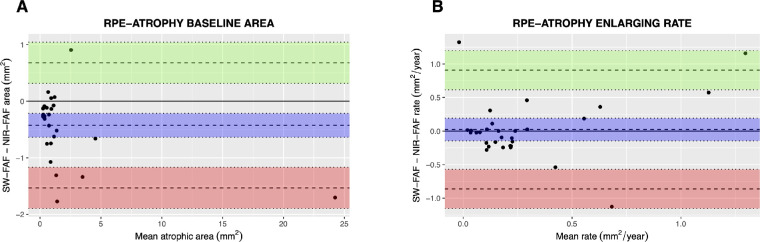
Purpose: To evaluate demographic, clinical, imaging, and genetic factors associated with retinal pigment epithelium enlargement in Stargardt disease (STGD1) and to measure the agreement between short-wavelength fundus autofluorescence (SW-FAF) and near-infrared fundus autofluorescence (NIR-FAF).
Methods: Retrospective cohort study of patients with STGD1 with ≥2 gradable SW-FAF images. RPE-atrophy areas were measured on SW-FAF and NIR-FAF at each visit and regressed against time to obtain the rate of RPE-atrophy enlargement. Agreement between SW-FAF and NIR-FAF with regards to baseline atrophic areas and rates of enlargement was evaluated. Baseline factors predictive of faster SW-FAF RPE-atrophy enlargement were investigated with linear mixed models.
Results: Fifty-four eyes of 28 patients (median age: 45 years; 13 males) were included. SW-FAF and NIR-FAF agreed well for slow rates of RPE-atrophy progression, but agreement decreased as the rate increased. Median (interquartile range [IQR]) rate of RPE-atrophy expansion was 0.18 (0.10-0.85) mm2/year on SW-FAF and 0.24 (0.08-0.33) mm2/year on NIR-FAF. Larger baseline RPE-atrophy area (estimate: 0.057 mm2/year, P < 0.001), worse visual acuity (0.305 mm2/year, P = 0.005), multifocal disease (0.401 mm2/year, P = 0.02), and SW-FAF pattern (0.534 mm2/year, P =0 .03) were associated with a faster rate of progression (predictive R2: 0.65).
Conclusions: SW-FAF and NIR-FAF are not interchangeable in the evaluation of RPE-atrophy enlargement, and both imaging modalities may be required for optimal detection of disease progression. A multivariable model based on baseline clinical and imaging information may identify patients at higher risk of fast disease progression.
Translational relevance: The knowledge of the agreement of different FAF modalities, the estimated rates of RPE-atrophy enlargement, and factors predictive of faster anatomic decay in STGD1 may allow tailored clinical management and better clinical trials design.
Keywords: Stargardt disease; best-corrected visual acuity; disease progression; near-infrared autofluorescence; short-wavelength autofluorescence.
Copyright 2020 The Authors.
Conflict of interest statement
Disclosure: M.V. Cicinelli, None; A. Rabiolo, None; M. Brambati, None; C. Viganò, None; F. Bandello, Allergan (C), Bayer (C), Boehringer-Ingelheim (C), Hoffmann La Roche (C), Novartis (C), NTC Pharma (C), Sifi (C), Thrombogenics (C), Zeiss (C), Sooft (R). M. Battaglia Parodi, None
Figures

Similar articles
-
Retinal Pigment Epithelium Atrophy in Recessive Stargardt Disease as Measured by Short-Wavelength and Near-Infrared Autofluorescence.Transl Vis Sci Technol. 2021 Jan 5;10(1):3. doi: 10.1167/tvst.10.1.3. eCollection 2021 Jan. Transl Vis Sci Technol. 2021. PMID: 33505770 Free PMC article.
-
Differential Disease Progression in Atrophic Age-Related Macular Degeneration and Late-Onset Stargardt Disease.Invest Ophthalmol Vis Sci. 2017 Feb 1;58(2):1001-1007. doi: 10.1167/iovs.16-20980. Invest Ophthalmol Vis Sci. 2017. PMID: 28288486
-
Fundus autofluorescence and microperimetry in progressing geographic atrophy secondary to age-related macular degeneration.Br J Ophthalmol. 2013 May;97(5):622-6. doi: 10.1136/bjophthalmol-2012-302633. Epub 2013 Feb 14. Br J Ophthalmol. 2013. PMID: 23410728
-
Long-term Natural History of Atrophy in Eyes with Choroideremia-A Systematic Review and Meta-analysis of Individual-Level Data.Ophthalmol Retina. 2020 Aug;4(8):840-852. doi: 10.1016/j.oret.2020.03.003. Epub 2020 Mar 14. Ophthalmol Retina. 2020. PMID: 32362554 Free PMC article.
-
The Progression of Geographic Atrophy Secondary to Age-Related Macular Degeneration.Ophthalmology. 2018 Mar;125(3):369-390. doi: 10.1016/j.ophtha.2017.08.038. Epub 2017 Oct 27. Ophthalmology. 2018. PMID: 29110945 Review.
Cited by
-
Fundus Autofluorescence and Clinical Applications.J Ophthalmic Vis Res. 2021 Jul 29;16(3):432-461. doi: 10.18502/jovr.v16i3.9439. eCollection 2021 Jul-Sep. J Ophthalmic Vis Res. 2021. PMID: 34394872 Free PMC article. Review.
-
Atrophy Expansion Rates in Stargardt Disease Using Ultra-Widefield Fundus Autofluorescence.Ophthalmol Sci. 2021 Mar 6;1(1):100005. doi: 10.1016/j.xops.2021.100005. eCollection 2021 Mar. Ophthalmol Sci. 2021. PMID: 36246008 Free PMC article.
-
ABCA4 Variant c.5714+5G>A in Trans With Null Alleles Results in Primary RPE Damage.Invest Ophthalmol Vis Sci. 2023 Sep 1;64(12):33. doi: 10.1167/iovs.64.12.33. Invest Ophthalmol Vis Sci. 2023. PMID: 37728905 Free PMC article.
-
Stargardt disease: Multimodal imaging: A review.Clin Exp Ophthalmol. 2021 Jul;49(5):498-515. doi: 10.1111/ceo.13947. Epub 2021 Jun 1. Clin Exp Ophthalmol. 2021. PMID: 34013643 Free PMC article. Review.
-
Emerging Therapeutic Approaches and Genetic Insights in Stargardt Disease: A Comprehensive Review.Int J Mol Sci. 2024 Aug 14;25(16):8859. doi: 10.3390/ijms25168859. Int J Mol Sci. 2024. PMID: 39201545 Free PMC article. Review.
References
-
- Fujinami K, Lois N, Mukherjee R, et al. .. A longitudinal study of Stargardt disease: quantitative assessment of fundus autofluorescence, progression, and genotype correlations. Invest Ophthalmol Vis Sci. 2013; 54: 8181–8190. - PubMed
-
- Han Z, Conley SM, Naash MI. Gene therapy for Stargardt disease associated with ABCA4 gene. Adv Exp Med Biol. 2014; 801: 719–724. - PubMed
MeSH terms
LinkOut - more resources
Full Text Sources
Medical
Miscellaneous
