

Nanoscale Characteristics of Ocular Lipid Thin Films Using Kelvin Probe Force Microscopy
- PMID: 32832246
- PMCID: PMC7414624
- DOI: 10.1167/tvst.9.7.41
Nanoscale Characteristics of Ocular Lipid Thin Films Using Kelvin Probe Force Microscopy
Abstract
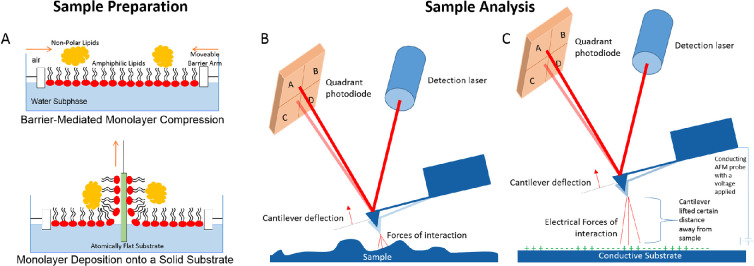
Purpose: To describe the use of Kelvin probe force microscopy (KPFM) to investigate the electrical surface potential of human meibum and to demonstrate successful use of this instrument on both human meibum and a meibum model system (six-lipid stock [6LS]) to elucidate nanoscale surface chemistry and self-assembly characteristics.
Materials and methods: 6LS and meibum were analyzed in this study. Mica-supported thin films were created using the Langmuir-Blodgett trough. Topography and electrical surface potential were quantified using simultaneous atomic force microscopy/KPFM imaging.
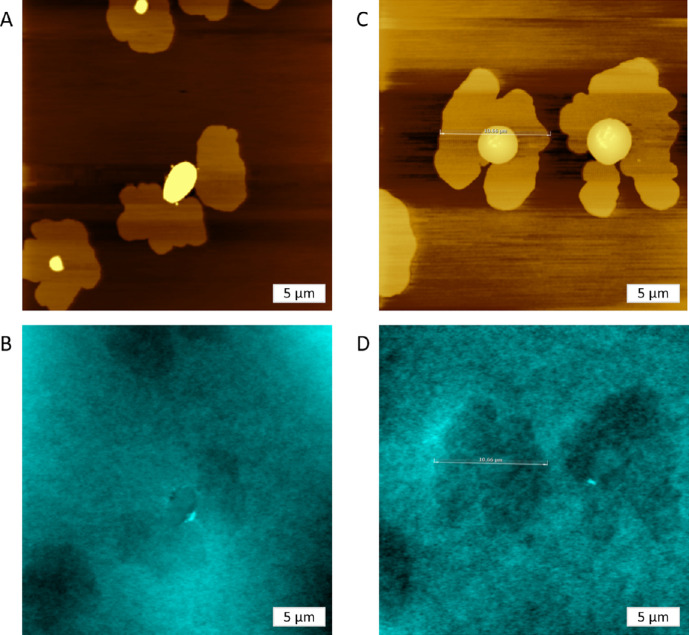
Results: Both lipid mixtures formed thin film patches on the surface of the mica substrate, with large aggregates resting atop. The 6LS had aggregate heights ranging from 41 to 153 nm. The range in surface potential was 33.0 to 125.9 mV. The meibum thin films at P = 5 mN/m had aggregates of 170 to 459 nm in height and surface potential ranging from 15.9 to 76.1 mV, while thin films at P = 10 mN/m showed an aggregate size range of 147 to 407 nm and a surface potential range of 11.5 to 255.1 mV.
Conclusions: This study showed imaging of the differences in electrical surface potential of meibum via KPFM and showed similarities in nanoscale topography. 6LS was also successfully analyzed, showing the capabilities of this method for use in both in vitro and ex vivo ocular research.
Translational relevance: This study describes the use of KPFM for the study of ocular surface lipids for the first time and outlines possibilities for future studies to be carried out using this concept.
Keywords: Kelvin probe force microscopy; atomic force microscopy; meibum/meibomian gland secretion; tear film.
Copyright 2020 The Authors.
Conflict of interest statement
Disclosure: E. Drolle, None; W. Ngo, None; Z. Leonenko, None; L. Subbaraman, None; L. Jones, Alcon (C), CooperVision (C), J&J Vision (C), Novartis (C), Ophtecs (C); Centre for Ocular Research & Education (CORE), Alcon (F), Allergan (F), CooperVision (F), GL Chemtec (F), iMed Pharma (F), J&J Vision (F), Lubris (F), Menicon (F), Nature's Way (F), Novartis (F), Ote (F), PS Therapy (F), Safilens (F), Santen (F), Shire (F), SightGlass (F), Visioneering (F)
Figures


Similar articles
-
Atomic force microscopy and Langmuir-Blodgett monolayer technique to assess contact lens deposits and human meibum extracts.J Optom. 2015 Jul-Sep;8(3):187-99. doi: 10.1016/j.optom.2014.12.003. Epub 2015 Jan 22. J Optom. 2015. PMID: 25620317 Free PMC article.
-
Dynamic interfacial properties of human tear-lipid films and their interactions with model-tear proteins in vitro.Adv Colloid Interface Sci. 2016 Jul;233:4-24. doi: 10.1016/j.cis.2015.12.009. Epub 2015 Dec 23. Adv Colloid Interface Sci. 2016. PMID: 26830077 Review.
-
An investigation of the likely role of (O-acyl) ω-hydroxy fatty acids in meibomian lipid films using (O-oleyl) ω-hydroxy palmitic acid as a model.Exp Eye Res. 2013 Oct;115:57-64. doi: 10.1016/j.exer.2013.06.016. Epub 2013 Jun 21. Exp Eye Res. 2013. PMID: 23792170
-
Lipid order, saturation and surface property relationships: a study of human meibum saturation.Exp Eye Res. 2013 Nov;116:79-85. doi: 10.1016/j.exer.2013.08.012. Epub 2013 Aug 22. Exp Eye Res. 2013. PMID: 23973715
-
Analysis of meibum and tear lipids.Ocul Surf. 2012 Oct;10(4):230-50. doi: 10.1016/j.jtos.2012.07.004. Epub 2012 Jul 25. Ocul Surf. 2012. PMID: 23084145 Review.
Cited by
-
Influence of Atmospheric Contaminants on the Work Function of Graphite.Langmuir. 2023 Aug 29;39(34):12159-12165. doi: 10.1021/acs.langmuir.3c01459. Epub 2023 Aug 15. Langmuir. 2023. PMID: 37581604 Free PMC article.
References
MeSH terms
Substances
LinkOut - more resources
Full Text Sources
Medical
