. 2020 Aug 3:8:e9654.
doi: 10.7717/peerj.9654. eCollection 2020.

Identification of DNA methylation patterns and biomarkers for clear-cell renal cell carcinoma by multi-omics data analysis

Affiliations

Identification of DNA methylation patterns and biomarkers for clear-cell renal cell carcinoma by multi-omics data analysis

Pengfei Liu et al. PeerJ. .

Abstract

Background: Tumorigenesis is highly heterogeneous, and using clinicopathological signatures only is not enough to effectively distinguish clear cell renal cell carcinoma (ccRCC) and improve risk stratification of patients. DNA methylation (DNAm) with the stability and reversibility often occurs in the early stage of tumorigenesis. Disorders of transcription and metabolism are also an important molecular mechanisms of tumorigenesis. Therefore, it is necessary to identify effective biomarkers involved in tumorigenesis through multi-omics analysis, and these biomarkers also provide new potential therapeutic targets.

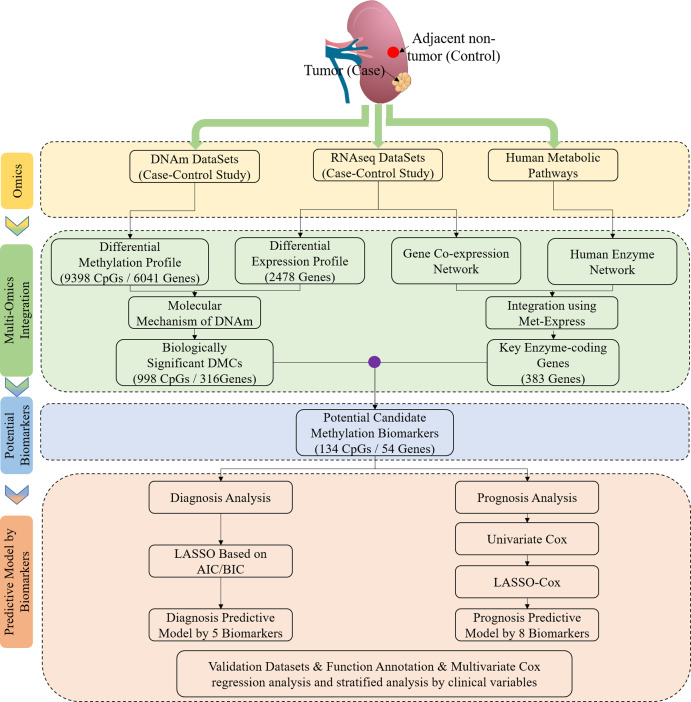
Method: The discovery stage involved 160 pairs of ccRCC and matched normal tissues for investigation of DNAm and biomarkers as well as 318 cases of ccRCC including clinical signatures. Correlation analysis of epigenetic, transcriptomic and metabolomic data revealed the connection and discordance among multi-omics and the deregulated functional modules. Diagnostic or prognostic biomarkers were obtained by the correlation analysis, the Least Absolute Shrinkage and Selection Operator (LASSO) and the LASSO-Cox methods. Two classifiers were established based on random forest (RF) and LASSO-Cox algorithms in training datasets. Seven independent datasets were used to evaluate robustness and universality. The molecular biological function of biomarkers were investigated using DAVID and GeneMANIA.

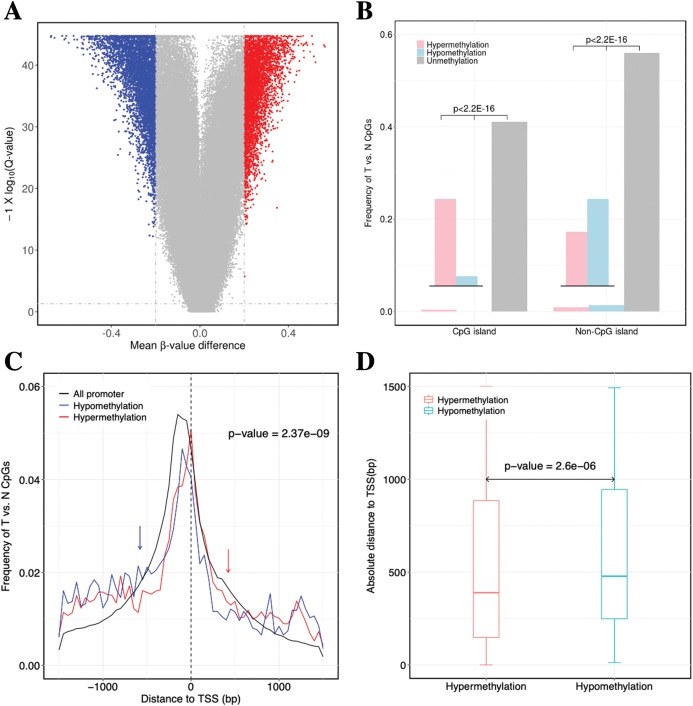
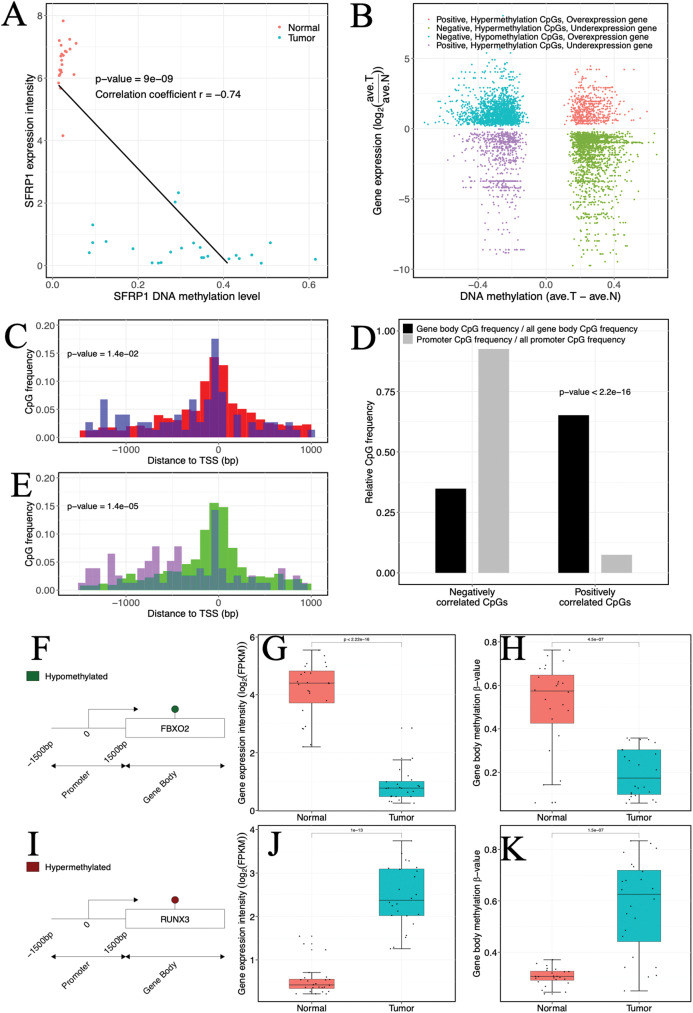
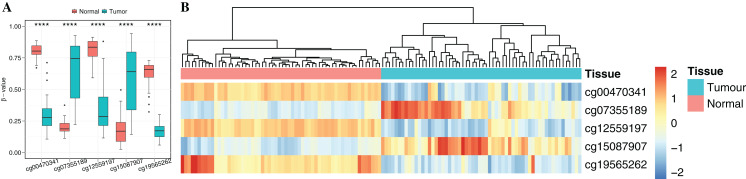
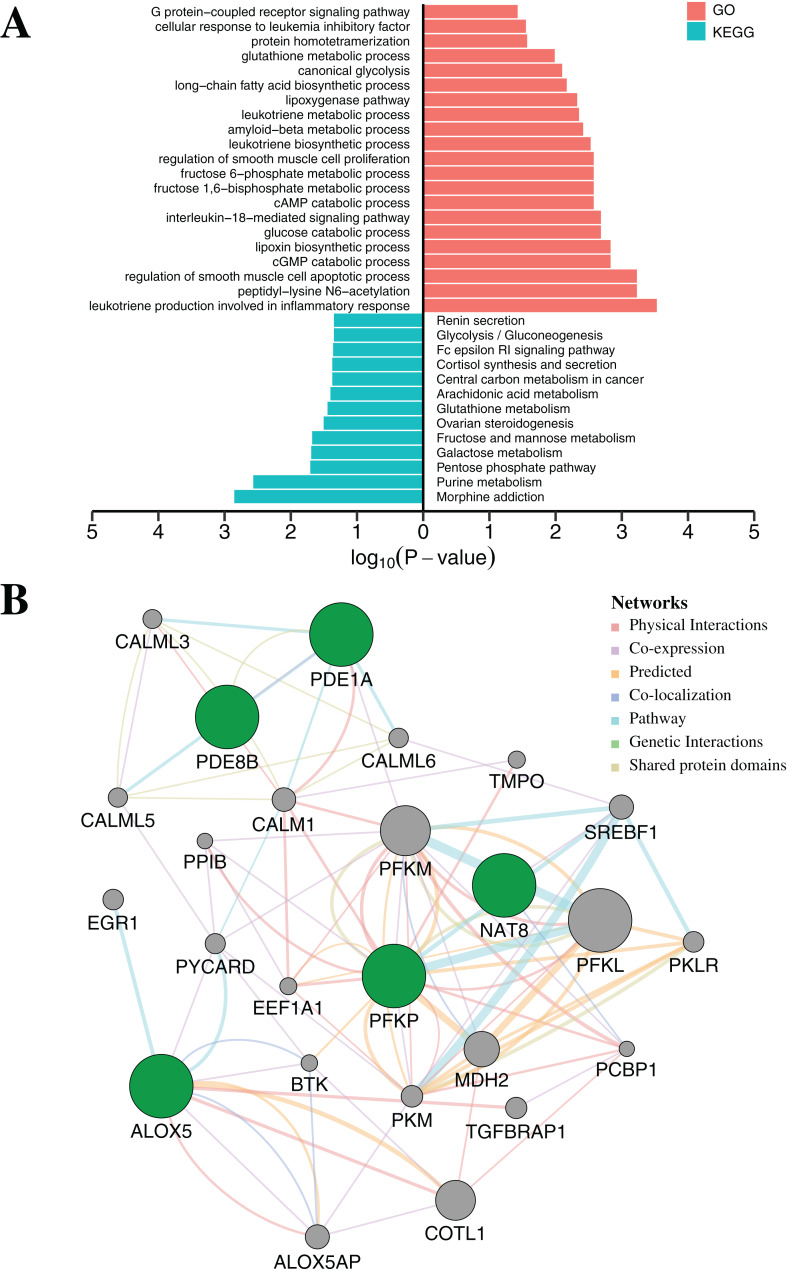
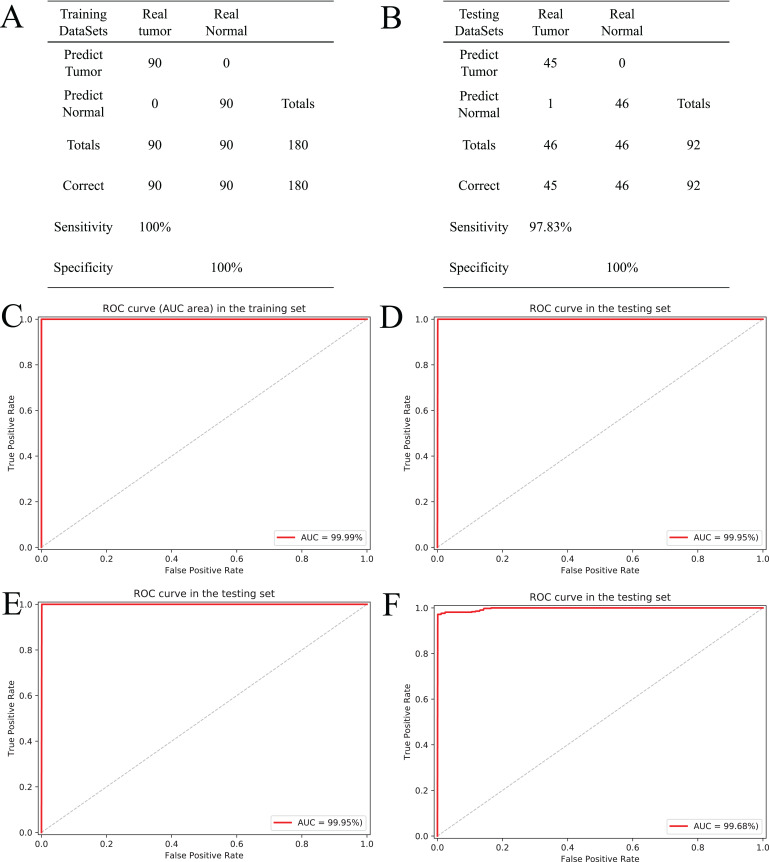
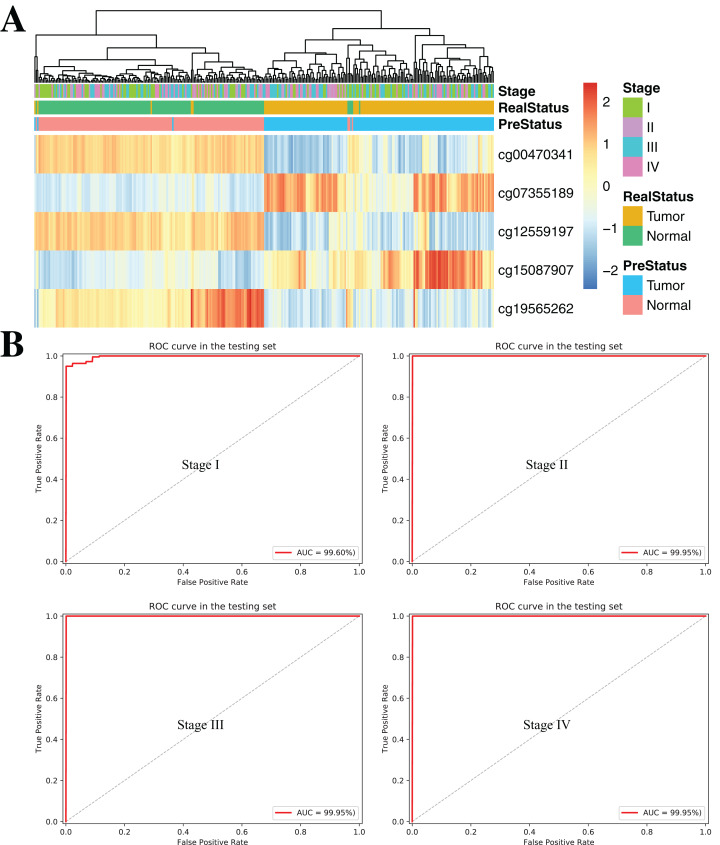
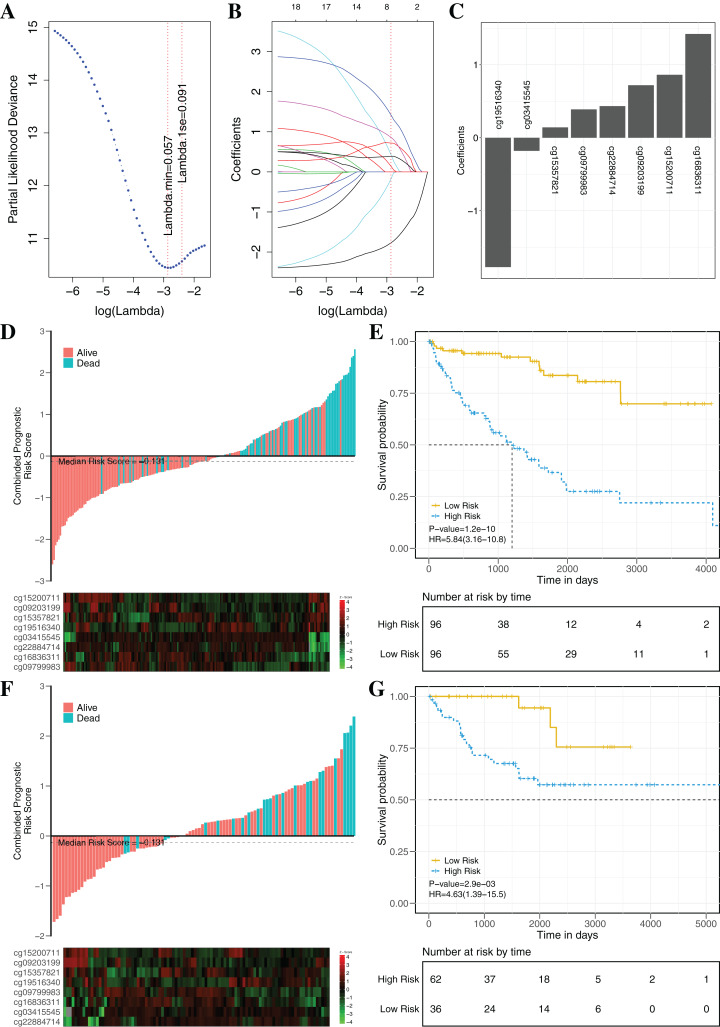
Results: Based on multi-omics analysis, the epigenetic measurements uniquely identified DNAm dysregulation of cellular mechanisms resulting in transcriptomic alterations, including cell proliferation, immune response and inflammation. Combination of the gene co-expression network and metabolic network identified 134 CpG sites (CpGs) as potential biomarkers. Based on the LASSO and RF algorithms, five CpGs were obtained to build a diagnostic classifierwith better classification performance (AUC > 99%). A eight-CpG-based prognostic classifier was obtained to improve risk stratification (hazard ratio (HR) > 4; log-rank test, p-value < 0.01). Based on independent datasets and seven additional cancers, the diagnostic and prognostic classifiers also had better robustness and stability. The molecular biological function of genes with abnormal methylation were significantly associated with glycolysis/gluconeogenesis and signal transduction.

Conclusion: The present study provides a comprehensive analysis of ccRCC using multi-omics data. These findings indicated that multi-omics analysis could identify some novel epigenetic factors, which were the most important causes of advanced cancer and poor clinical prognosis. Diagnostic and prognostic biomarkers were identified, which provided a promising avenue to develop effective therapies for ccRCC.

Keywords: Clear cell renal cell carcinoma (ccRCC); DNA methylation (DNAm); Diagnostic biomarkers; Multi-omics; Prognostic biomarkers.


Conflict of interest statement

The authors declare that they have no competing interests.

Figures

Figure 1
Figure 1. Study flowchart of data generation and analysis.
DMC, differentially methylated CpG sites; DNAm, DNA methylation. Integrated methylation signatures on ccRCC and non-tumor tissues were used to identify 134 candidate biomarkers. Diagnostic biomarker selection: LASSO was applied to a training cohort to identify a final selection of five biomarkers. These five markers were applied to a validation cohort. Prognostic biomarker selection: univariant-cox and LASSO-Cox were applied to a training cohort with survival data to identify a final selection of eight biomarkers. These eight biomarkers were applied to a validation cohort with survival data.
Figure 2
Figure 2. Identification of DNA methylation difference between ccRCC and matched adjacent non-ccRCC samples.
(A) Volcano plot of the differential DNA methylation analysis (X-axis). Mean β-value difference (mean ccRCC–mean non-ccRCC); (Y-axis) Q-values for each CpG sites (−1 × log10 scale). Blue points represent hypomethylated CpG sites; red points represent hypermethylated. (B) Proportions of CpG sites on CGIs and non-CGIs. Red bar represents hypermethylated CpG sites; blue bar represents hypomethylated CpG sites; gray bar represents unmethylated CpG sites. p Values were computed with χ2 test. (C) Normalized histogram of CpG sites with respect to TSSs distance. Red line represents hypermethylated CpG sites; blue line represents hypomethylated CpG sites; black line represents background distribution of all promoter CpG sites. Red and blue arrows represent significantly difference between the characteristics of hyper-and hypomethylated CpG sites in promoters. Up-and downstream distances from TSSs are represented by positive and negative values, respectively. p Values were computed with the Wilcoxon rank sum test. (D) Box plot of TSS absolute distance for CpG sites. Red box represents the hypermethylated promoter CpG sites were located in CGI regions; blue box represents the hypomethylated promoter CpG sites were located in CGI regions.
Figure 3
Figure 3. Impact of abnormal methylation levels on gene expression in ccRCC.
(A) Example of a gene (SFRP1) showing a negative gene expression-DNA methylation relationship. Blue, ccRCC tumors; red, matched adjacent normal tissues. (B) Starburst plot of gene expression and DNA methylation differences in ccRCC and matched adjacent normal tissues. Only CpG sites (points) demonstrating significant DNA methylation-gene expression correlations are shown. X axis, differential DNA methylation levels between ccRCC and matched adjacent normal tissues. Y axis, differential gene expression levels between ccRCC and matched adjacent normal tissues. (C, E) Relationships of positively correlated CpG sites to TSSs. (C) Normalized histogram of positively correlated CpG sites hypermethylated and over-expressed (blue) compared to conventional negatively correlated CpG sites (red). (E) Histogram of positively correlated CpG sites hypomethylated and under-expressed (purple) compared to conventional negatively correlated CpG sites (green). (D) Bar graphs exhibiting ratios of gene body (black) and promoter (gray) CpG frequencies within negatively and positively correlated CpG sites to all gene body and promoter CpG site frequencies. p Values were computed with Chi-square test. (F, I) (Left) Schematic representation of genes including significantly positively correlated gene body CpG sites for FBXO2 (F) and RUNX3 (I). (G, J) Box plots comparing gene expression levels associated with positively correlated gene body CpG sites in ccRCC and matched adjacent normal tissue. (H, K) Box plots comparing gene body methylation levels of positively correlated gene body CpG sites in ccRCC and matched adjacent normal tissue.
Figure 4
Figure 4. Identification of the DNA methylation-based diagnostic biomarkers.
(A) The methylation values and standard deviations of five diagnostic biomarkers were from the benign-adjacent and patient cancer tissues. The p-value was calculated through Wilcoxon rank sum test, and “****” means p-value was less than 0.001. (B) Unsupervised hierarchical clustering of five methylation biomarkers selected for use in the diagnostic prediction model in the independent dataset, in which the metric of similarity was Pearson’s correlation based on the methylation levels.
Figure 5
Figure 5. Functional enrichment analysis and protein–protein interaction network by DNA methylation-based diagnostic biomarkers.
(A) Functional enrichment analysis was performed through GO and KEGG. p-Value was adjusted by Benjamini–Hochberg method. (B) The networks were each assigned a weight by the GeneMANIA algorithm. The weight of each edge was multiplied by weight of the containing network. The size of the circle was defined as the score attribute, which indicated the relevance of each gene to the original list based on the selected networks. Higher scores suggested that genes that were more likely to be functionally related. The shaded circles represented the DNA methylation-based diagnostic biomarkers.
Figure 6
Figure 6. Construction and validation of the CpGs-based diagnostic model.
(A and B) Confusion tables of binary results of diagnostic prediction model in the training (A) and validation (B). ROC of the diagnostic prediction model with methylation biomarkers in the training (C) and validation data sets (D). (E and F) ROC of the diagnostic prediction model with methylation biomarkers in two independent data sets (GSE70303 (E) and E-MTAB-2007 (F)).
Figure 7
Figure 7. DNA methylation analysis of ccRCC diagnosis at different stages of tumorigenesis.
(A) Unsupervised hierarchical clustering and heatmap for the methylation profile of the selected five CpGs across 160 samples at different stages of tumorigenesis. (B) ROC curve for the validation data sets of stages I–IV from TCGA.
Figure 8
Figure 8. Construction and validation of the eight-CpG-based classifier.
(A and C) Eight CpG sites selected by LASSO Cox regression analysis. (A) The two dotted vertical lines are drawn at the optimal values by minimum criteria and 1-s.e. criteria. Details are provided in Methods. (B) LASSO coefficient profiles of the 21 CpG sites. A vertical line is drawn at the optimal value by 1-s.e. criteria and results in eight non-zero coefficients. (C) A histogram of the absolute values of the coefficients for eight CpG sites, and eight CpG sites was selected in the LASSO Cox regression model. (D–G) Risk score was calculated by the eight-CpG-based classifier and Kaplan–Meier survival in the training data sets (D and E) and validation data set (F and G). Risk-score distribution of the eight-CpG-based classifier and patient survival status. Heatmap showing methylation of the eight CpG sites in the patients. Kaplan–Merier survival analysis for the patients. The patients were divided into low-risk and high-risk groups using the median cutoff value of the classifier risk score (−0.131). p-Values were calculated using the log-rank test. HR, hazard ratio.

Similar articles

Cited by

References

    1. Atschekzei F, Hennenlotter J, Janisch S, Grosshennig A, Trankenschuh W, Waalkes S, Peters I, Dork T, Merseburger AS, Stenzl A, Kuczyk MA, Serth J. SFRP1 CpG island methylation locus is associated with renal cell cancer susceptibility and disease recurrence. Epigenetics. 2012;7(5):447–457. doi: 10.4161/epi.19614. - DOI - PubMed
    1. Audet-Walsh E, Vernier M, Yee T, Laflamme C, Li S, Chen Y, Giguere V. SREBF1 activity is regulated by an AR/mTOR nuclear axis in prostate cancer. Molecular Cancer Research. 2018;16(9):1396–1405. doi: 10.1158/1541-7786.MCR-17-0410. - DOI - PubMed
    1. Awakura Y, Nakamura E, Ito N, Kamoto T, Ogawa O. Methylation-associated silencing of SFRP1 in renal cell carcinoma. Oncology Reports. 2008;20:1257–1263. - PubMed
    1. Becket E, Chopra S, Duymich CE, Lin JJ, You JS, Pandiyan K, Nichols PW, Siegmund KD, Charlet J, Weisenberger DJ, Jones PA, Liang G. Identification of DNA methylation–independent epigenetic events underlying clear cell renal cell carcinoma. Cancer Research. 2016;76(7):1954–1964. doi: 10.1158/0008-5472.CAN-15-2622. - DOI - PMC - PubMed
    1. Bibikova M, Barnes B, Tsan C, Ho V, Klotzle B, Le JM, Delano D, Zhang L, Schroth GP, Gunderson KL, Fan J-B, Shen R. High density DNA methylation array with single CpG site resolution. Genomics. 2011;98(4):288–295. doi: 10.1016/j.ygeno.2011.07.007. - DOI - PubMed

LinkOut - more resources