. 2020 Aug 4:2020:7375947.
doi: 10.1155/2020/7375947. eCollection 2020.

Profound Functional Suppression of Tumor-Infiltrating T-Cells in Ovarian Cancer Patients Can Be Reversed Using PD-1-Blocking Antibodies or DARPin® Proteins

Affiliations

Profound Functional Suppression of Tumor-Infiltrating T-Cells in Ovarian Cancer Patients Can Be Reversed Using PD-1-Blocking Antibodies or DARPin® Proteins

Emelie Foord et al. J Immunol Res. .

Abstract

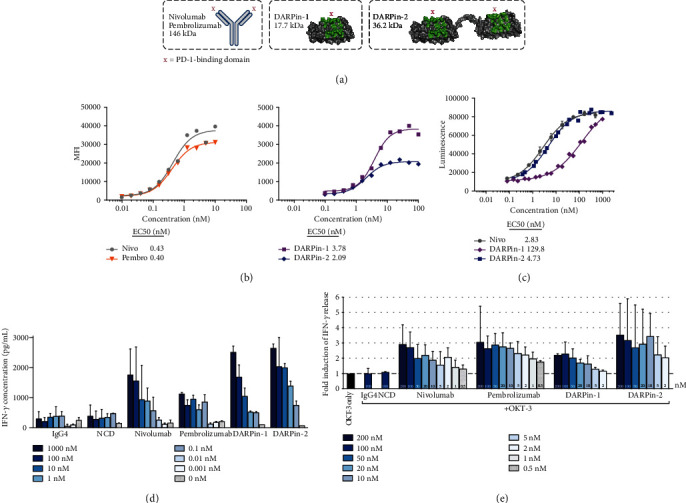
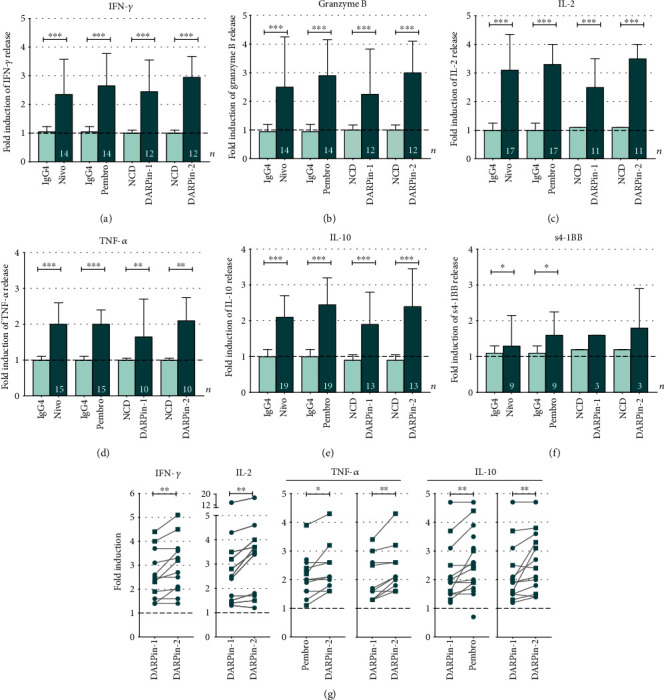
PD-1/PD-L1 blockade has revolutionized the field of immunooncology. Despite the relative success, the response rate to anti-PD-1 therapy requires further improvements. Our aim was to explore the enhancement of T-cell function by using novel PD-1-blocking proteins and compare with clinically approved monoclonal antibodies (mAbs). We isolated T-cells from the ascites and tumor of 17 patients with advanced epithelial ovarian cancer (EOC) and analyzed the effects using the mAbs nivolumab and pembrolizumab and two novel engineered ankyrin repeat proteins (DARPin® proteins). PD-1 blockade with either mAb or DARPin® molecule significantly increased the release of IFN-γ, granzyme B, IL-2, and TNF-α, demonstrating successful reinvigoration. The monovalent DARPin® protein was less effective compared to its bivalent equivalent, demonstrating that bivalency brings an additional benefit to PD-1 blockade. Overall, we found a higher fold increase of lymphokine secretion in response to the PD-1 blockade by tumor-derived T-cells; however, the absolute amounts were significantly lower compared to the release from ascites-derived T-cells. Our results demonstrate that PD-1 blockade can only partially reinvigorate functionally suppressed T-cells from EOC patients. This warrants further investigation preferably in combination with other therapeutics. The study provides an early pilot proof-of-concept for the potential use of DARPin® proteins as eligible alternative scaffold proteins to block PD-1.


Conflict of interest statement

JK, MM, CH, DSc, DV, UF, DSn, and VL are employed by Molecular Partners AG and hold options or shares in the company. BK was employed by Molecular Partners AG and holds options or shares in the company. BK is now an employee and shareholder of AstraZeneca. No potential conflicts of interest were disclosed by the other authors.

Figures

Figure 1
Figure 1
PD-1 expression and effector function capacity of T-cells isolated from healthy controls (HC) and epithelial ovarian cancer (EOC) patients. (a) Proportion of PD-1+ (%) CD4+ and CD8+ T-cells isolated from the peripheral blood of HC (n = 10) and the blood (n = 12), ascites (n = 16), and tumor (n = 8) of EOC patients. Gating strategy included singlets, followed by viable cells (being 7AAD-), lymphocyte gate (by forward/side scatter), and T-cells (CD3+), followed by expression of CD4+ and CD8+ and lastly by expression of PD-1 on these subsets. (b) Representative histograms of PD-1 expression on CD4+ and CD8+ T-cells from one patient. Cells from the tumor were used for the isotype control. (c) Absolute concentrations of IFN-γ (normalized to reflect per 500,000 T-cells) after stimulation with α-CD3 (OKT-3) for 48 h. (d) The median release of IFN-γ in HC after stimulation with α-CD3 was set to 100% and defined full response (effector function capacity). The release measured in the samples from EOC patient blood, ascites, and tumor was compared to the release observed in HC blood samples. Median values with interquartile ranges are presented. IFN-γ was measured using ELISA, and the data was normalized to reflect the same cell number (per 500,000 T-cells). Unpaired Mann-Whitney was performed as statistical analysis. Significance levels were set to p < 0.05, ∗∗p < 0.01, and ∗∗∗p < 0.001.
Figure 2
Figure 2
Overview of PD-1-blocking monoclonal antibodies and DARPin® proteins. (a) Schematic of the PD-1-binding reagents: two conventional monoclonal antibodies (mAbs) of IgG4 subtype (nivolumab and pembrolizumab) and two DARPin® proteins with monovalent (DARPin-1) or bivalent (DARPin-2) PD-1 binding. (b) Assessment of PD-1 binding using a titration of PD-1-targeting reagents with a PD-1-expressing cell line (transfected HEK293). PD-1 binding was measured by mean fluorescence intensity (MFI) using flow cytometry. Half-effective concentrations (EC50 values) are presented for each PD-1-binding reagent—nivolumab (nivo) in circles, pembrolizumab (pembro) in reversed triangles, DARPin-1 in squares, and DARPin-2 in diamonds. (c) PD-1/PD-L1 blockade bioassay (Promega) (n = 2) was performed using PD-1+ effector T-cells and PD-L1-expressing aAPC/CHO-K1 cells in the presence of dose titrations of PD-1-targeting reagents. Increased luminescence indicates recovered T-cell activation as PD-1 engagement with PD-L1 interferes with the T-cell receptor-mediated transcription of the reporter gene luciferase. (d) Mixed lymphocyte reaction was performed using CD4+ T-cells and allogeneic dendritic cells generated from healthy donors in the presence of PD-1-targeting mAbs (nivolumab, n = 3; pembrolizumab, n = 1), DARPin® proteins (n = 2 for both), or corresponding controls (human IgG4 and negative control DARPin® protein, NCD, respectively, n = 2 for both). The levels of IFN-γ in the supernatants were analyzed using ELISA, and results are presented for indicated concentrations. (e) Fold induction of IFN-γ release from T-cells isolated from the ascites or tumor from ovarian cancer patients (n = 7) after 48 h incubation with α-CD3 (OKT-3) and different concentrations of PD-1-targeting mAbs (n = 8), DARPin® proteins (n = 4), or corresponding controls (IgG4 and NCD, n = 8 and n = 4, respectively, both used at 100 nM). The response was normalized based on the response with only α-CD3, which was set to 1 (dashed line). The results are presented as a median with interquartile range, and concentrations are indicated in the figure.
Figure 3
Figure 3
Secretion of IFN-γ by T-cells in the presence of α-CD3 and PD-1-targeting reagents. T-cells isolated from the ascites (n = 16) and tumor (n = 8) were activated and cultured with α-CD3 (OKT-3) and 100 nM of PD-1-directed reagents (nivolumab, Nivo; pembrolizumab, Pembro; DARPin-1; and DARPin-2) or controls (IgG4 and negative control DARPin® protein, NCD) for 48 h. (a) The relative fold increase of IFN-γ when adding PD-1 blockers or control was compared to the release caused by α-CD3 alone (represented by a dashed line set to 1). The results are presented for T-cells isolated from the ascites (circles) or (b) tumor (squares) separately. The number of samples is indicated in each bar (n). Corresponding controls for anti-PD-1 reagents are presented next to each anti-PD-1. (c) Significant differences among PD-1 blockers in ascites samples are presented separately and also (d) grouped together with tumor samples. Lines represent paired comparisons in which presented reagents have been assessed in parallel (in the same sample). (e) Comparing fold increase in paired samples of the ascites and tumor from the same patient (n = 7). Absolute concentrations of IFN-γ released by T-cells isolated from (f) the ascites or (g) the tumor. (h) Comparing absolute IFN-γ concentrations in paired samples of the ascites and tumor (n = 7). All data have been normalized to reflect the same number of T-cells (per 500,000 T-cells). Wilcoxon signed rank test was used, and median values and interquartile ranges are plotted. Significance levels were set to p < 0.05, ∗∗p < 0.01, and ∗∗∗p < 0.001.
Figure 4
Figure 4
Fold induction of secreted soluble factors from T-cells isolated in the presence of α-CD3 and 100 nM of PD-1-directed reagents. T-cells from the ascites (n = 14) and tumor (n = 5) were activated and cultured with α-CD3 (OKT-3) and 100 nM of PD-1-directed reagents or controls for 48 h. Results were generated using a multiplex immunoassay (Luminex) for (a) IFN-γ, (b) granzyme B, (c) IL-2, (d) TNF-α, (e) IL-10, and (f) soluble 4-1BB (s4-1BB)/sCD137 in samples of ascites and tumor (presented together). Fold induction was calculated based on the release when adding only α-CD3 with no presence of anti-PD-1 reagent or control (represented by a dashed line at 1). Several ascites samples reached the upper detection limit in all conditions (including α-CD3 alone) and were excluded for several cytokines. The total number of samples evaluated is presented in each bar (n). (g) The response by different anti-PD-1 reagents was compared with each other, and significant findings are presented. Although data from the ascites and tumor is pooled together, ascites samples are presented as circles and tumor samples as squares. Lines represent paired comparisons in which presented reagents have been assessed in parallel (in the same sample). Wilcoxon signed rank test was used for all statistical comparisons. Median values and interquartile ranges are plotted. Significance levels were set to p < 0.05, ∗∗p < 0.01, and ∗∗∗p < 0.001.

Similar articles

Cited by

References

    1. Balch C. M., Riley L. B., Bae Y. J., et al. Patterns of human tumor-infiltrating lymphocytes in 120 human cancers. Archives of Surgery. 1990;125(2):200–205. doi: 10.1001/archsurg.1990.01410140078012. - DOI - PubMed
    1. Pagès F., Galon J., Dieu-Nosjean M.-C., Tartour E., Sautès-Fridman C., Fridman W. H. Immune infiltration in human tumors: a prognostic factor that should not be ignored. Oncogene. 2010;29(8):1093–1102. doi: 10.1038/onc.2009.416. - DOI - PubMed
    1. Yigit R., Massuger L. F. A. G., Figdor C. G., Torensma R. Ovarian cancer creates a suppressive microenvironment to escape immune elimination. Gynecologic Oncology. 2010;117(2):366–372. doi: 10.1016/j.ygyno.2010.01.019. - DOI - PubMed
    1. Fridman W. H., Pagès F., Sautès-Fridman C., Galon J. The immune contexture in human tumours: impact on clinical outcome. Nature Reviews. Cancer. 2012;12(4):298–306. doi: 10.1038/nrc3245. - DOI - PubMed
    1. Wherry E. J. T cell exhaustion. Nature Immunology. 2011;12(6):492–499. doi: 10.1038/ni.2035. - DOI - PubMed

MeSH terms

Substances