. 2020 Jul 8;6(28):eaba1972.
doi: 10.1126/sciadv.aba1972. eCollection 2020 Jul.

Single-cell RNA sequencing reveals profibrotic roles of distinct epithelial and mesenchymal lineages in pulmonary fibrosis

Affiliations

Single-cell RNA sequencing reveals profibrotic roles of distinct epithelial and mesenchymal lineages in pulmonary fibrosis

Arun C Habermann et al. Sci Adv. .

Abstract

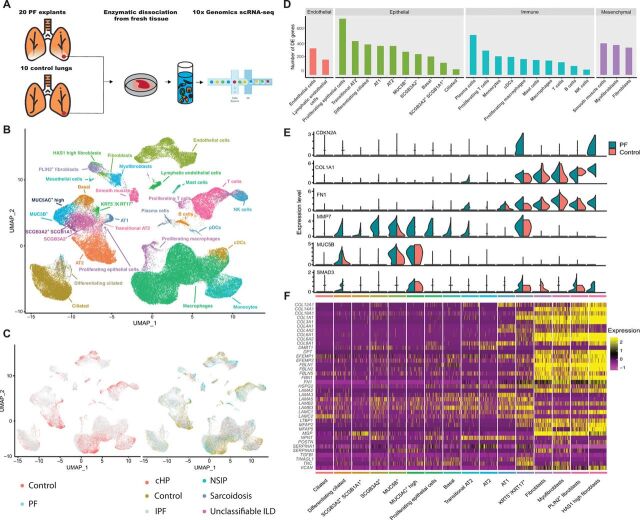
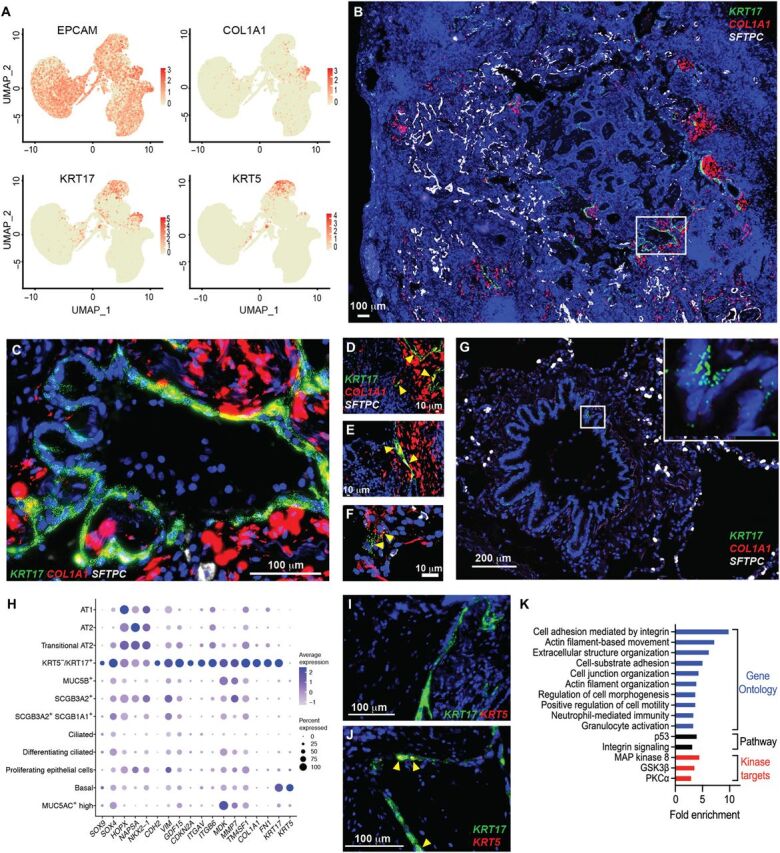
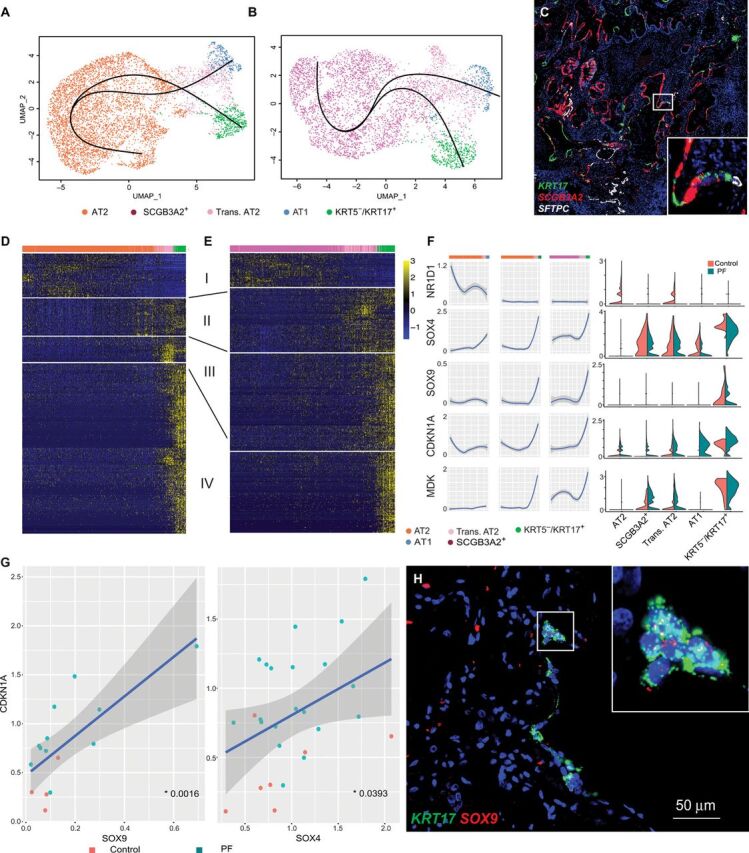
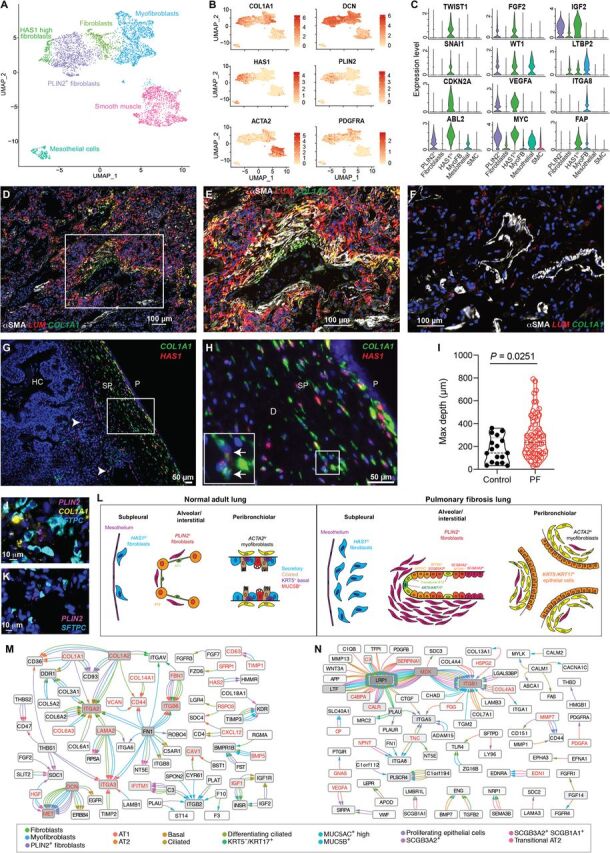
Pulmonary fibrosis (PF) is a form of chronic lung disease characterized by pathologic epithelial remodeling and accumulation of extracellular matrix (ECM). To comprehensively define the cell types, mechanisms, and mediators driving fibrotic remodeling in lungs with PF, we performed single-cell RNA sequencing of single-cell suspensions from 10 nonfibrotic control and 20 PF lungs. Analysis of 114,396 cells identified 31 distinct cell subsets/states. We report that a remarkable shift in epithelial cell phenotypes occurs in the peripheral lung in PF and identify several previously unrecognized epithelial cell phenotypes, including a KRT5- /KRT17 + pathologic, ECM-producing epithelial cell population that was highly enriched in PF lungs. Multiple fibroblast subtypes were observed to contribute to ECM expansion in a spatially discrete manner. Together, these data provide high-resolution insights into the complexity and plasticity of the distal lung epithelium in human disease and indicate a diversity of epithelial and mesenchymal cells contribute to pathologic lung fibrosis.


Figures

Fig. 1
Fig. 1. Single-cell landscape of PF and control lungs.
(A) Schematic of workflow for scRNA-seq using the 10x Chromium platform. Uniform Manifold Approximation and Projection (UMAP) embedding of jointly analyzed single-cell transcriptomes from 114,396 cells from 20 PF and 10 control lungs annotated by (B) cell type and (C) disease status. (D) Number of differentially expressed (DE) genes in each cell type with >50 cells available in PF and control lungs [negative binomial test, log fold change (FC) cutoff of 0.25 and adjusted P value of <0.01). (E) Cell type of origin and disease state informed expression of selected biomarkers and putative mediators of PF. (F) Heatmap depicting relative expression (normalized and scaled z-scored) of known ECM components previously shown to be increased in PF lungs, each cluster is downsampled to 100 cells for visualization. All of the genes except COL6A1, COL6A2, LAMA3, LAMA5, and LAMB2 were differentially expressed in at least one cell type. NK cells, natural killer cells; pDCs, plasmacytoid dendritic cells; cDCs, classical dendritic cells; cHP, chronic hypersensitivity pneumonitis.
Fig. 2
Fig. 2. Epithelial cell identification and characterization in PF lungs.
(A) Normalized expression levels of canonical lineage markers in lung epithelial cells. (B) UMAP embedding of 37,325 epithelial cells annotated by cell type/state from jointly analyzed PF and control lungs. (C) Quantification of cell types as a percent of all epithelial cells in PF versus control lungs. Boxes, interquartile range and range. *P < 0.05 by Mann-Whitney U. (D) RNA in situ hybridization (ISH) of IPF lung labeling secretory lineages using multiplexed RNA-ISH. Original image composed of stitched 40× images. (E) Higher magnification (×200) of box from (D). (F) RNA-ISH demonstrating secretory lineages in control lung. Original magnification, ×400. (G to K) Quantification of (G) SCGB1A1+, (H) MUC5B+, (I) SCGB3A2+, (J) SFTPC+, and (K) AGER+ cells from a total of 100 20× fields per lung from each of four control and five PF lungs, reported as positive cells per square millimeter. Between-group comparisons were performed by Mann-Whitney U. Coexpression profiles of (L) all secretory cells and (M) SCGB3A2+ cells, compared by two-way analysis of variance (ANOVA). Data are presented as means ± 95% confidence interval (CI).
Fig. 3
Fig. 3. Trajectory analysis of transitional AT2 cells.
(A) Slingshot-based pseudo-time trajectories calculated from UMAP embedding of 14,462 AT2, SCGB3A2+, transitional AT2, and AT1 cells from PF and control lungs starting from either AT2 (orange) or SCGB3A2+ (purple). The trajectories are calculated independently for each lineage, and the robustness of these lineages is demonstrated in fig. S9. (B) Smoothed expression of lineage markers along pseudo-time trajectories from SCGB3A2+ or AT2. The gray shading indicates 99% CI. (C) RNA-ISH demonstrating AGER+/SFTPC+ cells in control lungs (D) and AGER+/SFTPC+/SCGB3A2+ in PF lungs. Green arrowheads denote colocalized signals. (E and F) Quantification of RNA-ISH from control (n = 4) and PF (n = 5) reporting (E) coexpression of SCGB1A1 and AGER as a proportion of all SFTPC+ cells and (F) coexpression of SFTPC and AGER as a proportion of all SCGB3A2+ cells. Data are presented as means ± 95% CI and distributions compared by two-way ANOVA.
Fig. 4
Fig. 4. KRT5/KRT17+ epithelial cells emerge in PF lungs.
(A) Expression of EPCAM, COL1A1, KRT17, and KRT5 in 37,325 epithelial cells from PF and control lungs. (B) Multiplexed RNA-ISH probing for KRT17, COL1A1, and SFTPC in IPF lung. Original magnification, ×40. (C) Magnification box (×400) from (B). (D to F) Coexpression of COL1A1 and KRT17 in (D and E) two independent IPF lung explants and in (F) a transbronchial biopsy section from an asymptomatic subject with a family history of PF. High-resolution computed tomography corresponding to (F) is shown in fig. S11. (G) Expression of KRT17 in a nonfibrotic control lung. Original magnification, ×400. (H) Selected top genes discriminating KRT5/KRT17+ cells from other lung epithelial cells. Genes were selected from 240 genes up-regulated [logFC, >0.5; false discovery rate (FDR), <0.1] compared to other epithelial cells. (I and J) Multiplexed RNA-ISH probing for KRT5 and KRT17 in (I) a peripheral fibrotic region versus (J) a large airway. (K) Enrichment analysis for Gene Ontology biological processes, pathways, and kinase targets among group enrichment analysis of 227 genes significantly increased in KRT5/KRT17+ cells compared to basal cells (logFC, >0.5; FDR, <0.1). MAP kinase 8, mitogen-activated protein kinase 8.
Fig. 5
Fig. 5. Trajectory analysis of KRT5/KRT17+ cells.
(A and B) Slingshot-based pseudo-time trajectories calculated from UMAP embedding of (A) 6406 AT2, transitional AT2, AT1, and KRT5/KRT17+ cells and (B) 4611 SCGB3A2+, transitional AT2, AT1, and KRT5/KRT17+ cells. Both (A) and (B) are composed entirely of cells from PF samples. Each slingshot trajectory has a single start and a single end point, either AT1 or KRT5/KRT17+. The trajectories were then plotted together, leading to not only the appearance of a branching trajectory but also results in a crossing of trajectories. (C) RNA-ISH demonstrating KRT17+ cells adjacent to SFTPC+ and SCGB3A2+ cells with low-level coexpression of multiple lineage markers in fibrotic regions of PF lung. (D and E) Heatmap depicting relative expression (normalized and scaled z-scored) of the top 400 genes with significant variation across pseudo-time trajectories (generalized additive model; FDR, <0.01) from (D) AT2 or (E) SCGB3A2+ to KRT5/KRT17+ cells. Modules of expression were manually annotated to show stable expression (I), progression toward transitional AT2 (II), progression toward KRT5/KRT17+ (III), and stable KRT5/KRT17+ (IV). (F) Normalized expression levels of transcription factors with binding sites enriched for pseudo-time–associated genes and two representative target genes in each cell type split by control and PF and smoothed across the pseudo-time trajectories. Cells from control samples representing the AT2 to AT1 trajectory are shown (fig. S16) as a comparison. The gray shading represents the 99% CI. (G) A correlation of SOX9 and SOX4 with a putative target gene and known PF biomarker CDKN1A. Each dot represents the average expression of the two genes within an individual. Only individuals with detectable expression of both genes were included. The P values were calculated using a linear regression. (H) RNA-ISH demonstrating colocalization of SOX9 and KRT17 in a PF lung.
Fig. 6
Fig. 6. Characterization of mesenchymal/stromal cell types in PF lung.
(A) UMAP depicting 5232 mesenchymal cells from jointly analyzed PF and control lungs. (B) Distribution of canonical and novel fibroblast subpopulation markers. (C) Expression of selected top discriminating genes among fibroblast subtypes. y axis indicates normalized expression. (D to F) Multiplexed immunofluorescence staining for αSMA (the protein product of ACTA2) and RNA-ISH for LUM (a pan-fibroblast marker) and COL1A1 in (D) PF lung and (F) control lung. (E) ×400 magnification of box from (D). (G and H) Colocalization of RNA-ISH for HAS1 and COL1A1 in IPF lung tissue. (G) ×100 image of subpleural stroma. Rare HAS1+ cells deep to the subpleural region are denoted with white arrows. (H) ×400 magnification of box from (G). Inset with arrows demonstrate COL1A1+ HAS1+ cells. HC, honeycomb cyst; P, pleural; SP, subpleural. (I) Quantification of maximal depth of invasion from the pleural surface of HAS1+ cells in control (n = 2) and PF lungs (n = 6). All HAS1+ cells in at least one ×100 field were counted and depth from the pleural surface measured. (J and K) Multiplexed RNA-ISH probing for fibroblast marker PLIN2, SFTPC (AT2 cells), and COL1A1 from (J) PF and (K) control lung. (L) Schematic summarizing the spatial organization of fibroblast populations identified in PF lungs. (M and N) Cytoscape interactome of the top five most highly coexpressed ligand-receptor (LR) pairs (ranked by the product of mean ligand expression and mean receptor expression for each cell type interaction) for (M) fibroblast ligands and epithelial receptors and (N) epithelial ligands and fibroblast receptors. Edges are colored by the ligand-expressing cell type; arrowheads are colored by the receptor-expressing cell type; red lettering indicates differential expression between PF and control lungs (P < 0.01).

References

    1. Hewlett J. C., Kropski J. A., Blackwell T. S., Idiopathic pulmonary fibrosis: Epithelial-mesenchymal interactions and emerging therapeutic targets. Matrix Biol. 71–72, 112–127 (2018). - PMC - PubMed
    1. Lederer D. J., Martinez F. J., Idiopathic pulmonary fibrosis. N. Engl. J. Med. 378, 1811–1823 (2018). - PubMed
    1. Travis W. D., Costabel U., Hansell D. M., King Jr. T. E., Lynch D. A., Nicholson A. G., Ryerson C. J., Ryu J. H., Selman M., Wells A. U., Behr J., Bouros D., Brown K. K., Colby T. V., Collard H. R., Cordeiro C. R., Cottin V., Crestani B., Drent M., Dudden R. F., Egan J., Flaherty K., Hogaboam C., Inoue Y., Johkoh T., Kim D. S., Kitaichi M., Loyd J., Martinez F. J., Myers J., Protzko S., Raghu G., Richeldi L., Sverzellati N., Swigris J., Valeyre D.; ATS/ERS Committee on Idiopathic Interstitial Pneumonias , An official American Thoracic Society/European Respiratory Society statement: Update of the international multidisciplinary classification of the idiopathic interstitial pneumonias. Am. J. Respir. Crit. Care Med. 188, 733–748 (2013). - PMC - PubMed
    1. Thomas A. Q., Lane K., Phillips J. III, Prince M., Markin C., Speer M., Schwartz D. A., Gaddipati R., Marney A., Johnson J., Roberts R., Haines J., Stahlman M., Loyd J. E., Heterozygosity for a surfactant protein C gene mutation associated with usual interstitial pneumonitis and cellular nonspecific interstitial pneumonitis in one kindred. Am. J. Respir. Crit. Care Med. 165, 1322–1328 (2002). - PubMed
    1. Wang Y., Kuan P. J., Xing C., Cronkhite J. T., Torres F., Rosenblatt R. L., DiMaio J. M., Kinch L. N., Grishin N. V., Garcia C. K., Genetic defects in surfactant protein A2 are associated with pulmonary fibrosis and lung cancer. Am. J. Hum. Genet. 84, 52–59 (2009). - PMC - PubMed

Publication types