. 2020 Jul 15;6(29):eabb0266.
doi: 10.1126/sciadv.abb0266. eCollection 2020 Jul.

Wise or mad crowds? The cognitive mechanisms underlying information cascades

Affiliations

Wise or mad crowds? The cognitive mechanisms underlying information cascades

Alan N Tump et al. Sci Adv. .

Abstract

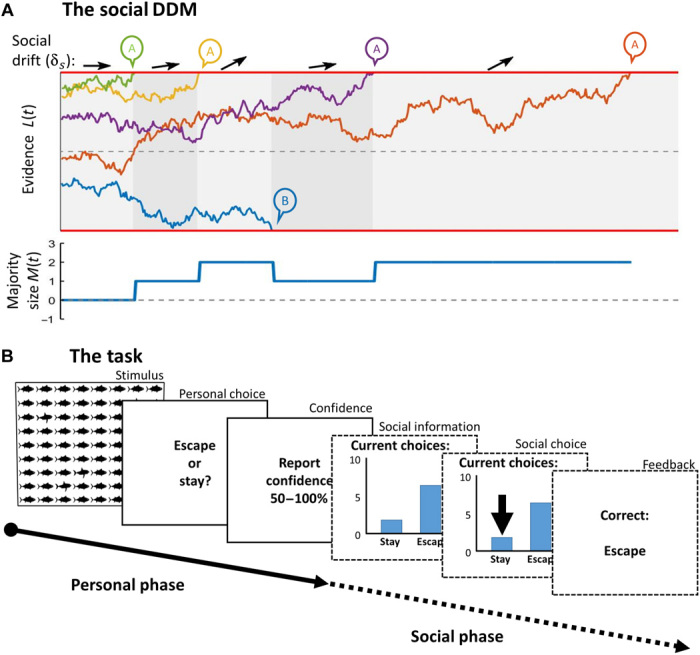
Whether getting vaccinated, buying stocks, or crossing streets, people rarely make decisions alone. Rather, multiple people decide sequentially, setting the stage for information cascades whereby early-deciding individuals can influence others' choices. To understand how information cascades through social systems, it is essential to capture the dynamics of the decision-making process. We introduce the social drift-diffusion model to capture these dynamics. We tested our model using a sequential choice task. The model was able to recover the dynamics of the social decision-making process, accurately capturing how individuals integrate personal and social information dynamically over time and when their decisions were timed. Our results show the importance of the interrelationships between accuracy, confidence, and response time in shaping the quality of information cascades. The model reveals the importance of capturing the dynamics of decision processes to understand how information cascades in social systems, paving the way for applications in other social systems.


Figures

Fig. 1
Fig. 1. Illustration of the social DDM and the experimental paradigm.
(A) A generic example of the social DDM with five individuals, each represented by a jagged line. The start point of each individual indicates the personal evidence accumulated up to that point. At the start, no individual exceeds the choice threshold, and social information is absent, implying no social drift (as indicated by the horizontal arrow). Individuals who begin close to either of the thresholds (red lines) are likely to choose early, providing social information for undecided individuals. This social information affects the rate of evidence accumulation, with the drift rate shifting toward the choice threshold favored by the majority (as indicated by the arrow pointing upward). (B) Stages of the predator detection task. During the personal phase, individuals briefly observe a grid of “sharks” and “tuna.” They then make a personal decision whether to “stay” or “escape” and report their confidence in that decision. In the subsequent social phase, they are asked to make a second decision on whether to “stay” or “escape,” but now, they can freely time their decisions and simultaneously observe the choices of others before doing so. Last, the correct answer is displayed, and the next trial begins (with 40 trials in total).
Fig. 2
Fig. 2. Choice accuracy and the relationship between personal accuracy and confidence.
(A) Accuracy of the personal and social choices. Individuals, on average, achieved a higher decision accuracy during the social choice as compared to the personal choice. Each line connects a participant’s average accuracy during the personal and social choice (n = 141 participants). (B) Participants reporting a higher confidence in their personal choice were more likely to be correct in their personal choice. The points and error bars reflect the mean and the 95% CIs of the posterior distribution from the Bayesian logistic regression model.
Fig. 3
Fig. 3. Empirical results and predictions of the social DDM.
Participants reporting higher confidence in their personal choice (A) improved less and (B) responded earlier during the social choice. (C) The larger the majority favoring the opposing option, the more likely participants were to change their decision. (D) The choices of participants who responded later in the social choice were less accurate in the personal choice (declining blue dots) but improved more in the social choice (indicated by the increasing difference between blue and yellow dots at later RTs). For visualization purposes, RTs are binned by rounding to the closest integer. RTs greater than 13 s (less than 1%) were assigned to the 12-s bin. (A to D) The dashed lines show the choices and RTs predicted by the social DDM, accurately capturing all relationships. For frequency distributions, see fig. S2. (E) Participants improved most when more confident individuals were more accurate (i.e., positive confidence-accuracy correlation; yellow dots) and responded earlier (i.e., negative accuracy-RT correlation; see Methods for details). Numbers indicate the number of trials. For all panels, the points and error bars depict the mean and the 95% CIs of the posterior distribution of the Bayesian regression model.
Fig. 4
Fig. 4. Model comparison and individual- and group-level fittings of the social DDM for different group sizes.
(A) The DIC values of all models relative to the model with the lowest DIC. The model with the lowest DIC (i.e., preferred model) features a (i) confidence-dependent start point, (ii) drift toward the initially chosen option, and (iii) social drift. (B) Participants reporting higher confidence in the correct/incorrect choice started closer to the correct/incorrect choice threshold at y value of 1/0. (C) Evidence tended to drift toward the choice threshold of the option chosen during the personal phase. (D) The larger the majority favoring an option, the more strongly participants drifted toward the choice threshold favored by the majority. Participants in smaller groups had a stronger drift given the same majority size. (E) The choice threshold θ, reflecting a participant’s willingness to wait for social information, did not differ between group sizes. Gray lines/dots represent individual-level fittings; colored lines/dots represent the estimates on a group size level. Group size ranged from small (n = 3) to medium (n = 7 to 10), to large (n = 15 to 17).
Fig. 5
Fig. 5. Agent-based simulations of the social DDM.
The predicted improvement for different choice thresholds, for situations in which confident agents are more accurate (yellow dots), as accurate (black dots), or less accurate (blue dots) than unconfident agents. (A) Groups with a high average personal accuracy improved, unless confident agents were less accurate than unconfident ones. (B and C) Groups with a personal accuracy of 50 and 30% only improved when confident agents were more accurate than unconfident ones. At all levels of personal accuracy, a higher choice threshold strengthened the positive (negative) impact of confident individuals being more (less) accurate.

References

    1. Anderson L. R., Holt C. A., Information cascades in the laboratory. Am. Econ. Rev. 87, 847–862 (1997).
    1. Bikhchandani S., Hirshleifer D., Welch I., Learning from the behavior of others: Conformity, fads, and informational cascades. J. Eco. Perspect. 12, 151–170 (1998).
    1. C. Frydman, I. Krajbich, Using Response Times to Infer Others’ Beliefs: An Application to Information Cascades (May 8, 2019). Available at SSRN: https://ssrn.com/abstract=2817026.
    1. Vosoughi S., Roy D., Aral S., The spread of true and false news online. Science 359, 1146–1151 (2018). - PubMed
    1. Faria J. J., Krause S., Krause J., Collective behavior in road crossing pedestrians: The role of social information. Behav. Ecol. 21, 1236–1242 (2010).

Publication types

LinkOut - more resources