. 2020 Jul 17;6(29):eabb5277.
doi: 10.1126/sciadv.abb5277. eCollection 2020 Jul.

Dynamic allosteric communication pathway directing differential activation of the glucocorticoid receptor

Affiliations

Dynamic allosteric communication pathway directing differential activation of the glucocorticoid receptor

C Köhler et al. Sci Adv. .

Abstract

Allosteric communication within proteins is a hallmark of biochemical signaling, but the dynamic transmission pathways remain poorly characterized. We combined NMR spectroscopy and surface plasmon resonance to reveal these pathways and quantify their energetics in the glucocorticoid receptor, a transcriptional regulator controlling development, metabolism, and immune response. Our results delineate a dynamic communication network of residues linking the ligand-binding pocket to the activation function-2 interface, where helix 12, a switch for transcriptional activation, exhibits ligand- and coregulator-dependent dynamics coupled to graded activation. The allosteric free energy responds to variations in ligand structure: subtle changes gradually tune allostery while preserving the transmission pathway, whereas substitution of the entire pharmacophore leads to divergent allosteric control by apparently rewiring the communication network. Our results provide key insights that should aid in the design of mechanistically differentiated ligands.


Figures

Fig. 1
Fig. 1. Overview of the GR LBD structure and location of methionine residues.
(A) Ribbon representation of the GR LBD (gray), with the side chains of the 13 methionine residues shown in stick representation (black with yellow sulfur). The ligand cortisol (green) binds in the ligand-binding pocket, and the TIF2 coactivator peptide (yellow) binds at the AF-2 site. (B) Comparison of the methionine methyl region of the 1H-13C HSQC spectra of three different GRwt-ligand-TIF2 ternary complexes. The spectra are color-coded to indicate the bound ligand: cortisol (green), dex (magenta), and dibC (orange). Peaks annotated with residue number correspond to methionine side chains shown in (C) and (D). M560 and M639, which show the largest conformational changes, are highlighted with boxes (full or dashed). The minor chemical shift changes observed for M752 likely reflect changes in the relative populations of helix 12 conformational states (see table S1). (C and D) Close-up views of the ligand-binding pocket with the three ternary complexes superimposed showing the ligands and key methionine side chains in stick representation. Protein Data Bank (PDB) accession codes: GR-cortisol-TIF2, 4P6X (47); GR-dex-TIF2, 4UDC (6); GR-dibC-TIF2, 4UDD (6).
Fig. 2
Fig. 2. Conformational exchange detected for the backbone and methionine side chains in GR LBD.
(A) Side-chain 13C CPMG relaxation dispersion data for M752 and M565 for GRF602S-dex-TIF2. Blue and red symbols represent data acquired at static magnetic field strengths of 14.1 and 18.8 T, respectively. (B) Location of exchanging residues in GR LBD. Residues showing significant CPMG relaxation dispersion profiles are colored dark blue (15N backbone data; fig. S1) or violet (13C methionine methyl data), whereas nonquantifiable but exchange-broadened residues are colored light blue (15N backbone) or pink (13C methionine methyl, 15N tryptophan indole). The exchanging backbone amides are located in helices 1, 3, 5, 7, 9, 11, and 12 and a loop proximal to helix 1. The exchanging side chains are M565, M601 and M752, and W577 and W600. PDB accession code for GR-dex-TIF2: 4UDC (6).
Fig. 3
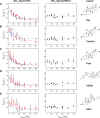
Fig. 3. Methyl 13C CPMG relaxation dispersion data for residue M752.
Data for five different GRwt-ligand-TIF2 (left) and GRwt-ligand-PRGC1 (right) complexes. The ligand structures are indicated to the right of the panels showing CPMG dispersion data: (A) dex, (B) cortisol, (C) pred, (D) cortivazol analog (AZ938), and (E) dibC. In fitting exchange parameters for the different complexes, we fixed ΔδCPMG for M752 to the value obtained from the global fit for GRF602S-dex-TIF2. Data for GRwt-ligand-TIF2 were acquired at static magnetic field strengths of 14.1 T (blue) and 20.0 T (red). Data for GRwt-ligand-PRGC1 were acquired at a static magnetic field strength of 18.8 T.
Fig. 4
Fig. 4. GR reporter gene assay data.
Agonist activity at the human GR monitored in a GRE-lacZ–transfected ChagGo-K-1 cell-based reporter assay. The induction of lacZ gene expression through the binding of ligand-bound GR to the glucocorticoid response element in the promoter of lacZ is measured as the up-regulation of the β-galactosidase activity through a change in absorbance. The assay was run on at least three separate occasions for each ligand. See Materials and Methods for details.
Fig. 5
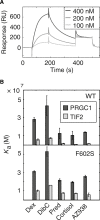
Fig. 5. SFR experiments characterizing coregulator-binding affinities to various GR-ligand complexes.
(A) Representative sensorgrams showing the SPR response upon binding versus time. (B) Histograms showing the variation in Ka of coregulator peptide binding to the ligand complexes of GRwt and GRF602S. The error bars indicate 1 SD (n = 3). Table S2 lists the SPR results in detail, including koff, kon, and error estimates, and fig. S3 shows the corresponding histograms.
Fig. 6
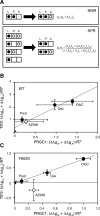
Fig. 6. Allosteric coupling between sites in GR LBD.
(A) Statistical thermodynamic model of ligand and coregulator binding and activation of GR LBD relating to the current experimental results (see fig. S4 for the full model). The model includes three sites: the ligand-binding site, L; the coregulator-binding site, P; and transcriptional activation, A. Filled circles indicate bound sites; empty circles indicate unbound but binding-competent sites; boxes without circles indicate binding-incompetent sites. Top: NMR measures the population ratio between minor (inactive) and major (active) states, pm/pM. Bottom: SPR measures the population ratio of bound and free states: pB/pF. Ki = exp(−ΔGi/RT), fij = exp(−Δgij/RT), XP = exp(−Δgbi/RT) [C]. ΔGi, free energy of forming a binding-competent site; Δgij, cooperativity between sites i and j; Δgbi, free energy of coregulator binding to competent site; [C], concentration of free coregulator. (B) Covariance plot showing the relative free energy of cooperativity for TIF2 or PRGC1 binding to different GRwt-ligand complexes, referenced to the GRwt-cortisol complex: ΔΔgLP + a minor contribution from ΔΔgLA. Empty circle, data involving AZ938; filled circles, data involving the four congeneric ligands. Error bars: 1 SD (table S3). Straight lines: Best-fit linear regression, excluding AZ938. Weighted Pearson’s correlation coefficient R = 0.98 with 95% confidence interval (0.41 to 0.99). (C) Data as in (B), but for GRF602S. R = 0.998 (0.919 to 0.999). The confidence interval of R was estimated using 10,000 Monte Carlo samples drawn from a binormal distribution, with widths taken from the experimental SDs (46).

References

    1. Weikum E. R., Knuesel M. T., Ortlund E. A., Yamamoto K. R., Glucocorticoid receptor control of transcription: Precision and plasticity via allostery. Nat. Rev. Mol. Cell Biol. 18, 159–174 (2017). - PMC - PubMed
    1. Cain D. W., Cidlowski J. A., Specificity and sensitivity of glucocorticoid signaling in health and disease. Best Pract. Res. Clin. Endocrinol. Metab. 29, 545–556 (2015). - PMC - PubMed
    1. Keenan C. R., Lew M. J., Stewart A. G., Biased signalling from the glucocorticoid receptor: Renewed opportunity for tailoring glucocorticoid activity. Biochem. Pharmacol. 112, 6–12 (2016). - PubMed
    1. Buttgereit F., Can we shift the benefit–risk ratio of glucocorticoids? Lancet Rheumatol. 2, E5–E6 (2020). - PubMed
    1. Bledsoe R. K., Montana V. G., Stanley T. B., Delves C. J., Apolito C. J., McKee D. D., Consler T. G., Parks D. J., Stewart E. L., Willson T. M., Lambert M. H., Moore J. T., Pearce K. H., Xu H. E., Crystal structure of the glucocorticoid receptor ligand binding domain reveals a novel mode of receptor dimerization and coactivator recognition. Cell 110, 93–105 (2002). - PubMed

Publication types