. 2020 Jul 29;6(31):eabb0806.
doi: 10.1126/sciadv.abb0806. eCollection 2020 Jul.

IL-10-producing Tfh cells accumulate with age and link inflammation with age-related immune suppression

Affiliations

IL-10-producing Tfh cells accumulate with age and link inflammation with age-related immune suppression

Maha Almanan et al. Sci Adv. .

Abstract

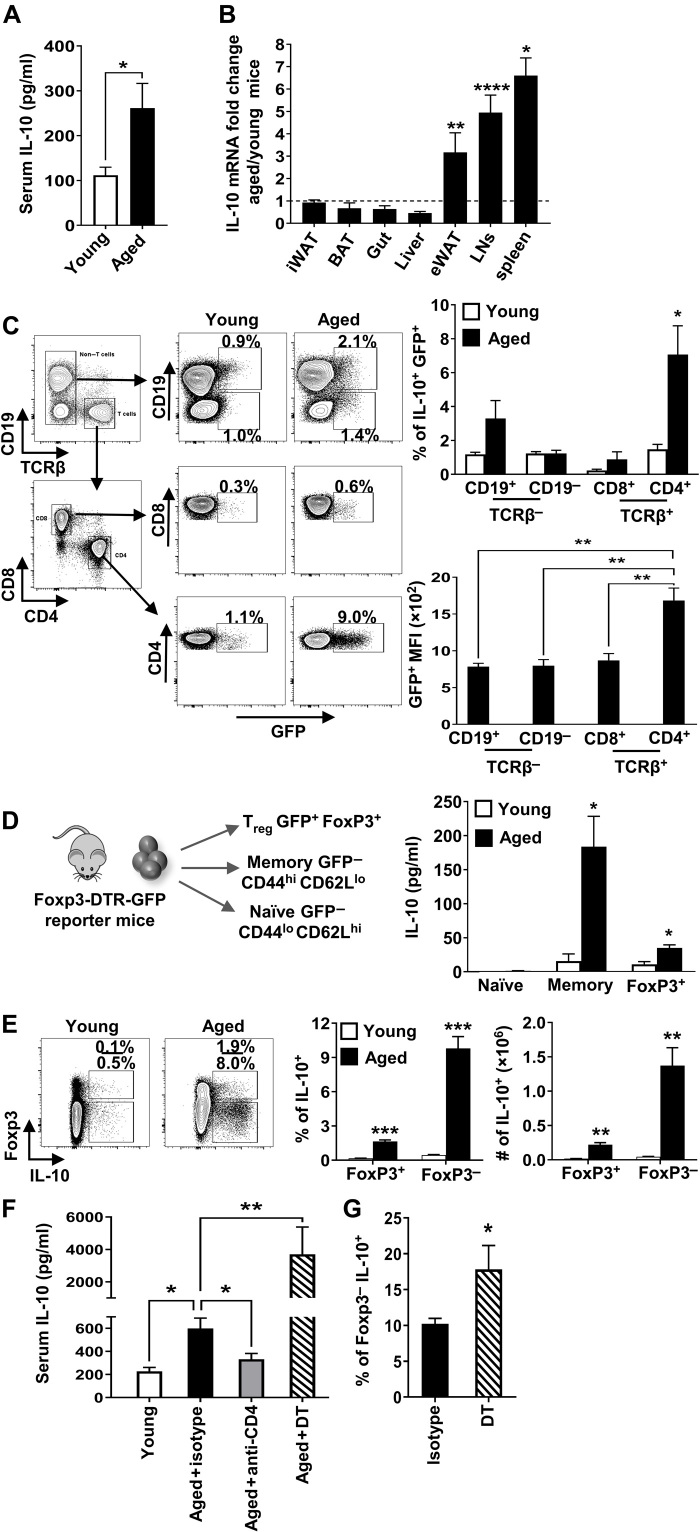
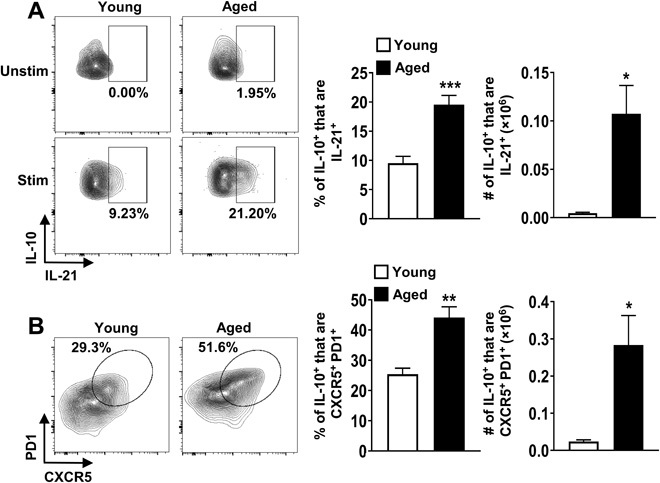
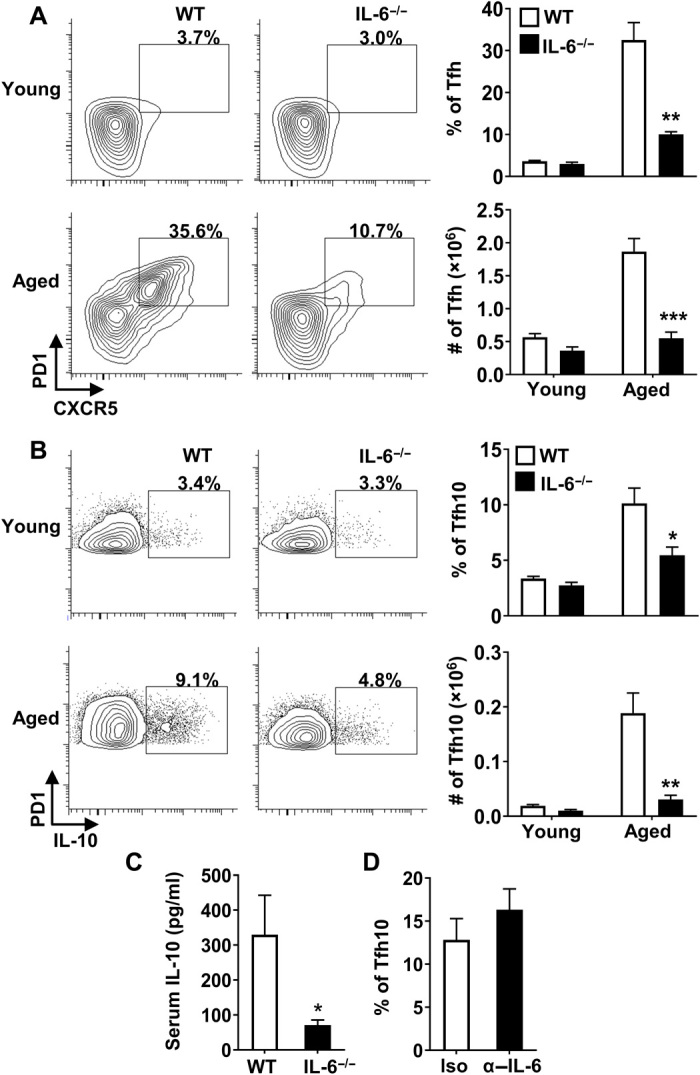
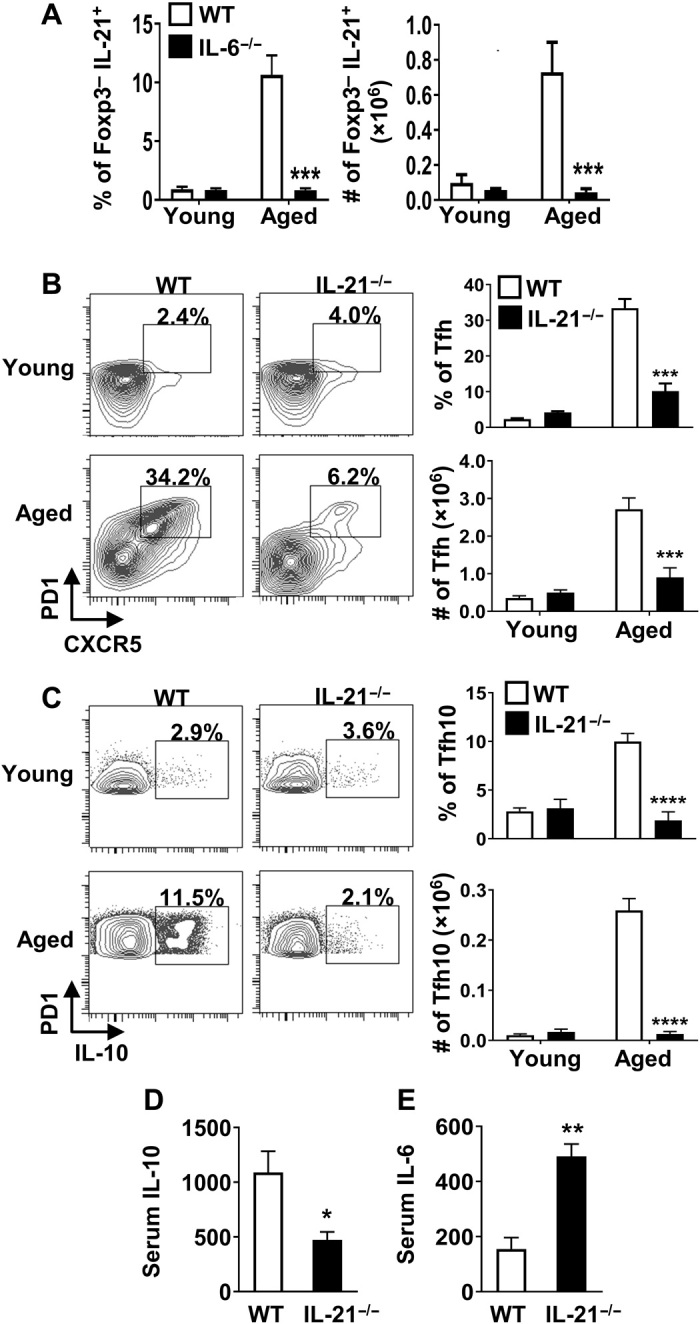
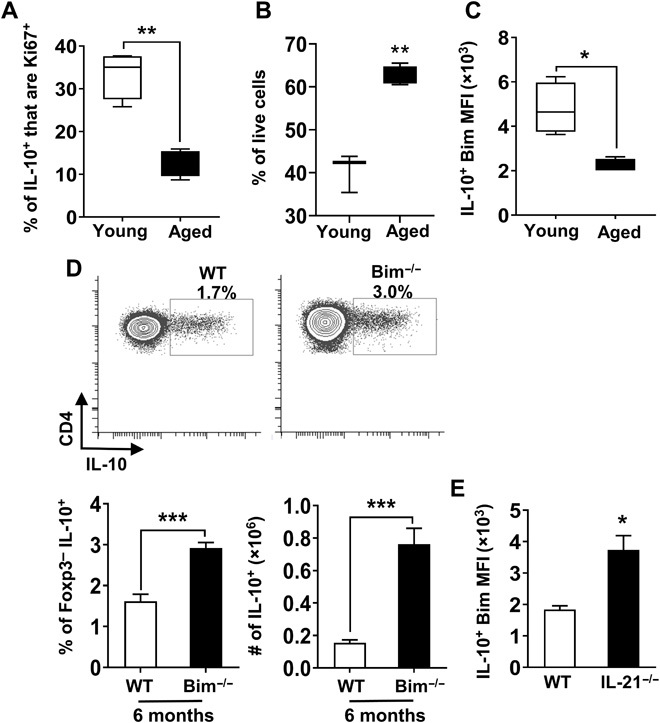
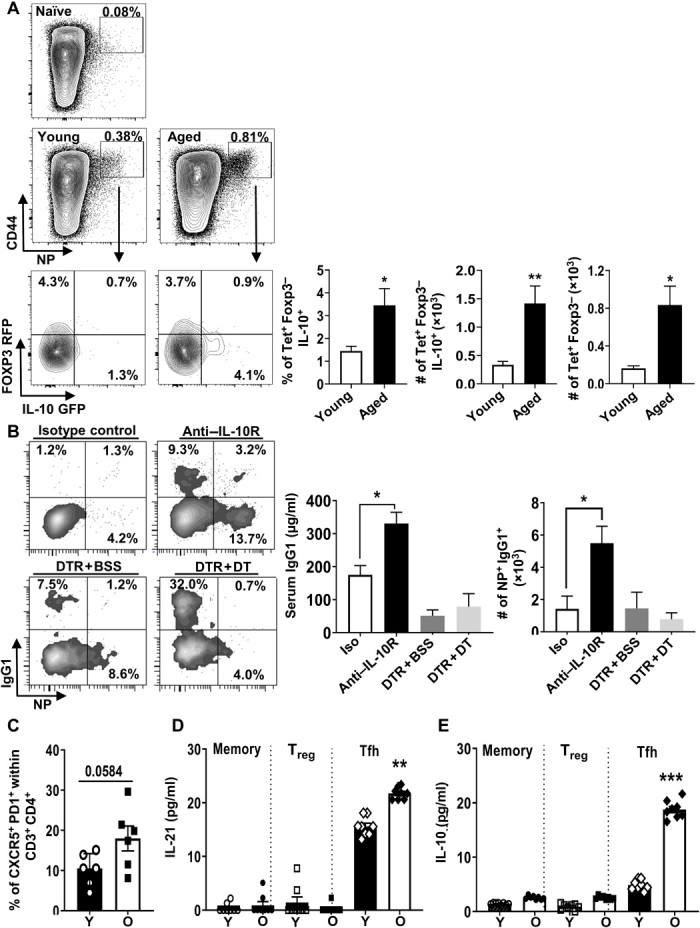
Aging results in profound immune dysfunction, resulting in the decline of vaccine responsiveness previously attributed to irreversible defects in the immune system. In addition to increased interleukin-6 (IL-6), we found aged mice exhibit increased systemic IL-10 that requires forkhead box P3-negative (FoxP3-), but not FoxP3+, CD4+T cells. Most IL-10-producing cells manifested a T follicular helper (Tfh) phenotype and required the Tfh cytokines IL-6 and IL-21 for their accrual, so we refer to them as Tfh10 cells. IL-21 was also required to maintain normal serum levels of IL-6 and IL-10. Notably, antigen-specific Tfh10 cells arose after immunization of aged mice, and neutralization of IL-10 receptor signaling significantly restored Tfh-dependent antibody responses, whereas depletion of FoxP3+ regulatory and follicular regulatory cells did not. Thus, these data demonstrate that immune suppression with age is reversible and implicate Tfh10 cells as an intriguing link between "inflammaging" and impaired immune responses with age.


Figures

Fig. 1
Fig. 1. Aged mice have increased systemic levels of IL-10.
(A) Serum IL-10 (means ± SEM) levels in young (4 months, n = 6) and aged (18 months, n = 5) mice, representative of four independent experiments. (B) Mean fold change in IL-10 mRNA gene expression (means ± SEM) from the spleen, liver, gut, lymph nodes (LNs), inguinal white adipose tissue (iWAT), epididymal white adipose tissue (eWAT), and brown adipose tissue (BAT) from individual young (2 months, n = 4 to 8) and aged (21 months, n = 5 to 9) C57BL/6 mice. Dashed line represents equal aged:young ratio. Data pooled from two independent experiments. (C) Splenocytes from young (1.5 months, n = 3) and aged (18 months, n = 5) IL-10gfp (VertX) mice were analyzed by flow cytometry. Upper graph shows the frequency of cells that are green fluorescent protein–positive (GFP+) (means ± SEM). Lower graph shows the average level of GFP expression in aged CD4+, CD8+, CD19+, and CD19 that are GFP+ (means ± SEM). (D) IL-10 levels (means ± SEM) from phorbol 12-myristate 13-acetate and ionomycin (P + I)–stimulated cells sorted from young (3.5 months, n = 4) and aged (24 months, n = 4) FoxP3–internal ribosomal entry site (IRES)–diphtheria toxin receptor (DTR)–GFP mice. (E) Gating strategy, frequencies, and numbers of FoxP3+ or FoxP3 that are IL-10+ from P + I–stimulated splenocytes from young (1.5 months, n = 4) and aged (23 months, n = 4) C57BL/6 mice (means ± SEM). (F) Serum IL-10 levels (means ± SEM) in young (2.5 months, n = 6) and aged (18 months, n = 14) C57BL/6 mice treated with anti-CD4 or isotype control or DT-treated FoxP3-DTR mice (19 months, n = 6). Data are pooled from two independent experiments. (G) Percentage of FoxP3 splenocytes that are IL-10+ (means ± SEM) from aged (18 months, n = 8) and DT-treated FoxP3-DTR (19 months, n = 6) mice. *P ≤ 0.05, **P ≤ 0.01, ***P ≤ 0.001, and ****P ≤ 0.0001, Student’s t test. MFI, mean fluorescence intensity.
Fig. 2
Fig. 2. IL-10–producing FoxP3CD4+ T cells in aged mice are predominantly Tfh cells.
(A) Splenocytes from young (2 months, n = 6) and aged (18 months, n = 6) C57BL/6 mice were stimulated with P + I, stained with antibodies against TCRβ, CD8, FoxP3, IL-10, and IL-21, and analyzed by flow cytometry. The representative plots and graphs show the frequencies and total numbers of IL-21+ cells originating from FoxP3IL10+ cells (means ± SEM). Data are representative of at least two independent experiments. (B) Splenocytes from young (2 months, n = 4) and aged (18 months, n = 4) C57BL/6 mice were stimulated as above and stained with antibodies against TCRβ, CD8, FoxP3, CXCR5, PD1, and IL-10 and analyzed by flow cytometry. The representative plots and graphs show the frequencies and total numbers of CXCR5+PD1+ cells originating from FoxP3IL10+ cells (means ± SEM). *P ≤ 0.05, **P ≤ 0.01, and ***P ≤ 0.001, Student’s t test.
Fig. 3
Fig. 3. IL-6 is required for Tfh10 cells and for elevated levels of IL-10 in aged mice.
(A and B) Splenocytes from young (2 months, n ≥ 4 per group) and aged (17 months, n ≥ 4 per group) C57BL/6 or IL-6−/− mice were stimulated with P + I, stained with antibody against TCRβ, CD8, CXCR5, PD1, FoxP3, and IL-10 and analyzed by flow cytometry. The representative plots and bar graphs show the frequency and total number of FoxP3 that are (A) CXCR5+PD1+ and (B) those that produce IL-10 (means ± SEM). (C) Aged C57BL/6 (17 months, n = 9) and IL-6−/− (17 months, n = 9) mice were intravenously injected with biotinylated anti–IL-10 antibodies, serum was collected 24 hours later, and IL-10 levels were measured by ELISA. Graph shows the average serum IL-10 (means ± SEM). (D) Aged C57BL/6 mice were treated with isotype control (19 months, n = 6) or α–IL-6 blocking antibody (19 months, n = 8) on day 0 and euthanized on day 2. Splenocytes were stimulated with P + I, stained with antibody against TCRβ, CD8, PD1, FoxP3, and IL-10, and analyzed by flow cytometry. The representative bar graph shows the frequency of FoxP3 that are IL-10+ (means ± SEM). *P ≤ 0.05, **P ≤ 0.01, and ***P ≤ 0.001, Student’s t test.
Fig. 4
Fig. 4. IL-21 contributes to accrual of Tfh10 cells and regulates the systemic IL-6/IL-10 balance.
(A) Splenocytes from young (2.5 months, n ≥ 4 per group) and aged (16 months, n ≥ 4 per group) C57BL/6 or IL-6−/− mice were stimulated with P + I, stained with antibody against TCRβ, CD8, FoxP3, and IL-21, and analyzed by flow cytometry. Bar graphs show the frequency and total number of FoxP3 that are IL-21+ (means ± SEM). (B and C) Splenocytes from young (2 months, n ≥ 4 per group) or aged (17 months, n ≥ 3 per group) C57BL/6 or IL-21−/− mice were stimulated as above, stained with antibody against TCRβ, CD8, CXCR5, PD1, FoxP3, and IL-10, and analyzed by flow cytometry. The representative plots and bar graphs show the frequency and total number of FoxP3 cells that are (B) CXCR5+PD1+ and (C) those that produce IL-10 (means ± SEM). Data are pooled from two independent experiments. (D and E) Aged C57BL/6 (17 months, n = 4) and IL-21−/− (17 months, n = 3) mice were intravenously injected with biotinylated anti–IL-10 and anti–IL-6 capturing antibodies, serum was collected 24 hours later, and IL-10 and IL-6 levels were measured by ELISA. Graphs show the average serum (D) IL-10 and (E) IL-6 (means ± SEM). *P ≤ 0.05, **P ≤ 0.01, ***P ≤ 0.001, and ****P ≤ 0.0001, Student’s t test.
Fig. 5
Fig. 5. IL-21–driven repression of Bim in aged Tfh10 cells results in their enhanced survival.
Splenocytes from young (1.5 months, n = 4) and aged (18 months, n = 4) mice were stimulated with P + I, stained, and analyzed by flow cytometry. (A) Graph shows the frequency of FoxP3 IL-10+ cells that are Ki67+ (means ± SEM). (B) Spleen cells were pooled from young (2 months, n = 9) and aged (18 months, n = 6) IL-10gfp (VertX) mice, and CXCR5+PD1+GFP+ cells were fluorescence-activated cell sorting (FACS)–sorted and cultured. After 15 hours in culture, cells were stained for FoxP3 and a viability dye. Graph shows the percentage of live cells in gated FoxP3 cells (means ± SEM). (C) Splenocytes from young (2 months, n = 4) and aged (18 months, n = 4) mice were stimulated as mentioned in (A). Graph shows the level of expression of Bim in FoxP3IL-10+ cells (means ± SEM). (D) Splenocytes from 6-month-old WT C57BL/6 and Bim−/− mice (n = 6 per group) were stimulated as mentioned in (A), stained, and analyzed by flow cytometry. Plots and bar graphs show the frequency and total number of FoxP3 that are IL-10+ (means ± SEM). (E) Splenocytes from aged (17 months, n = 3 to 4 per group) C57BL/6 or IL-21−/− mice were stimulated as mentioned in (A), stained, and analyzed by flow cytometry. Graph shows the levels of expression of Bim in FoxP3CXCR5+PD1+ that are IL-10+ cells (means ± SEM). *P ≤ 0.05, **P ≤ 0.01, and ***P ≤ 0.001, Student’s t test.
Fig. 6
Fig. 6. IL-10–producing Tfh cells emerge after vaccination, and IL-10, but neither Tregs nor Tfr cells, limits Tfh-dependent vaccine responses in aged mice.
(A) Plots show IAb-NP tetramer staining in immunized and unimmunized young (3.5 months, n = 5) and aged (18 months, n = 5) IL-10GFP–FOXP3RFP dual-reporter mice. Graphs show the frequency and number of NP-specific FoxP3CD4+ T cells that are IL-10+ and the number of NP-specific FoxP3IL-10+ T cells that are CXCR5+PD1+ (means ± SEM). (B) Aged (17 months, n ≥ 7) WT C57BL/6 (isotype or anti–IL-10) and (20 months, n = 5) FoxP3DTR [phosphate-buffered saline (PBS)– or DT-treated] mice were immunized with nitrophenol-keyhole limpet hemocyanin (NP-KLH) in alum. Plots display the frequency of germinal center (GC) B cells (NP-specific) gated on Fas+GL7+. Graphs show the frequency and number of B cells that are IgG1+NP+ (means ± SEM) and serum levels of immunoglobulin (Ig) specific for NP (IgG1) (means ± SEM). Data are pooled from two independent experiments. (C to E) Tfh10 cells accumulate during aging in humans. Human spleen cells from young (Y) (median, 18.8; range, 18 to 26 years; three males and five females) and old (O) (median, 62; range, 60 to 67 years; four males and four females) individuals were analyzed by flow cytometry. (C) The frequencies of CD3+CD4+CD45RO+FoxP3 that are CXCR5+PD1+ (means ± SEM). (D and E) CD4+ T cells were bead-purified by negative selection; FACS-sorted memory CD4+ T cells (CD45RO+) into Tfh cells (CD25CD127+PD1+CXCR5+), Tregs (CD25+CD127PD1CXCR5), and other memory cells (CD25CD127+PD1CXCR5) were either stimulated in vitro with anti-CD3/CD28 beads or unstimulated, and cytokines were analyzed by Luminex (means ± SEM). Each individual is represented by a symbol. *P ≤ 0.05, **P ≤ 0.01, and ***P ≤ 0.001, Student’s t test. BSS, balanced salt solution.

References

    1. Lord J. M., The effect of ageing of the immune system on vaccination responses. Hum. Vaccin. Immunother. 9, 1364–1367 (2013). - PMC - PubMed
    1. Ferrucci L., Fabbri E., Inflammageing: Chronic inflammation in ageing, cardiovascular disease, and frailty. Nat. Rev. Cardiol. 15, 505–522 (2018). - PMC - PubMed
    1. Maggio M., Guralnik J. M., Longo D. L., Ferrucci L., Interleukin-6 in aging and chronic disease: A magnificent pathway. J. Gerontol. A Bio. Sci. Med. 61, 575–584 (2006). - PMC - PubMed
    1. Lustig A., Liu H. B., Metter E. J., An Y., Swaby M. A., Elango P., Ferrucci L., Hodes R. J., Weng N. P., Telomere shortening, inflammatory cytokines, and anti-cytomegalovirus antibody follow distinct age-associated trajectories in humans. Front. Immunol. 8, 1027 (2017). - PMC - PubMed
    1. Lio D., Scola L., Crivello A., Colonna-Romano G., Candore G., Bonafè M., Cavallone L., Franceschi C., Caruso C., Gender-specific association between -1082 IL-10 promoter polymorphism and longevity. Genes Immun. 3, 30–33 (2002). - PubMed

Publication types