. 2020 Jul 27:15:2633105520942480.
doi: 10.1177/2633105520942480. eCollection 2020.

Host Akkermansia muciniphila Abundance Correlates With Gulf War Illness Symptom Persistence via NLRP3-Mediated Neuroinflammation and Decreased Brain-Derived Neurotrophic Factor

Affiliations

Host Akkermansia muciniphila Abundance Correlates With Gulf War Illness Symptom Persistence via NLRP3-Mediated Neuroinflammation and Decreased Brain-Derived Neurotrophic Factor

Diana Kimono et al. Neurosci Insights. .

Abstract

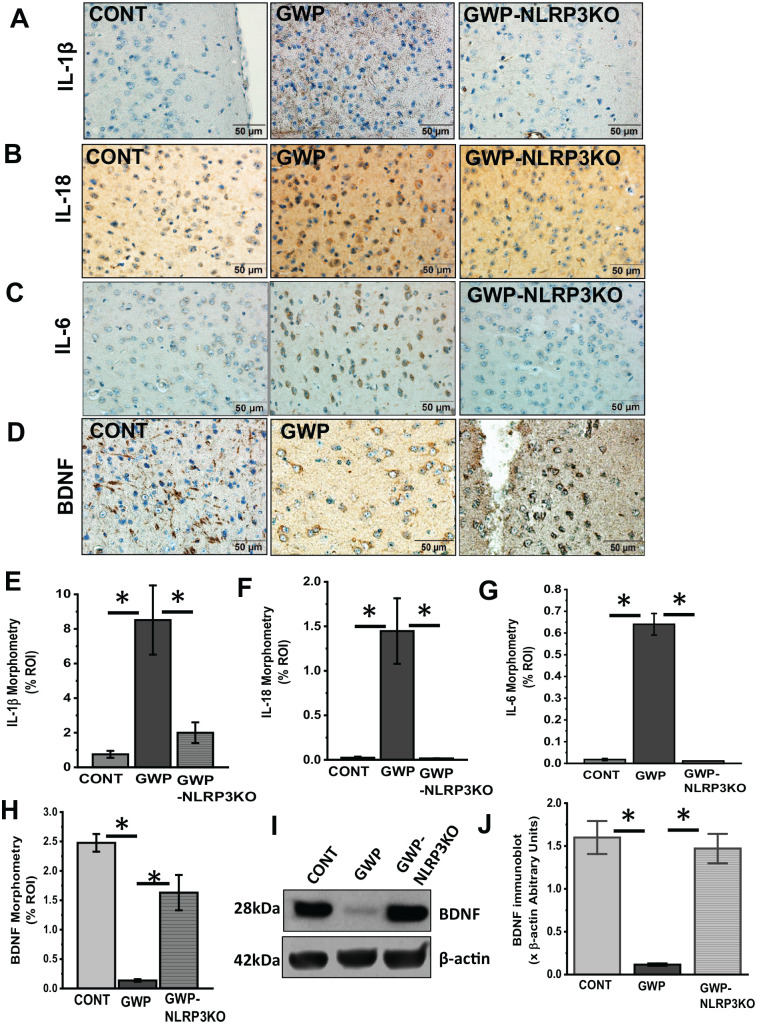
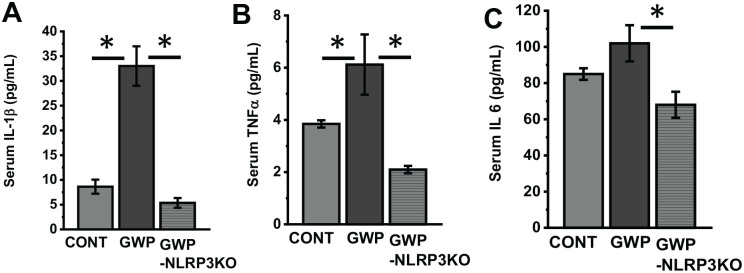
Neurological disorders are commonly reported among veterans who returned from the Gulf war. Veterans who suffer from Gulf War illness (GWI) complain of continued symptom persistence that includes neurological disorders, muscle weakness, headaches, and memory loss, that developed during or shortly after the war. Our recent research showed that chemical exposure associated microbial dysbiosis accompanied by a leaky gut connected the pathologies in the intestine, liver, and brain. However, the mechanisms that caused the symptoms to persist even 30 years after the war remained elusive to investigators. In this study, we used a rodent model of GWI to investigate the persistence of microbiome alterations, resultant chronic inflammation, and its effect on neurotrophic and synaptic plasticity marker BDNF. The results showed that exposure to GW chemicals (the pesticide permethrin and prophylactic drug pyridostigmine bromide) resulted in persistent pathology characterized by the low relative abundance of the probiotic bacteria Akkermansia muciniphila in the gut, which correlated with high circulatory HMGB1 levels, blood-brain barrier dysfunction, neuroinflammation and lowered neurotrophin BDNF levels. Mechanistically, we used mice lacking the NLRP3 gene to investigate this inflammasome's role in observed pathology. These mice had significantly decreased inflammation and a subsequent increase in BDNF in the frontal cortex. This suggests that a persistently low species abundance of Akkermansia muciniphila and associated chronic inflammation due to inflammasome activation might be playing a significant role in contributing to chronic neurological problems in GWI. A therapeutic approach with various small molecules that can target both the restoration of a healthy microbiome and decreasing inflammasome activation might have better outcomes in treating GWI symptom persistence.

Keywords: 3-nitrotyrosine; Akkermansia muciniphila; BDNF; Dysbiosis; NLRP3; RAGE; inflammasomes; peroxynitrite.


Conflict of interest statement

Declaration of Conflicting Interests:The author(s) declared no potential conflicts of interest with respect to the research, authorship, and/or publication of this article.

Figures

Figure 1.
Figure 1.
Exposure to GW chemicals results in decreased relative abundance of Akkermansia muciniphila and chronic high levels of circulatory HMGB1. (A) Percentage abundance of gut bacteria species. Percentage abundance of 10 most abundant species in the gut bacteriome are represented comparing GW chemical treated groups (GWP) to vehicle control treated group groups (CONT). Data are represented as the mean of 6 mice per group. (B) Percentage relative abundance of A muciniphila. Percentage relative abundance was determined from duplicate fecal samples of 5 mice per group treated with GW chemicals (GWP) compared with mice treated with vehicle control only (CONT). Data are represented as mean ± SEM (*P < .05; n = 5). (C) Serum HMGB1 levels. Western blot of HMGB1 levels in serum for mice treated with GW chemicals (GWP) compared with mice treated with vehicle control (CONT) only. Data are represented as mean ± SEM. (D) Densitometry of HMGB1 immunoblots, normalized against Ponceau red (*P < .05; n = 6). (E) Relationship between A muciniphila and circulatory HMGB1 levels. A correlative analysis was carried out to determine how A muciniphila is related to serum HMGB1 levels. We found a negative correlation between A muciniphila and serum HMGB1 levels (Pearson’s r = −0.50; R2 COD = 0.255 shaded area represents 95% confidence bands). GW indicates Gulf War; SEM, standard error of the mean; COD, coefficient of dipersion.
Figure 2.
Figure 2.
Exposure to GW chemicals is associated with altered Claudin 5 levels in the frontal cortex. (A) Claudin 5 mRNA levels in the frontal cortex: mRNA levels of Claudin 5 as studied by RTqPCR show that mice exposed to GW chemicals (GWP) had significantly decreased Claudin 5 mRNA levels compared with mice treated with vehicle control only (CONT). (B) Claudin 5 protein levels in frontal cortex. Western blot analysis of Claudin 5 protein levels in CONT and GWP treated mice. (C) Morphometry analysis of Claudin 5 immunoblots, normalized against β-actin (*P < .05; n = 6). Data are represented as mean ± SEM. (D) Representative immunofluorescence micrographs of the blood-brain barrier showing colocalization of tight junction protein Claudin 5 (labeled in red) and endothelial cell marker CD31 (labeled in green) as yellow spots around a BBB (magnification 60× and scale bar 10 µm) and DAPI stained nucleus (labeled in blue). See Supplemental Figure S2 for images of separate channels. Inset (magnification 40× and scale bar 20 µm) shows the whole micrograph field, from which the main image was obtained. (E) Quantitative morphometry analysis of colocalizations for every 100 cells represented as % ROI (*P < .05; n = 6). Data are represented as mean ± SEM. BBB indicates blood-brain barrier; GW, Gulf War; SEM, standard error of the mean; ROI, region of interest.
Figure 3.
Figure 3.
Activation of macrophages and associated HMGB1/RAGE complex formation. (A) TMEM119 immunoreactivity in frontal cortex. Representative immunohistochemistry micrographs of TMEM 119 reactivity in control (CONT) and GW chemical treated (GWP) mice (magnification 40× and scale bar 50 µm). (B) Morphometric analysis (represented as % ROI) obtained from 10 to 15 images from different microscopy fields from each mouse sample. Data are represented as mean ± SEM (*P < .05; n = 6). (C) Western blots of RAGE protein levels in the frontal cortex of GWP and CONT treated mice. (D) Morphometry analysis of all immunoblots normalized against β-actin (n = 5) (*P < .05; n = 6). Data are represented as mean ± SEM. (E) RAGE/HMGB1 complex formation. HMGB1 (labeled in red) and RAGE (labeled in green) and DAPI stained nucleus (labeled in blue) in GWP and CONT mice. Colocalizations are shown as yellow dots and marked with arrows in the micrographs (magnification 40× and scale bar 20 µm). See Supplemental Figure S3 for images of separate channels. (F) Morphometric analysis (represented as % ROI) obtained from 6 to 8 images from different microscopy fields from each mouse sample. Data are represented as mean ± SEM. (*P < .05; n = 6). GW indicates Gulf War; SEM, standard error of the mean; ROI, region of interest.
Figure 4.
Figure 4.
Increased ROS is associated with NLRP3 inflammasome activation. (A) 3-nitrotyrosine immunoreactivity in frontal cortex. Representative immunohistochemistry micrographs of 3-nitrotyrosine reactivity in control (CONT) and GW chemical treated (GWP) mice (magnification 40× and scale bar 50 µm). (B) Morphometric analysis (represented as % ROI) obtained from 10 to 15 images from different microscopy fields from each mouse sample. Data are represented as Mean ± SEM (*P < .05; n = 6). (C) Immunofluorescence micrographs showing activation of NLRP3 inflammasome protein. NLRP3 (labeled red) ASC2 (labeled in green) and DAPI stained nucleus (labeled in blue) in GWP and CONT mice. Colocalizations are shown as yellow dots and marked with arrows in the micrographs. See Supplemental Figure S4 for images of separate channels. Magnification 60× and scale bar 20 µm. (D) Morphometric analysis (represented as % ROI) obtained from 6 to 8 images from different microscopy fields from each mouse sample. Data are represented as mean ± SEM (*P < .05; n = 6). GW indicates Gulf War; ROS, reactive oxygen species; SEM, standard error of the mean; ROI, region of interest.
Figure 5.
Figure 5.
GW chemical exposure is associated with chronic neuroinflammation and decreased brain-derived neurotrophic factor (BDNF) levels in frontal cortex. (A, C, E) Immunohistochemistry micrographs of frontal cortex tissues of GWP and CONT treated mice showing immunoreactivity of IL-1β, IL-18, and IL-6 (magnification 20× and scale bar 50 µm). (B, D, F) Morphometric analysis (as % ROI) obtained from 10 to 15 images from different microscopic fields from each mouse sample. (*P < .05; n = 6). Data are represented as mean ± SEM. (G) Western blots of BDNF protein levels in the frontal cortex of GWP and CONT treated mice. (H) Morphometry analysis of immunoblots normalized against β-actin (n = 5) (*P < .05; n = 5). Data are represented as mean ± SEM. (I) BDNF immunoreactivity. Representative immunohistochemistry micrographs showing BDNF in frontal cortex tissues of GWP and CONT treated mice (magnification 40× and scale bar 50 µm). (J) Morphometric analysis (represented as % ROI) obtained from 10 to 15 images from different microscopy fields from each mouse sample (*P < .05; n = 6). Data are represented as mean ± SEM. BDNF indicates brain-derived neurotrophic factor; GW, Gulf War; SEM, standard error of the mean; ROI, region of interest.
Figure 6.
Figure 6.
The decreased relative abundance of A muciniphila correlates with IL-1β and BDNF levels in the frontal cortex. (A) Correlation between A muciniphila and IL-1β levels in GW chemical (GWP) and vehicle control (CONT) treated mice. We carried out a linear regression analysis to determine the relationship between IL-1β and A muciniphila in GWP and CONT mice. There was a negative correlation between A muciniphila and IL-1β in the FC (Pearson’s r = −0.68; R2 COD = 0.46 and P = .02). (B) Correlation between A muciniphila and BDNF levels in GW chemical (GWP) and vehicle control (CONT) treated mice. We carried out a linear regression analysis to determine the relationship between BDNF and A muciniphila in GWP and CONT mice. There was a positive correlation between A muciniphila relative abundance and BDNF levels (Pearson’s r = 0.83, R2 COD = 0.7 and P = .0024). BDNF indicates brain-derived neurotrophic factor; GW, Gulf War; COD, coefficient of dispersion.
Figure 7.
Figure 7.
Deletion of NLRP3 is associated with decreased neuroinflammation and lower BDNF levels. (A to D) IL-1β, IL-18, IL-6, and BDNF immunoreactivity in the frontal cortex. Representative immunohistochemistry micrographs showing IL-1β, IL-18, IL-6, and BDNF, respectively, in frontal cortex tissues of GW chemical treated (GWP), GW chemical treated NLRP3KO (GWP-NLR3KO), and vehicle control (CONT) treated mice (magnification 40× and scale bar 50 µm). (E to H) Morphometric analysis (represented as % ROI) obtained from 10 to 15 images from different microscopy fields from each mouse sample. Data are represented as mean ± SEM. (*P < .05, n = 6). (I) Western blots of BDNF protein levels in the frontal cortex of GWP and CONT treated mice. (J) Morphometry analysis of all immunoblots normalized against β-actin. Data are represented as mean ± SEM (*P = .05, n = 5). BDNF indicates brain-derived neurotrophic factor; GW, Gulf War; SEM, standard error of the mean.
Figure 8.
Figure 8.
Deletion of NLRP3 is associated with decreased serum cytokine levels. (A to C) Serum cytokine levels. IL-1β, TNF-α, and IL-6 levels, respectively, determined by ELISA in the serum of vehicle control (CONT), GW chemical treated (GWP) and GW chemical treated NLRP3KO mice (GWP-NLRP3KO). Data are represented as mean ± SEM (*P < .05, n = 6). GW indicates Gulf War; SEM, standard error of the mean.
Figure 9.
Figure 9.
Schematic illustration of the proposed mechanism for persistent neuroinflammatory pathology in current study.

References

    1. White RF, Steele L, O’Callaghan JP, et al. Recent research on Gulf War illness and other health problems in veterans of the 1991 Gulf war: effects of toxicant exposures during deployment. Cortex. 2016;74:449-475. - PMC - PubMed
    1. Rose MR, Brix KA. Neurological disorders in Gulf War veterans. Philos Trans R Soc Lond B Biol Sci. 2006;361:605-618. - PMC - PubMed
    1. Fukuda K, Nisenbaum R, Stewart G, et al. Chronic multisymptom illness affecting Air Force veterans of the Gulf War. JAMA. 1998;280:981-988. - PubMed
    1. Engdahl BE, James LM, Miller RD, et al. Brain function in Gulf War illness (GWI) and Associated Mental Health comorbidities. J Neurol Neuromedicine. 2018;3:24-34. - PMC - PubMed
    1. Jeffrey MG, Krengel M, Kibler JL, et al. Neuropsychological findings in Gulf War illness: a review. Front Psychol. 2019;10:2088. - PMC - PubMed