. 2020 Mar;1(3):345-358.
doi: 10.1038/s43018-020-0035-5. Epub 2020 Mar 20.

α-Ketoglutarate attenuates Wnt signaling and drives differentiation in colorectal cancer

Affiliations

α-Ketoglutarate attenuates Wnt signaling and drives differentiation in colorectal cancer

Thai Q Tran et al. Nat Cancer. 2020 Mar.

Abstract

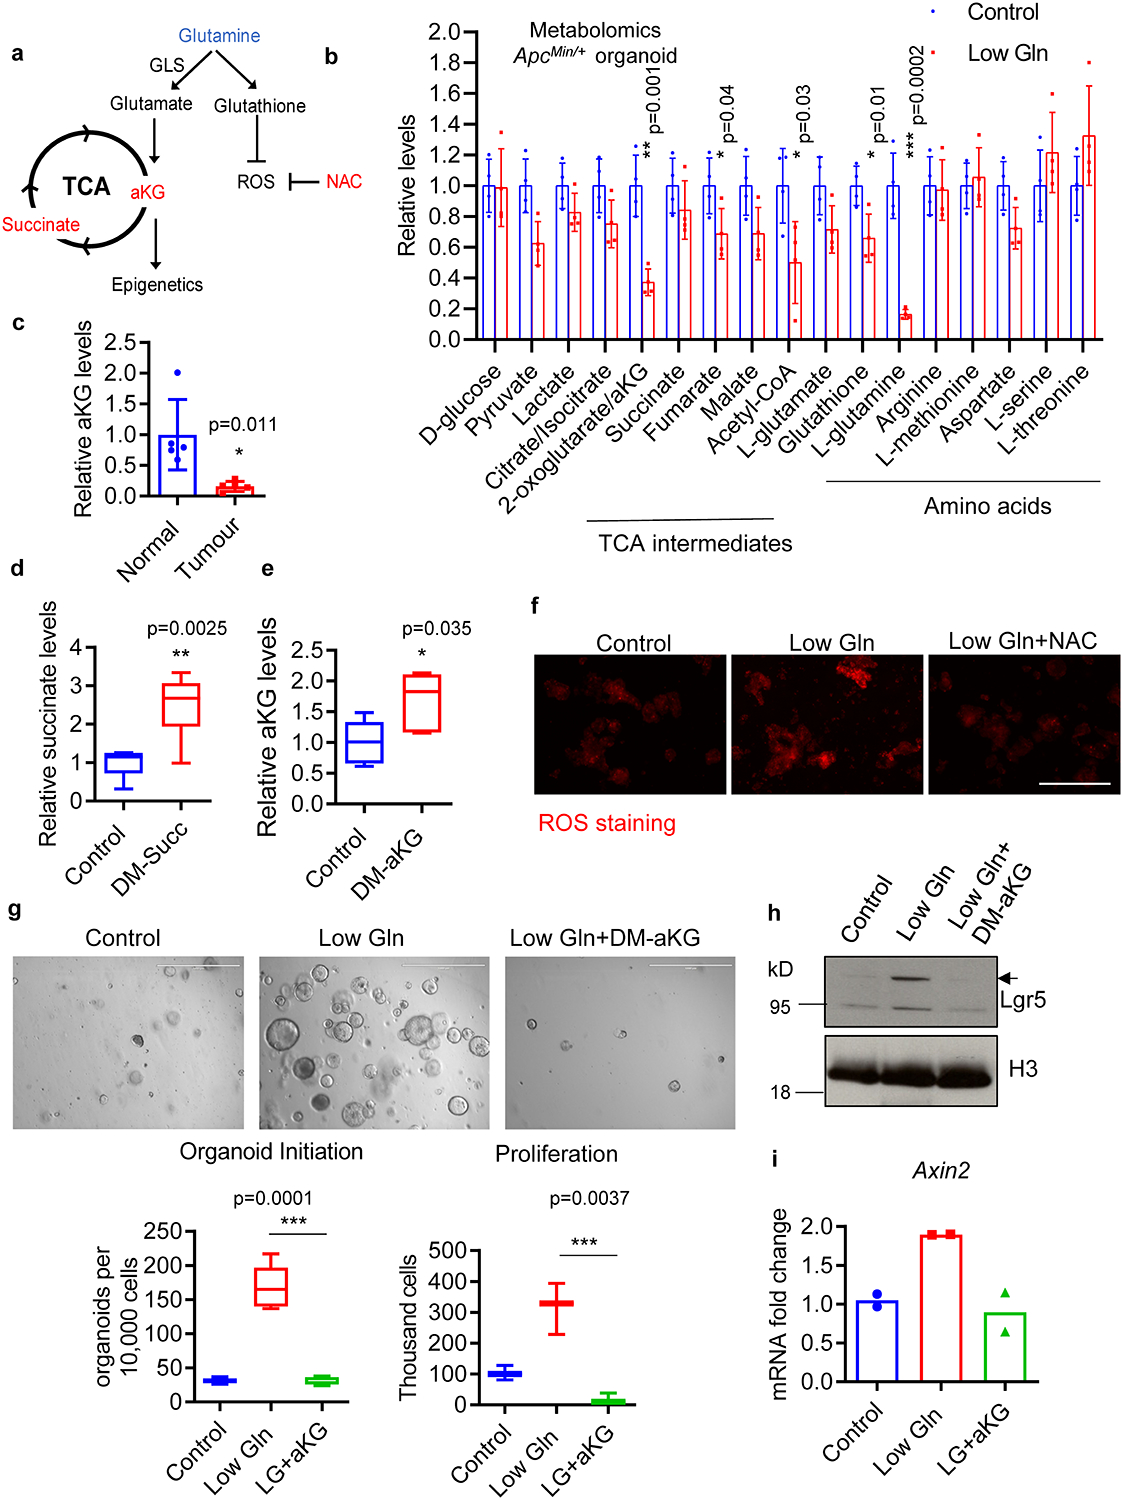
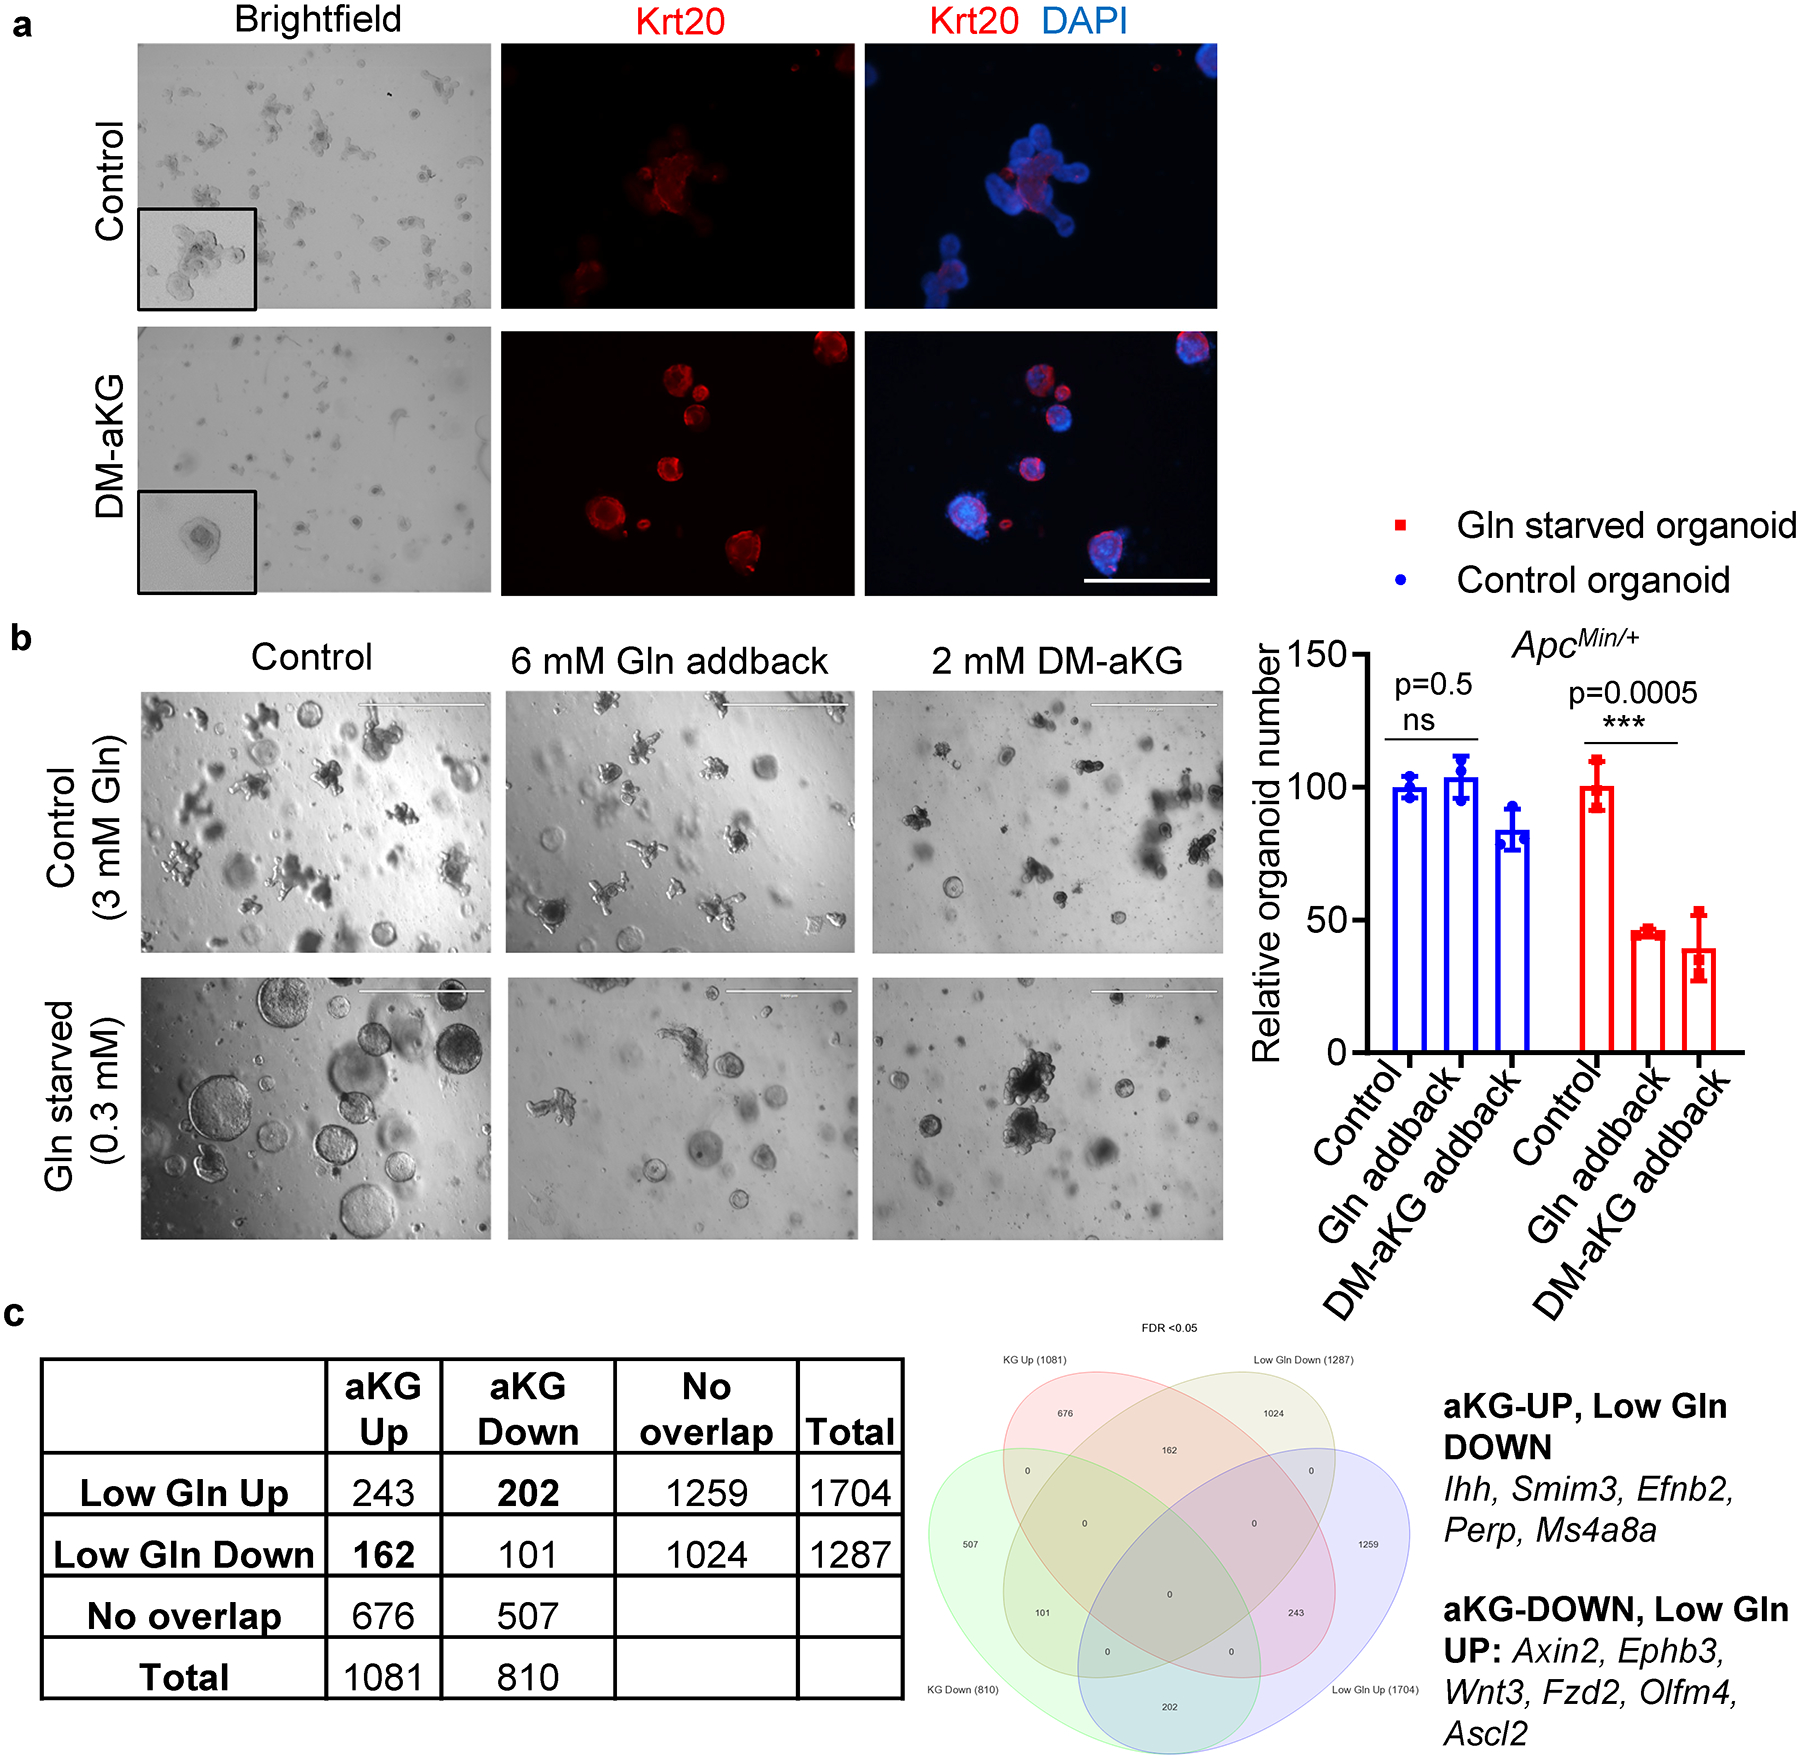
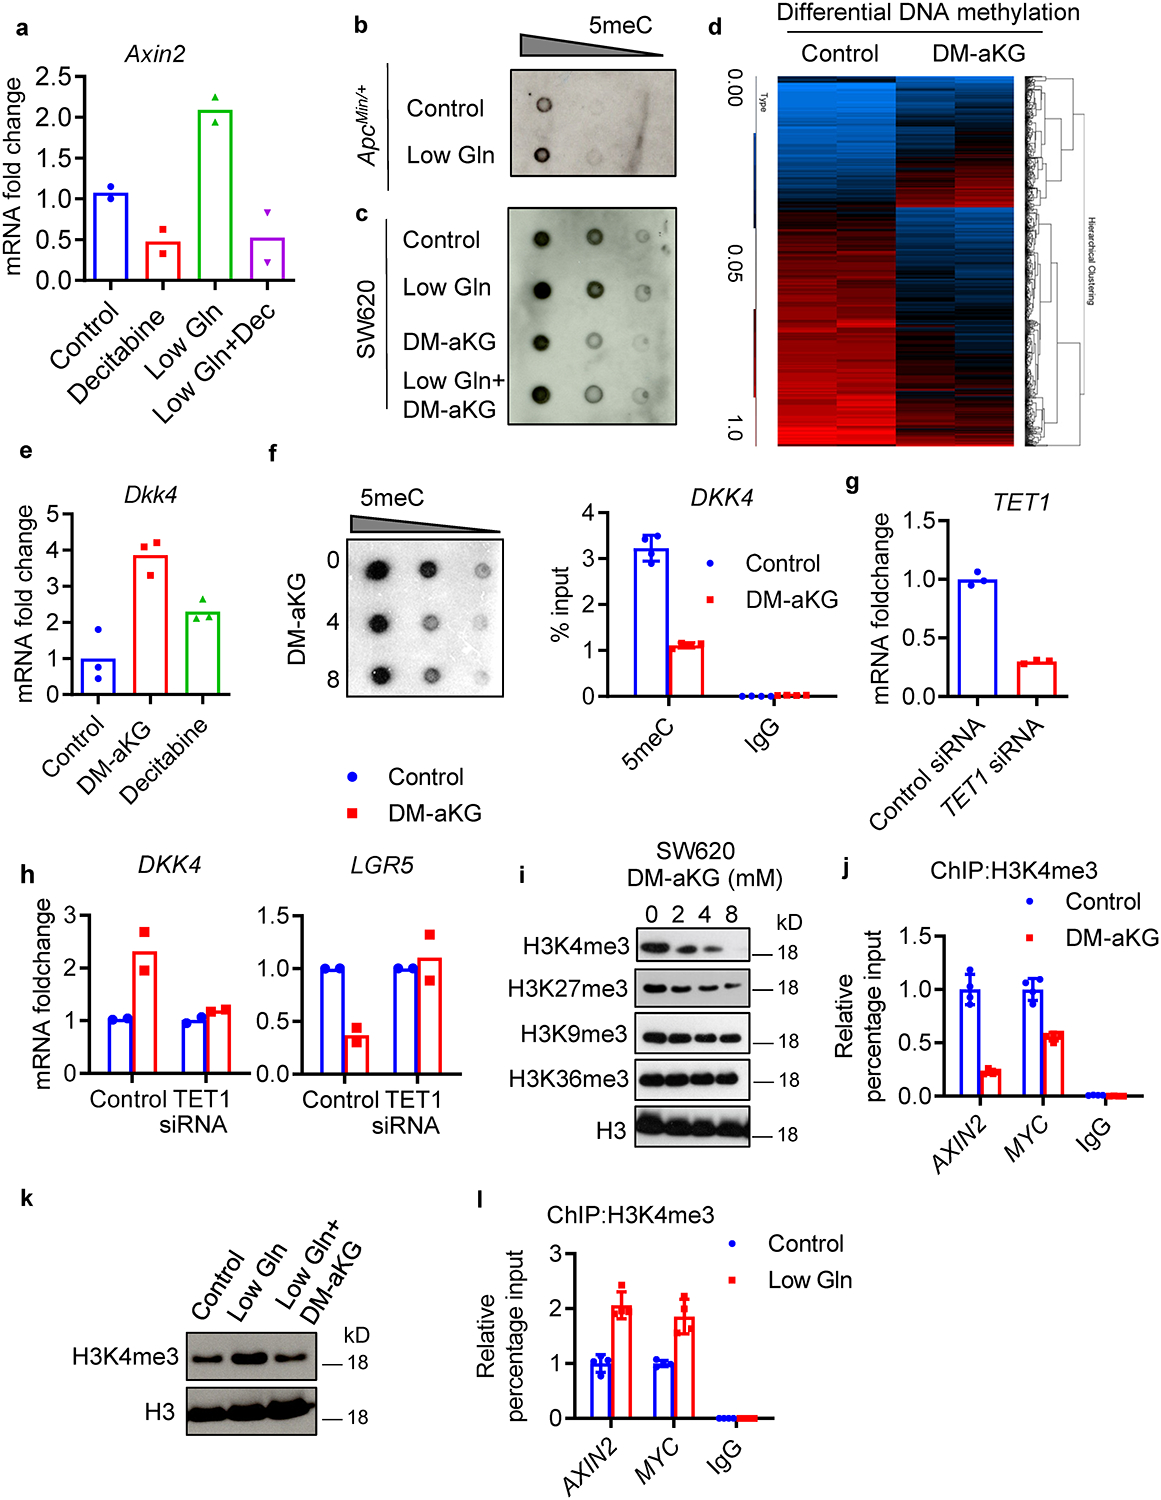
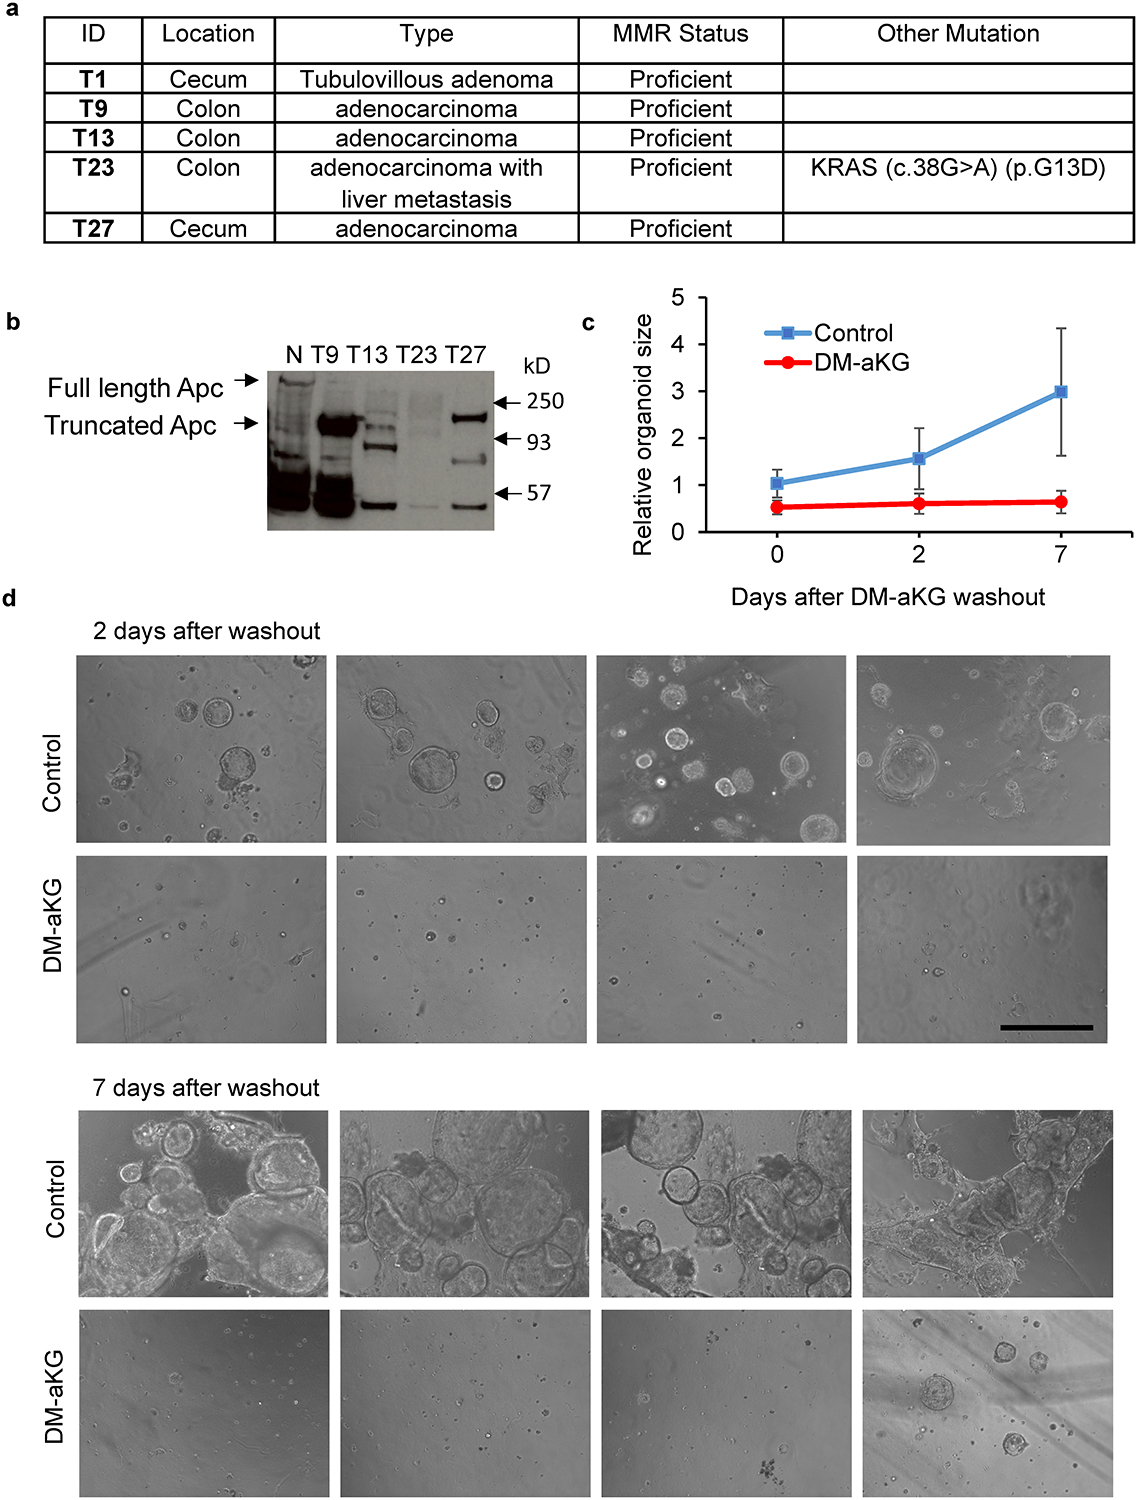
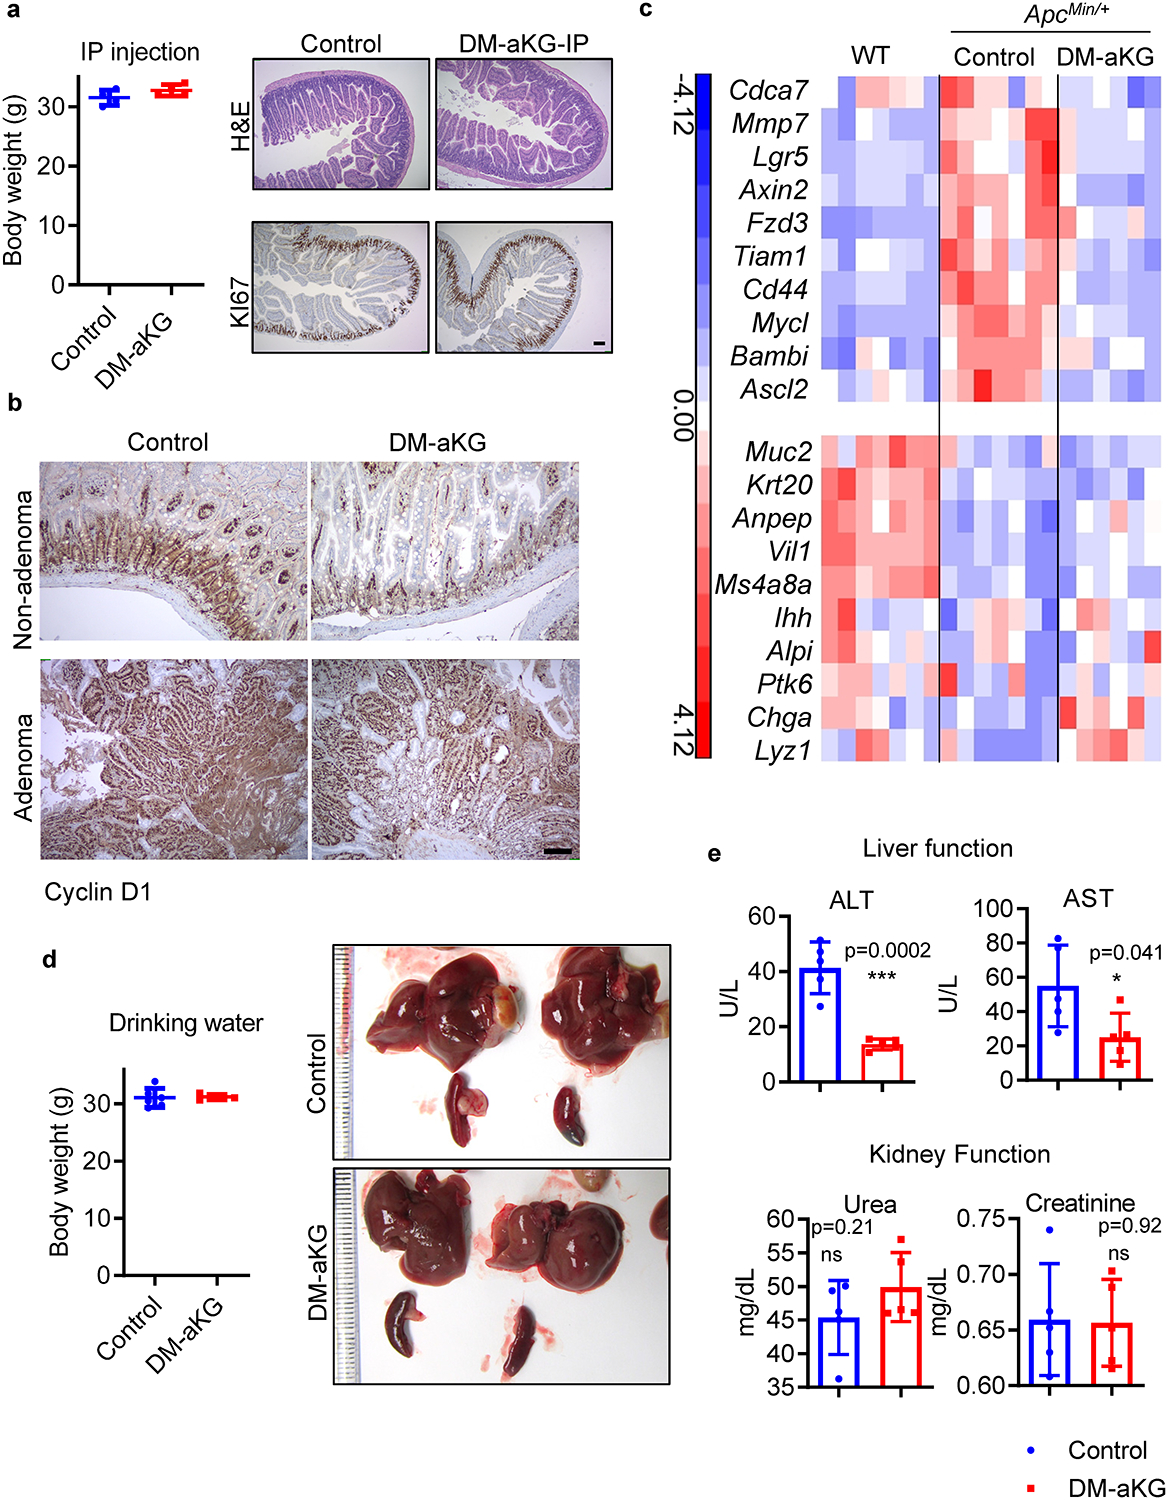
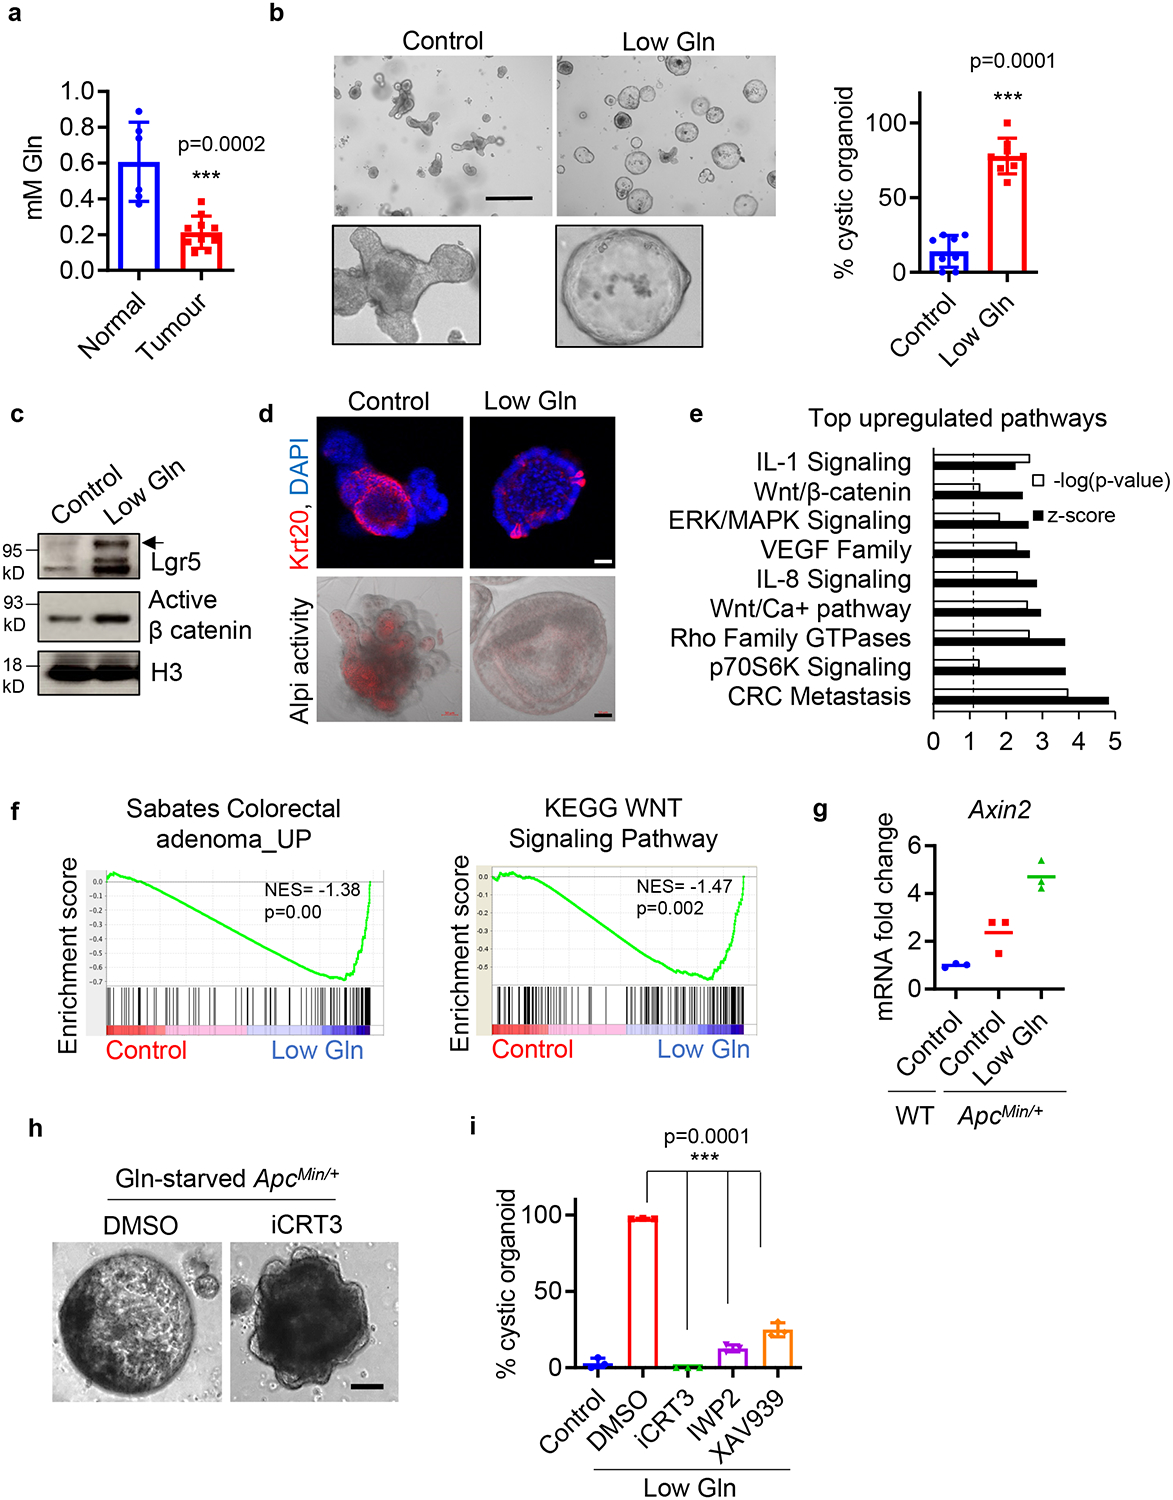
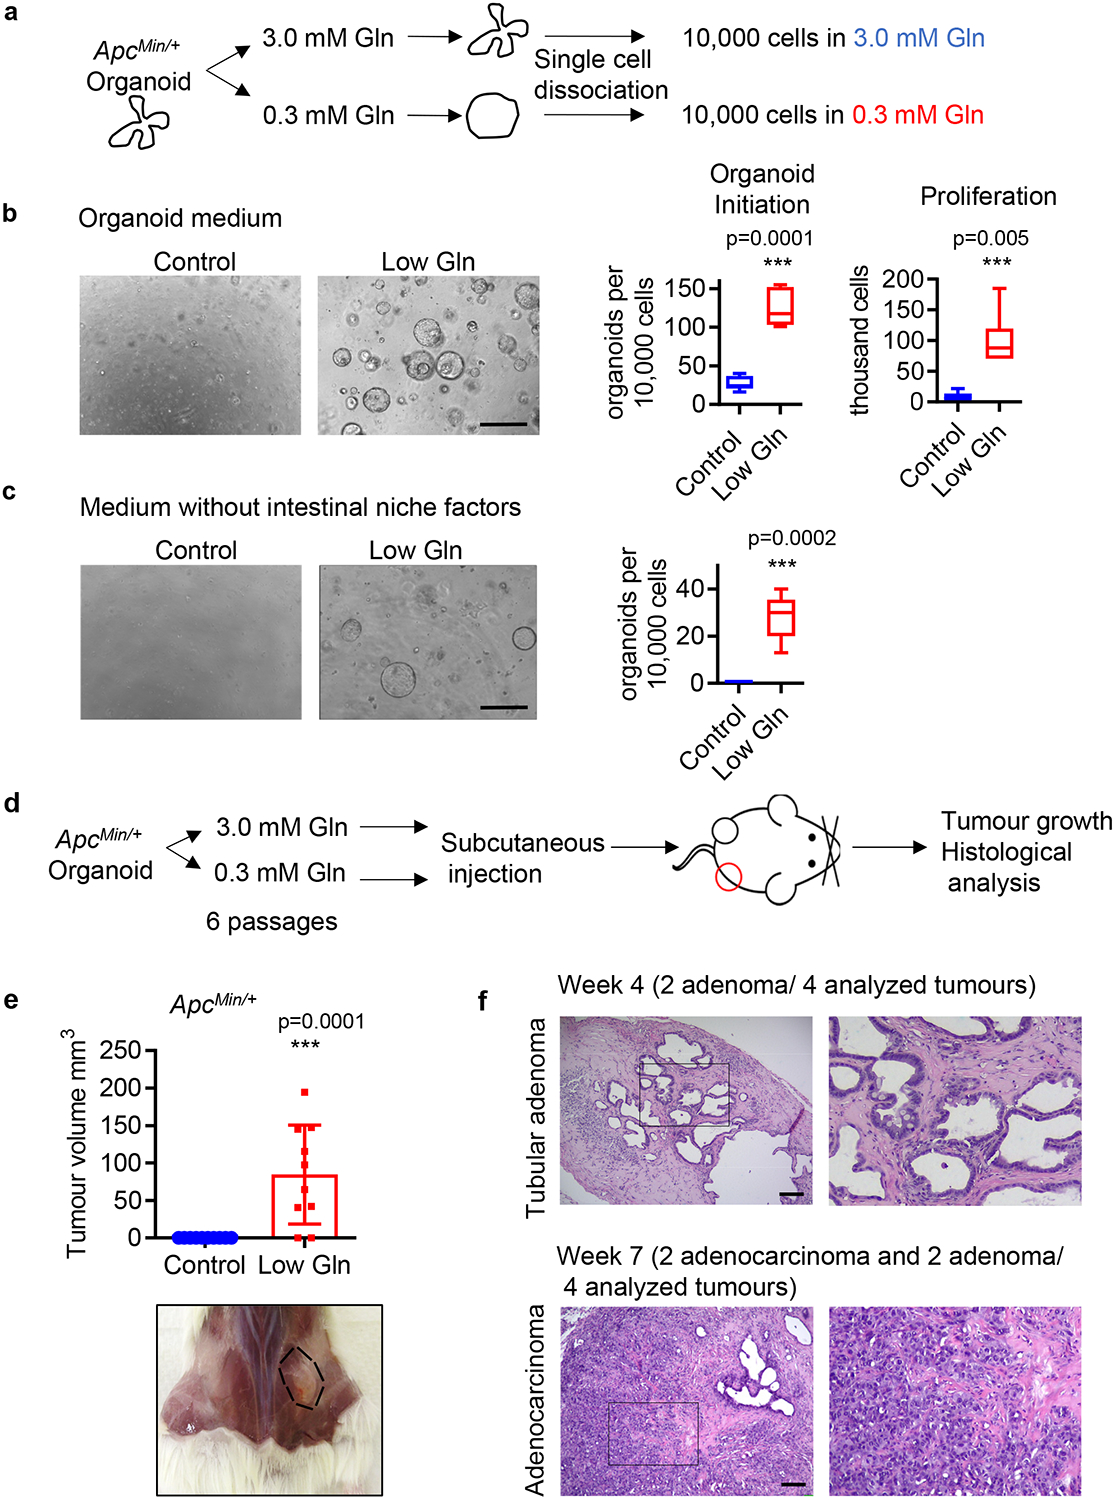
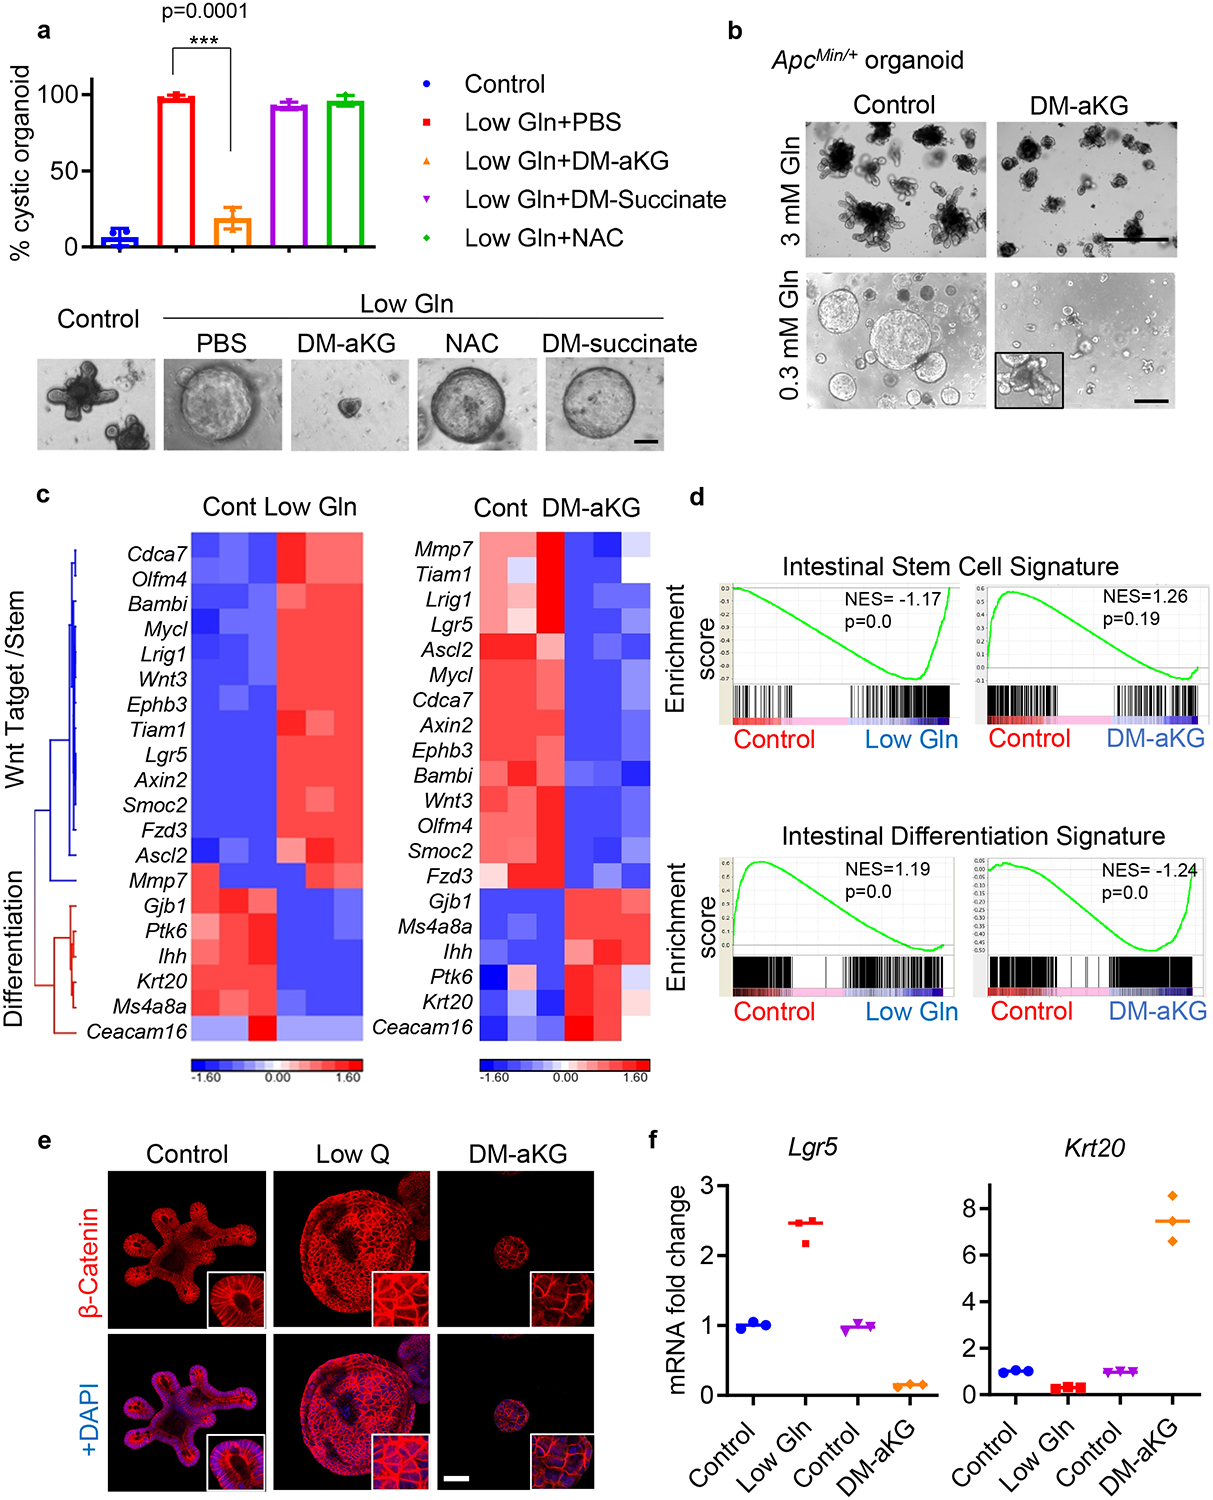
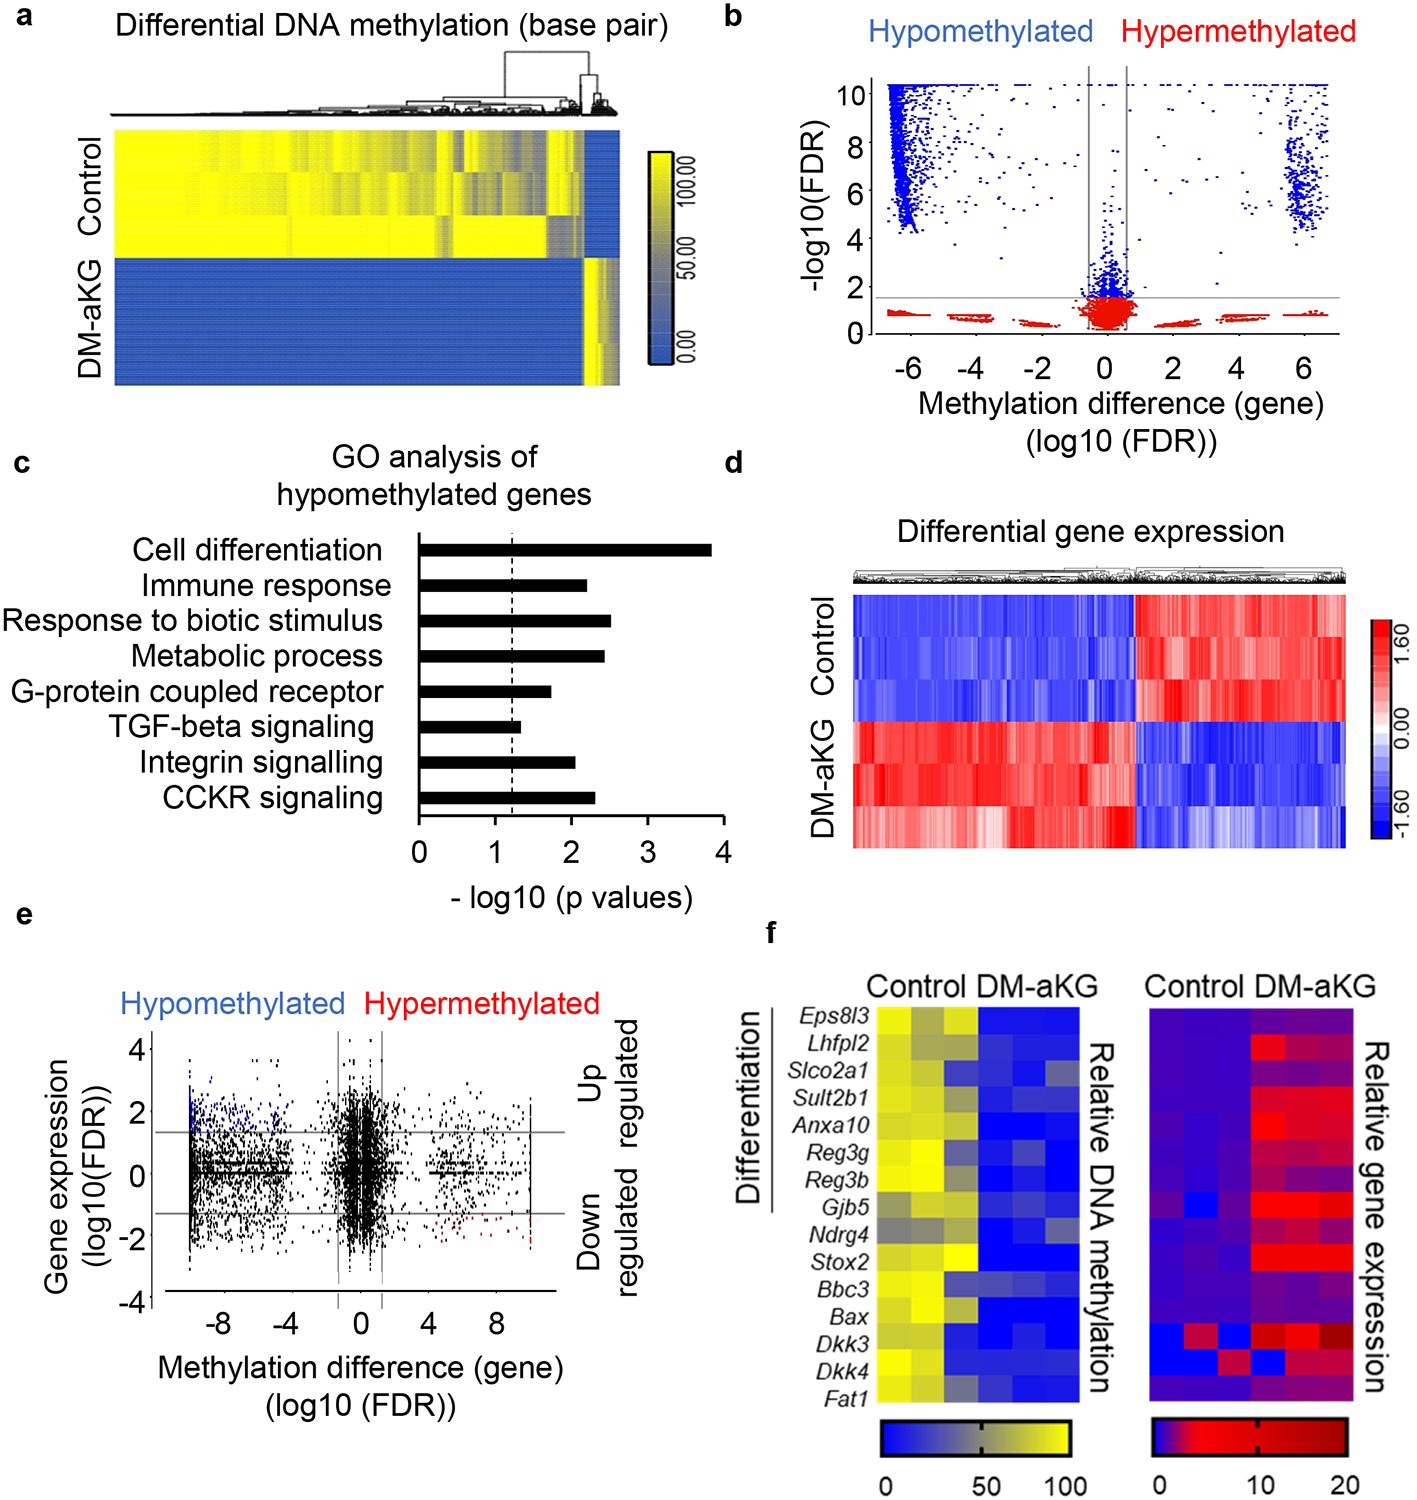
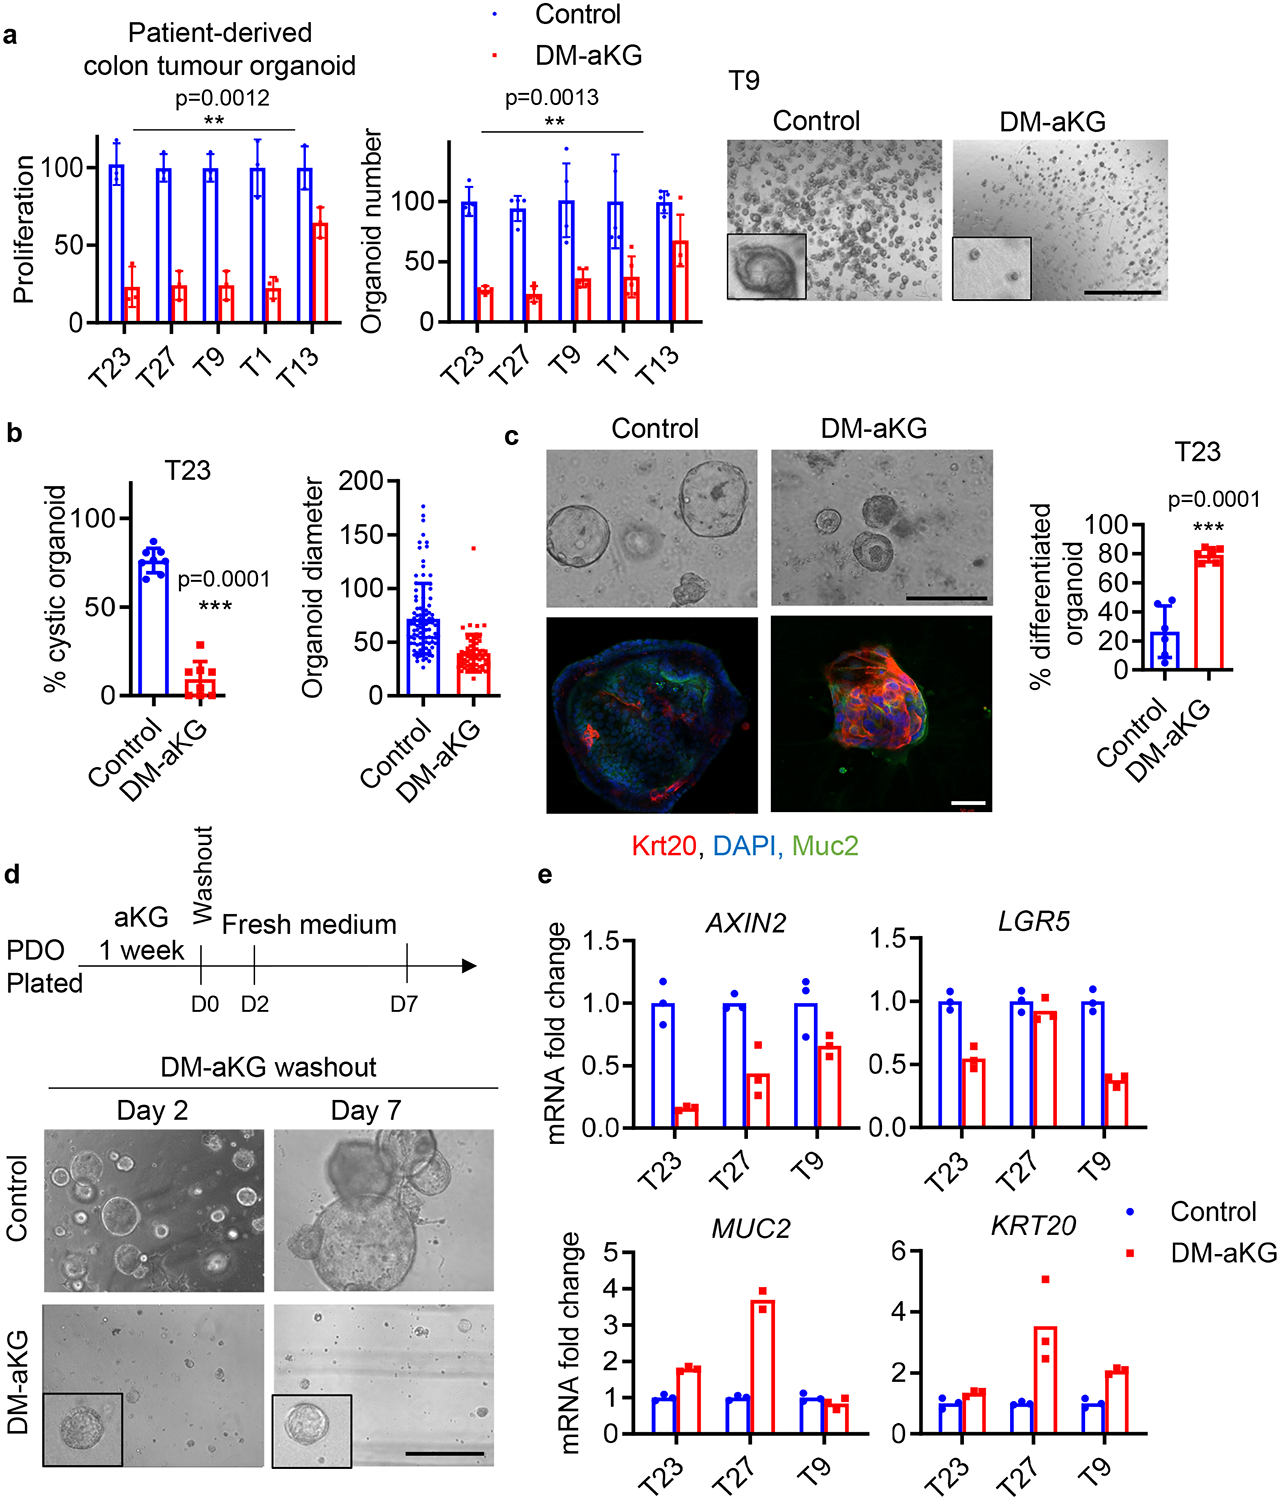
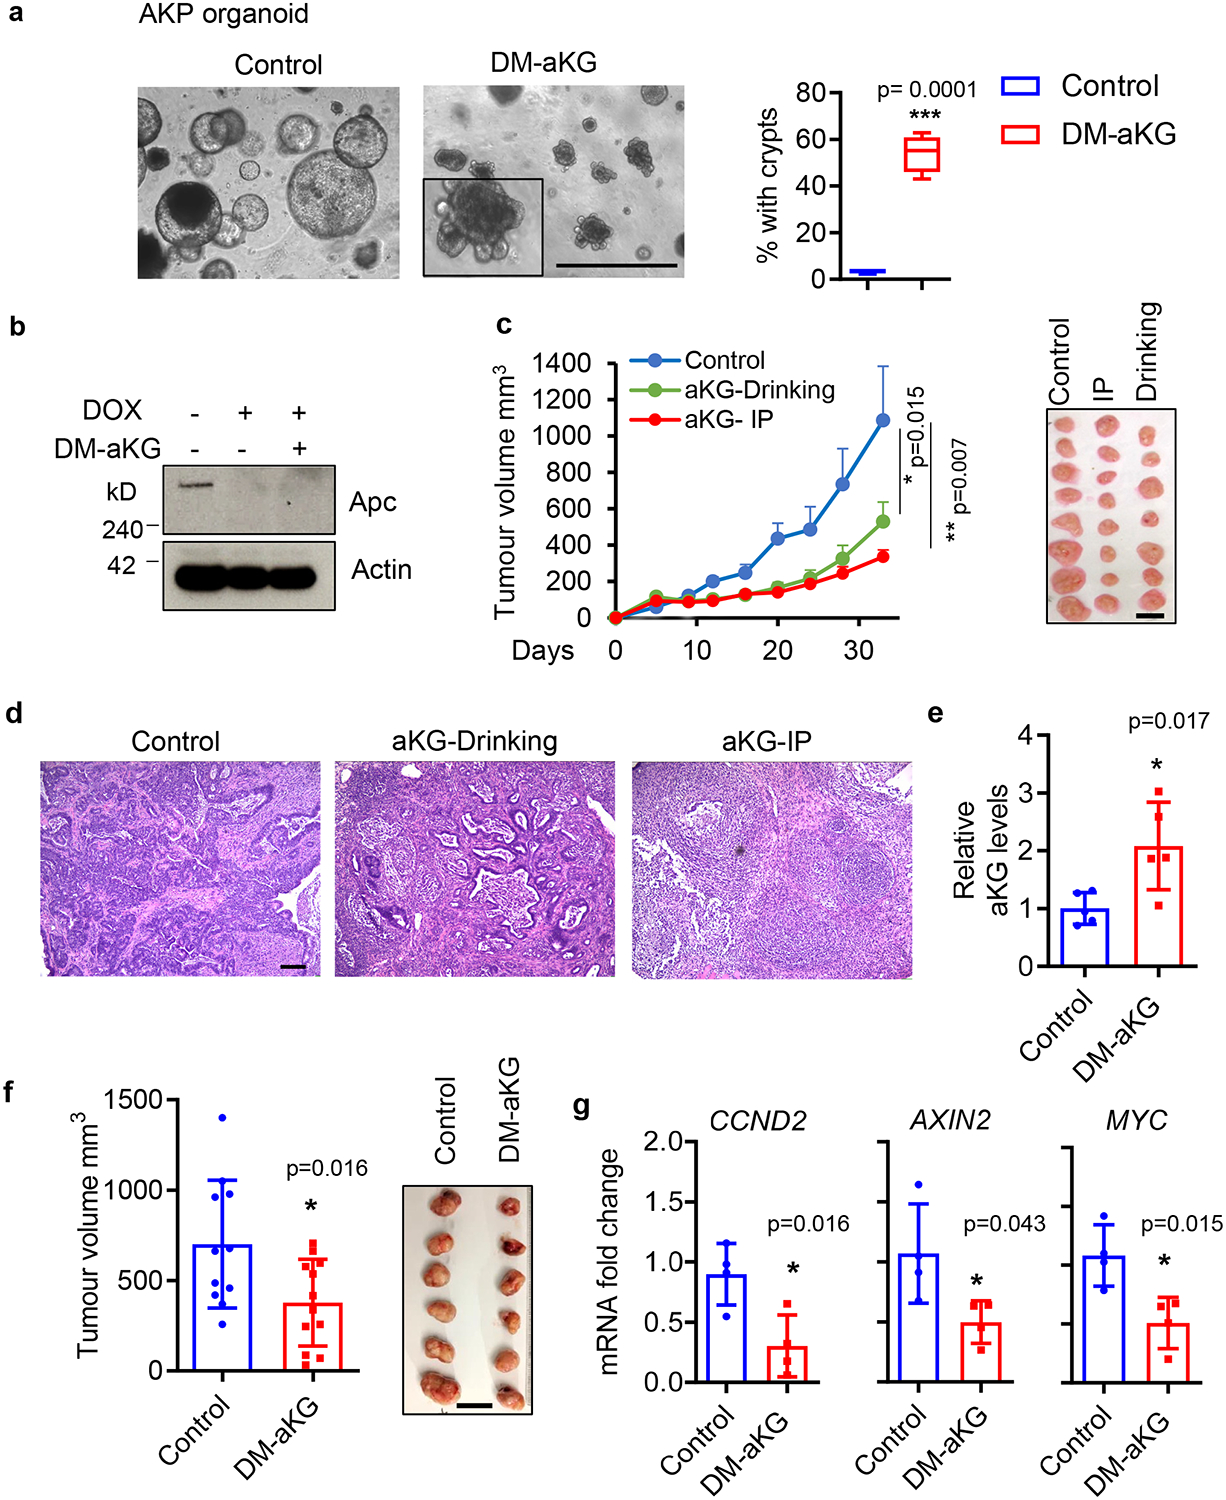
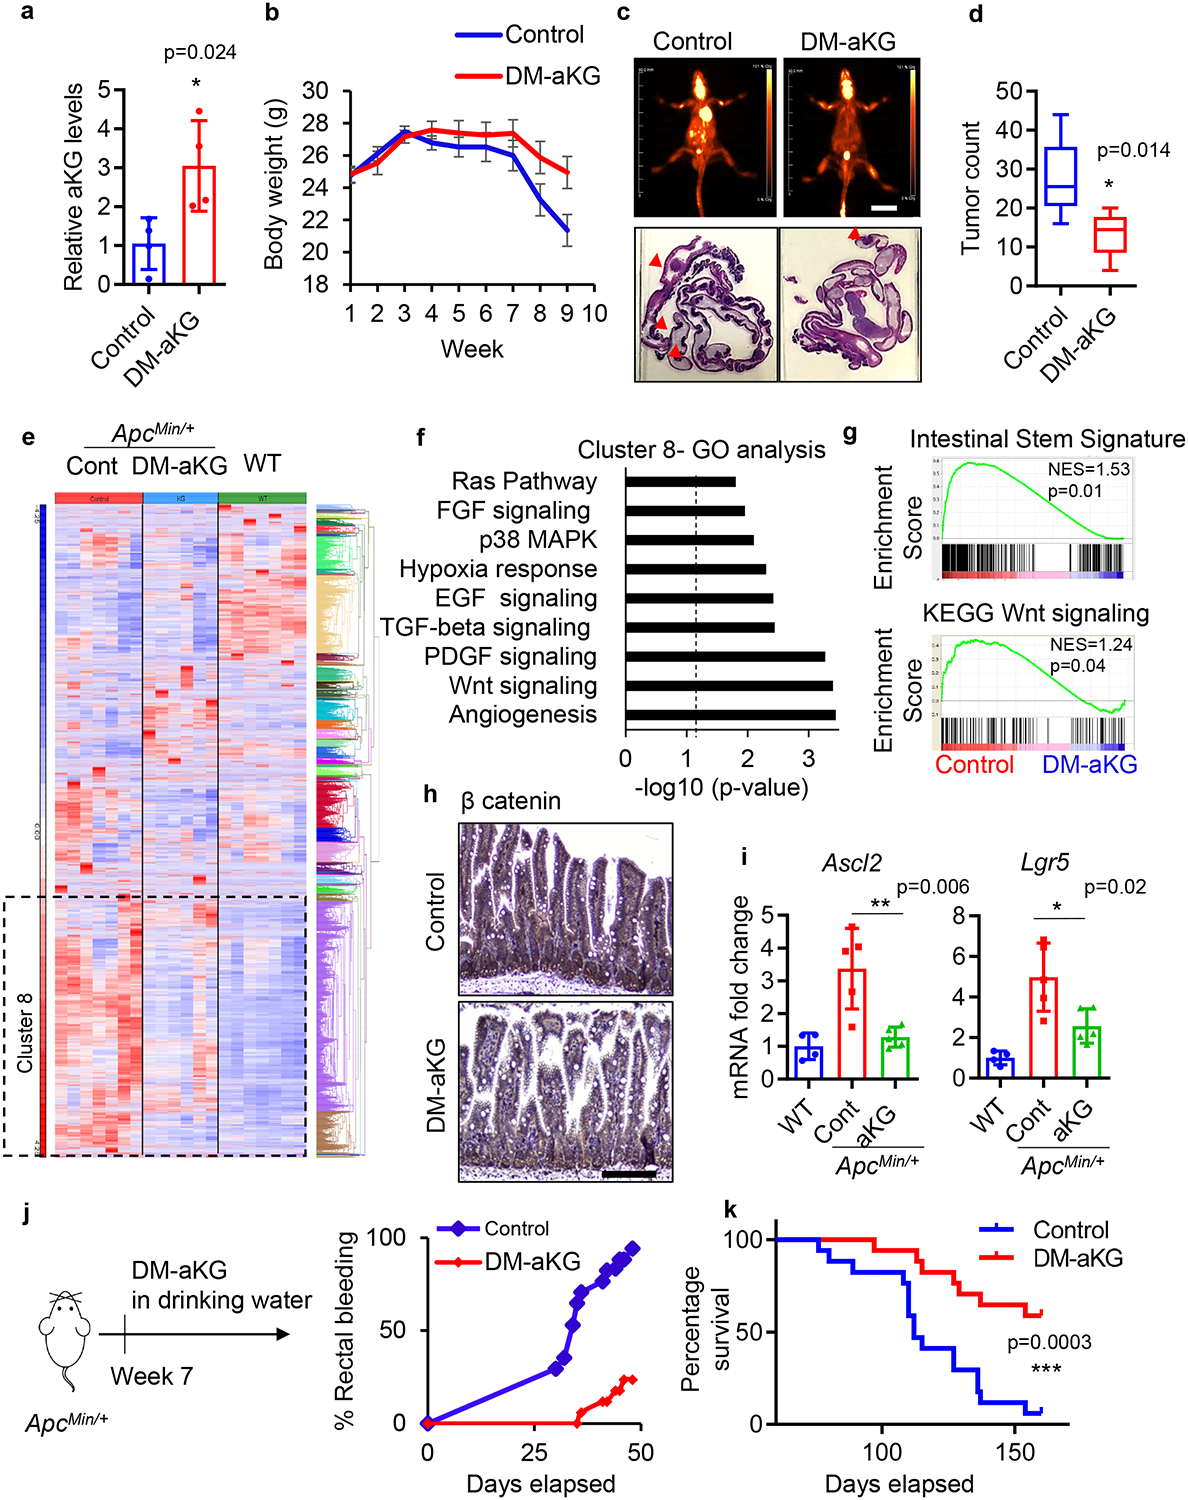
Genetic-driven deregulation of the Wnt pathway is crucial but not sufficient for colorectal cancer (CRC) tumourigenesis. Here, we show that environmental glutamine restriction further augments Wnt signaling in APC mutant intestinal organoids to promote stemness and leads to adenocarcinoma formation in vivo via decreasing intracellular alpha-ketoglutarate (aKG) levels. aKG supplementation is sufficient to rescue low-glutamine induced stemness and Wnt hyperactivation. Mechanistically, we found that aKG promotes hypomethylation of DNA and histone H3K4me3, leading to an upregulation of differentiation-associated genes and downregulation of Wnt target genes, respectively. Using CRC patient-derived organoids and several in vivo CRC tumour models, we show that aKG supplementation suppresses Wnt signaling and promotes cellular differentiation, thereby significantly restricting tumour growth and extending survival. Together, our results reveal how metabolic microenvironment impacts Wnt signaling and identify aKG as a potent antineoplastic metabolite for potential differentiation therapy for CRC patients.

Keywords: Wnt signaling; cancer metabolism; colon cancer; epigenetics; glutamine.


Conflict of interest statement

COMPETING INTERESTS The authors declare no competing interests.

Figures

Extended Data Fig. 1
Extended Data Fig. 1. The effect of glutamine starvation on ApcMin/+ and wildtype organoids.
(a) Relative glutamine uptake in ApcMin/+ organoids and wildtype organoids (n=3 biologically independent samples) and relative glutamine uptake in AKP organoids upon doxycycline addition (n=4 biologically independent samples). (b) Percentage of cystic organoid in ApcMin/+ organoids upon glutamine deprivation (0.2 mM and 0.4 mM) overtime (n=7 biologically independent cultures). (c) Percentage of cystic organoids and organoid number of ApcMin/+ organoids treated with CB-839 for 1 week (n=3 biologically independent cultures). (d) Percentage of wildtype organoids with cystic morphology after 4 passages in low glutamine conditon (n=6 biologically independent cultures). (e) qPCR analysis of Axin2 in wildtype organoids cultured in control or low glutamine medium for 1 week. Data from n=3 independent experiments with a line marking the mean value. (f, g) Control and glutamine-starved wildtype organoids were dissociated into single cells, and equal number of organoid-derived cells were cultured in organoid medium with 3 mM or 0.3 mM glutamine (low gln). Secondary organoid formation and percentage of cystic organoids are shown (n=9 biologically independent cultures). Data in a-e, g represent means +/− SD, p values were determined by two-tailed unpaired Student’s t-test. Scale bars, 1000 μm (c, d, f). Source data are provided for a-e, g.
Extended Data Fig. 2
Extended Data Fig. 2. Genetic alterations do not contribute to low-glutamine induced stemness.
(a) Identified genetic alterations in glutamine-starved ApcMin/+ organoids compared to paired control organoids as determined by exome sequencing. (b) Brightfield images of control and glutamine-starved ApcMin/+organoids after 12 passages. Results are representative of three biologically independent cultures. (c) Immunoblotting for full length and truncated Apc protein in control and glutamine starved ApcMin/+ organoids after 8 passages. Results are representative of three independent experiments. (d) Representative images and percentage of cells with full-length Apc protein based on immunofluorescent staining with C-terminus Apc antibody in wildtype organoids, tumour organoids derived from adenomas derived in ApcMin/+ mice, and ApcMin/+organoids from healthy tissues in control medium and upon glutamine deprivation (n=4 biologically independent cultures), data represent means +/− SD. (e, f) Representative images and percentage of shApc /KrasG12D/p53fl/fl (AKP) organoid with crypts cultured in control or low glutamine medium for 10 days (n=5 biologically independent cultures). (g) qPCR analysis of Krt20 and Lgr5 in a similar experiment described in e after 3 days of glutamine deprivation. Data from n=2 independent experiments with a line marking the mean value. (h) Hierarchical clustering of significant differentiated gene expression of ApcMin/+ organoids cultured in control or low-glutamine medium (n=3 biologically independent samples). (i) qPCR analysis of the indicated genes in SW620 colon cancer cells (n=3 technical replicates and data represent means) cultured in medium with the indicated glutamine concentration for 3 days. A single experiment is shown that is representative of two independent experiments with similar results. Scale bars, 200 μm (b), 400 μm (d, e). Unprocessed blot images for c and source data for d, f, g, i are provided.
Extended Data Fig. 3
Extended Data Fig. 3. The role of aKG in low-glutamine induced stemness.
(a) Schematic diagram of glutamine metabolism. (b) Relative metabolite levels as measured by LC-MS in ApcMin/+ organoids cultured in control and low glutamine medium (n=4 biologically independent samples). (c) Relative aKG levels in intestinal tumours from ApcMin/+ mice and normal intestinal tissues of wildtype mice (n=5 mice per group). Data in b, c represent means +/− SD, and p values were determined by two-tailed unpaired Student’s t-test. (d, e) Relative intracellular aKG and succinate levels in ApcMin/+ organoids upon DM-aKG (n=5 biologically independent samples) or DM-succinate supplementation (n=6 biologically independent samples). (f) Immunofluorescent staining for ROS in ApcMin/+ organoids under low glutamine or low glutamine medium supplemented with NAC. Results are representative from three biologically independent samples. (g) Control organoids, glutamine-starved organoids treated with or without 3.5 mM DM-aKG were dissociated into single cells. An equal number of organoid-derived cells were cultured, and secondary organoid formation (n=6 biologically independent cultures) and cell proliferation (n=3 biologically independent cultures) were measured after 1 week and are shown. p values were determined by two-tailed unpaired Student’s t-test. (h) Immunoblotting for Lgr5 and (i) qPCR analysis for Axin2 expression in ApcMin/+ organoid cultured in control and low glutamine medium with or without DM-aKG (n= 2 independent experiments with a line marking the mean value). Box plots in d, e, g show the maximum, third quartile, median, first quartile and minimum values, and the p values were determined by two-tailed unpaired Student’s t-test. Scale bar, 400 μm (f), 1000 μm (g). Unprocessed blot images for h and source data for b-e and g, i are provided.
Extended Data Fig. 4
Extended Data Fig. 4. The effect of aKG and glutamine supplementation on intestinal differentiation.
(a) Representative brightfield images and immunofluorescent staining of the differentiation marker Krt20 in ApcMin/+ organoids treated with 3 mM DM-aKG for 3 days. Results are representative of three independent experiments. (b) Representative images and relative organoid number of control ApcMin/+ organoid or glutamine-starved ApcMin/+ organoids upon 2 mM DM-aKG treatment or 6mM glutamine addition for 1 week (n=3 biologically independent cultures). Data represent means +/− SD, and the p values were determined by two-tailed unpaired Student’s t-test. (c) Overlapping gene expression profile of ApcMin/+ organoids cultured in low glutamine medium or treated with aKG reveals opposing regulation on Wnt target genes and intestinal differentiation related genes. Scale bars, 1000 μm (Brightfield), 200 μm (Immunofluorescence). Source data are provided for b.
Extended Data Fig. 5
Extended Data Fig. 5. aKG promotes hypomethylation of histone and DNA in CRC cells.
(a) qPCR analysis of Axin2 in control and glutamine-starved organoids treated with 1 μM decitabine for 3 days. Data from n=2 independent experiments with a line marking the mean value. (b, c) Dot blot analysis of 5meC levels in ApcMin/+ organoids in control and low glutamine medium and SW620 cells in control, low glutamine medium or low glutamine medium supplemented with 8mM DM-aKG. Results are representative from two independent experiments. (d) Heatmap of the differential methylated regions (different methylated ratio >+/−20%) in SW620 cells upon 8 mM DM-aKG treatment for 3 days. Beta value of the methylation ratio are shown (top) (n= 2 biologically independent samples). (e) qPCR analysis of Dkk4 in ApcMin/+ organoids treated with 3.5 mM DM-aKG or 1 μM decitabine (n=3 technical replicates). A repeat experiment showed similar results. (f) Dot blot analysis of 5meC levels in SW620 cells treated with DM-aKG (left), MeDIP experiment with 5meC antibody for DKK4 promoter in SW620 cells upon 8 mM DM-aKG treatment (right). Data show means ± SD of n=4 technical replicates. Results are representative of two independent experiments. (g) qPCR analysis of TET1 expression in SW620 cells transfected with control siRNA or TET1 siRNA (data show means of n=3 technical replicates). (h) qPCR analysis of DKK4 and LGR5 expression in control SW620 cells or TET1 siRNA knockdown cells following DM-aKG treatment. Data from n=2 independent experiments with a line marking the mean value. (i) Representative immunoblot of histone methylation in SW620 cells treated with DM-aKG from two independent experiments. (j) ChIP analysis of H3K4 levels on promoter regions of AXIN2 and MYC in SW620 cells in response to 8mM DM-aKG treatment for 3 days (n=4 technical replicates). (k) Representative immunoblot of H3K4me3 in SW620 cells in control, low-glutamine medium or low glutamine medium supplemented with 8 mM DM-aKG from two independent experiments. (l) ChIP analysis of H3K4me3 levels on promoter regions of AXIN2 and MYC in SW620 cells in response to glutamine starvation after 1 week (n=4 technical replicates). Results in j and l represent means ± SD and are representative of two independent experiments. Unprocessed blot images are provided for b, c, f, i and k. Source data are provided for a, e-h, j, and l.
Extended Data Fig. 6
Extended Data Fig. 6. DM-aKG treatment inhibits initiation and growth of PDOs.
(a) Clinical information on PDOs used in the study. (b) Immunoblot probed for Apc protein in different PDOs. (c) Relative organoid size (n=50 organoids) and (d) representative images of four biologically independent cultures of T23 PDO treated with 6 mM DM-aKG for 7 days, followed by metabolite wash-out and subsequent culture for 7 days. Data in c represent means ± SD. Scale bar, 400 μm (d). Unprocessed blot images for b and source data for c is provided.
Extended Data Fig. 7
Extended Data Fig. 7. The effect of DM-aKG treatment in mice.
(a) Body weight and histological analysis of wildtype mice treated with 400 mg/kg DM-aKG via IP injection for more than 2 months (n=4 mice per group). (b) Representative IHC staining for Cyclin D1 in intestinal tissues collected from ApcMin/+ mice treated with DM-aKG from three mice per group. (c) Gene expression analysis from RNA sequencing performed on the intestinal tissues of wildtype mice (n=7 mice), ApcMin/+ mice (n=7 mice), and ApcMin/+ mice treated with DM-aKG (n=6 mice). (d) Body weight changes and images of liver and spleen from ApcMin/+ mice treated with DM-aKG (n=5 mice per group). (e) Liver and kidney function of wildtype mice treated with 15 mg/ml DM-aKG supplemented in drinking water for more than 4 months (n=5 mice per group). Data shown in a, d, e are means +/− SD. The p values in e were determined by two-tailed unpaired Student’s t-test. Source data are provided for a, d, e.
Figure 1.
Figure 1.. Environmental glutamine restriction hyperactivates Wnt signaling and blocks cellular differentiation.
(a) Glutamine levels in intestinal tumours from ApcMin/+ mice (n=10 mice) and normal intestinal tissues of wildtype mice (n=6 mice). Data represent means ± SD, p value was determined by two-tailed unpaired Student’s t-test. (b) Representative brightfield images and percentage of cystic morphology in ApcMin/+ small intestine organoids cultured in control (3mM) or low glutamine (0.3 mM) medium after 4–6 passages (n=8 biologically independent cell cultures). Data represent means ± SD, p value was determined by two-tailed unpaired Student’s t-test. (c) Immunoblots for stem cell marker Lgr5 and active β catenin, the results are representative of two independent experiments. (d) Immunofluorescent images for intestinal differentiation markers Krt20 and Alpi enzyme activity in ApcMin/+ organoids cultured in control (3mM) or low glutamine (0.3 mM) medium. The results are representative of three biologically independent samples. (e) IPA analysis of top upregulated pathways and (f) GSEA analysis between control organoids versus glutamine-starved (1 week) organoids from RNA sequencing (n=3 biologically independent samples). Dotted line in e indicates threshold of significance (p = 0.05) and p values were determined by a Right-Tailed Fisher’s Exact Test. (g) qPCR analysis of Axin2 in wildtype organoids and ApcMin/+ organoids cultured in control and low glutamine (0.3 mM) medium. n= 3 technical replicates with a line marking the mean value. The experiment was repeated twice independently with similar results. (h) Representative brightfield images of glutamine-starved organoids treated with 5 μM iCRT3 for 1 week from three biologically independent samples. (i) Percentage of cystic organoids of control and glutamine-starved organoids treated with 10 μM of indicated Wnt inhibitors for 4 days (n=3 biologically independent samples). Data represent means ± SD and p values were determined by two-tailed unpaired Student’s t-test. Scale bars, 400 μm (b), 50 μm (d), 100 μm (h). Unprocessed gels for c and source data for a, b, g, i are available.
Figure 2.
Figure 2.. Glutamine restriction promotes self-renewal and niche independence in ApcMin/+ organoids.
(a) Schematic of experimental design of organoid initiation assay from single cells. (b) Representative brightfield images of secondary organoid formation and cell proliferation after 1 week are shown (n= 8 biologically independent cultures for organoid initiation; n= 6 biologically independent cultures for proliferation). (c) Representative brightfield images of secondary organoid formation after 1 week in medium without R-Spondin, Egf and Noggin are shown (n= 5 biologically independent cultures). Box plots in b, c show the maximum, third quartile, median, first quartile and minimum values, and the p values were determined by two-tailed unpaired Student’s t-test. (d) Schematic of experimental procedure to establish subcutaneous xenograft tumours with ApcMin/+ organoids. (e) Tumour volume of subcutaneous xenografts generated with control organoids or glutamine-starved organoids harvested 2 weeks after injection (n=10 mice). Data represent means ± SD, p value was determined by two-tailed unpaired Student’s t-test. (f) Representative H&E staining of n= 4 tumours generated from glutamine-starved organoids. Scale bars, 400 μm (b, c), 40 μm (f). Source data are available for b, c, e.
Figure 3.
Figure 3.. aKG supplementation rescues low-glutamine induced stemness and suppresses Wnt signaling.
(a) Percentage of cystic organoid morphology and representative brightfield images of control organoids and glutamine-starved ApcMin/+ organoids supplemented with PBS control, 3 mM DM-αKG, 3 mM DM-succinate, or 5 mM NAC for 3 days (n=3 biologically independent cell cultures). Data represent means ± SD, p value was determined by two-tailed unpaired Student’s t-test. (b) Brightfield images of control organoids and glutamine-starved ApcMin/+ organoids treated with 3.5 mM DM-aKG for 3 days. Results are representative of 3 biologically independent samples. (c) Heat map of gene expression profile from RNA sequencing data and (d) GSEA analysis of ApcMin/+ organoids cultured in control (3 mM glutamine), low glutamine (0.3 mM glutamine) or with 3.5 mM DM-aKG medium (n=3 biologically independent RNA samples). The nominal p values in d are the statistical significance of the enrichment score analyzed by GSEA. (e) Representative immunofluorescence for active β-catenin from 3 biologically independent samples. (f) qPCR analysis for Lgr5 and Krt20 expression in ApcMin/+ organoids cultured in low glutamine medium or treated with 3.5 mM DM-aKG. n=3 technical replicates with a line marking the mean value. The experiment was repeated three times independently with similar results. Scale bars, 100 μm (a), 400 μm (b), 50 μm (e). Source data are available for a, f.
Figure 4.
Figure 4.. aKG supplementation leads to DNA hypomethylation of genes related to differentiation and Wnt inhibition.
(a) Heatmap showing base pairs with differential DNA methylation based on RRBS sequencing (n=3 biologically independent samples). (b) Volcano plot showing genes with affected DNA methylation between the control and DM-aKG (3.5mM) treated ApcMin/+ organoids, DNA methylation difference is plotted on the x-axis and p values are plotted on the y-axis (n=3 biologically independent samples). Different methylation pattern between samples are detected using ANOVA with FDR adjusted p-value <0.05 and +/−1.5-fold change on methylation percentage. The average of methylation difference of significant (FDR adjusted p-value) differential methylation sites was calculated. (c) Panther gene ontology analysis of hypomethylated genes in DM-aKG treated organoids (n=3 biologically independent samples). Dotted line indicates threshold of significance (p = 0.05) and p values were calculated by GO enrichment analysis software. (d) Hierarchical clustering of differential gene expression in control and DM-aKG treated ApcMin/+ organoids (n=3 biologically independent samples). (e) Starburst plot for comparison between DNA methylation and gene expression. The black line represents the cutoff of FDR adjusted p values < 0.05. Blue dots represent genes with DNA hypomethylation and upregulated expression, red dots represent genes with DNA hypermethylation and downregulated expression between control and DM-aKG treated ApcMin/+ organoids (n=3 biologically independent samples). Different methylation pattern between samples are detected using ANOVA with FDR adjusted p-value <0.05. (f) Heatmap showing selected genes with decreased DNA methylation at upstream regions and upregulated expression in ApcMin/+ organoids upon DM-aKG treatment (n=3 biologically independent samples).
Figure 5.
Figure 5.. aKG supplementation drives terminal differentiation and suppresses growth of patient-derived colon tumour organoids.
(a) Titer-Glo proliferation assay and relative organoid number of a panel of PDOs treated with 6 mM DM-aKG for 7 days (n=3 biologically independent samples). Representative brightfield images of T9 PDOs after DM-aKG treatment are shown. Data represent means ± SD, p values were determined by two-tailed paired Student’s t-test between control and treated group. (b) Percentage of cystic organoids (n= 8 biologically independent cultures) and relative organoid size of T23 PDOs (n=95 organoids in control group; n=62 organoids in DM-aKG treated group) treated with DM-aKG as determined by ImageJ. Data represent means ± SD, p values were determined by two-tailed unpaired Student’s t-test. (c) Brightfield images and immunofluorescent staining for the indicated differentiation markers of T23 PDOs following 6 mM DM-aKG treatment for 7 days, and the percentage of differentiated organoids as determined by Krt20 staining was shown (n=6 biologically independent cultures). Data represent means ± SD, p values was determined by two-tailed unpaired Student’s t-test. (d) Representative images of T23 PDOs treated with DM-aKG followed by wash-out. Results are representative of three independent cell cultures. (e) qPCR analysis of the indicated genes in different PDOs treated with 6mM DM-aKG for 7 days, n=3 technical replicates. Scale bars, 1000 μm (a), 200 μm and 50 μm (c), 400 μm (d). Source data are available for a-c, e.
Figure 6.
Figure 6.. aKG supplementation inhibits the growth of highly mutated CRC tumours in vivo.
(a) Brightfield images of shApc /KrasG12D/p53fl/fl (AKP) small intestine organoids treated with 3 mM DM-aKG for 3 days, the percentage of organoids with crypts are shown (n=4 biologically independent cultures). Box plots show the maximum, third quartile, median, first quartile and minimum values, and the p value was determined by two-tailed unpaired Student’s t-test. (b) Immunoblot of Apc in AKP organoids upon DM-aKG treatment. The results are representative of two independent experiments. (c) Tumour volume of xenograft tumours established with AKP organoids treated with 600 mg/kg DM-aKG via IP injection daily or 25 mg/ml in drinking water (n=8 tumours per group). Data represent means + SEM, p values at day 20 are shown and were determined by two-tailed unpaired Student’s t-test. (d) H&E staining of control AKP tumour and DM-aKG treated tumours. Results are representative of 3 tumours per group. (e) Relative aKG levels in xenograft tumours established with SW620 colon cancer cells treated with 400 mg/kg DM-aKG by IP injection daily (n=5 tumours per group). (f) Tumour volume measured after DM-aKG treatment for 23 days (n=11 tumours per group). (g) qPCR analysis of Wnt target genes in SW620 xenograft tumours treated with DM-aKG or vehicle control (n=4 tumours per group). Data in e-g represent means ± SD, p values were determined by two-tailed unpaired Student’s t-test. Scale bars, 1000 μm (a), 20 mm (c,f), 100 μm (d). Unprocessed gels are available for b and source data are available for a, c, e-g.
Figure 7.
Figure 7.. aKG supplementation is an effective therapeutic intervention in a mouse model of intestinal cancer.
(a) Relative aKG levels in intestinal tissues of ApcMin/+ mice treated with 400 mg/kg DM-aKG via IP injection or vehicle control (n=4 mice per group). Data represent means ± SD, p value was determined by two-tailed unpaired Student’s t-test. (b) Body weight of ApcMin/+ mice treated with DM-aKG or vehicle control (n=8 mice per group), data represent means ± SEM. (c) PET scan images at day 70 after treatment (top panels) and H&E images of intestinal tissues of ApcMin/+ mice treated with DM-aKG (bottom panels). The results are representative of 3 mice per group. (d) Number of visible intestinal tumours (n=6 mice per group) in ApcMin/+ mice treated with DM-aKG or vehicle control. Box plots show the maximum, third quartile, median, first quartile and minimum values, and the p value was determined by two-tailed unpaired Student’s t-test. (e) Hierarchical clustering of gene expression from RNA sequencing data in tumour-free intestinal tissues of wildtype B6 mice, ApcMin/+ mice and ApcMin/+ mice treated with DM-aKG (n= 7 mice in control group, 6 mice in DM-aKG treated group, 7 mice in wildtype group). (f, g) Panther gene ontology enrichment analysis of cluster 8 and GSEA analysis for the indicated gene signatures between control ApcMin/+ mice and DM-aKG treated mice (n= 7 mice in control group and 6 mice in DM-aKG treated group). Dotted line in f indicate threshold of significance (p = 0.05) and p values were calculated by GO enrichment analysis software. The nominal p values in g are the statistical significance of the enrichment score analyzed by GSEA software. (h) IHC staining for β-catenin of ApcMin/+ mice treated with vehicle control or DM-aKG. The results shown are representative of 3 mice per group. (i) qPCR analysis of stem/Wnt target genes (n=5 tumours for ApcMin/+ mice and n= 4 tumours for wildtype mice). Data represent means ± SD, p values were determined by two-tailed unpaired Student’s t-test. (j) Percentage of rectal bleeding, an indication of intestinal tumours, and (k) percentage survival of ApcMin/+ mice supplemented with 15 mg/ml DM-aKG in the drinking water (n=17 mice per group). The p value in k was determined by Log-rank (Mantel-Cox) test. Scale bars, 20 mm (c), 100 μm (h). Source data are available for a, b, d and i-k.

Comment in

References

    1. Torre LA et al. Global cancer statistics, 2012. CA: a cancer journal for clinicians 65, 87–108, doi:10.3322/caac.21262 (2015). - DOI - PubMed
    1. Fearon ER Molecular Genetics of Colorectal Cancer. Annual Review of Pathology: Mechanisms of Disease 6, 479–507, doi:10.1146/annurev-pathol-011110-130235 (2011). - DOI - PubMed
    1. Schepers A & Clevers H Wnt signaling, stem cells, and cancer of the gastrointestinal tract. Cold Spring Harbor perspectives in biology 4, a007989, doi:10.1101/cshperspect.a007989 (2012). - DOI - PMC - PubMed
    1. Drost J et al. Sequential cancer mutations in cultured human intestinal stem cells. Nature 521, 43–47, doi:10.1038/nature14415 (2015). - DOI - PubMed
    1. Kinzler KW & Vogelstein B Lessons from hereditary colorectal cancer. Cell 87, 159–170 (1996). - PubMed

Publication types