

Mega Regions and Pandemics
- PMID: 32834149
- PMCID: PMC7361226
- DOI: 10.1111/tesg.12449
Mega Regions and Pandemics
Abstract
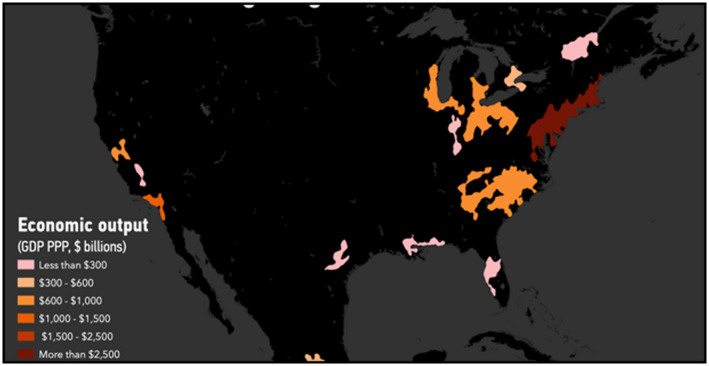
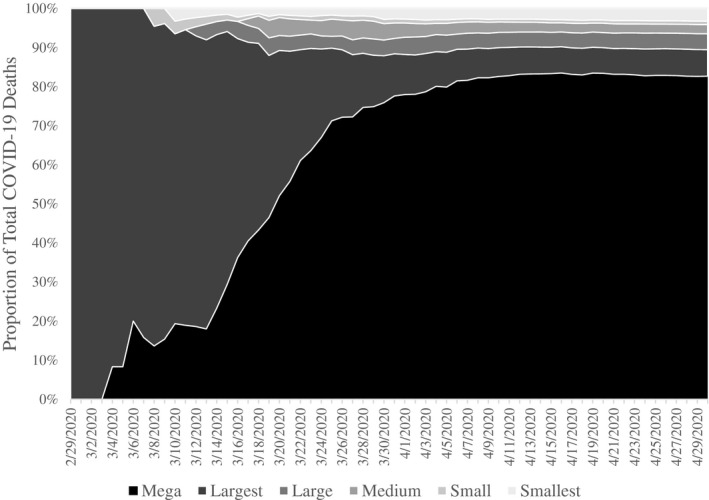
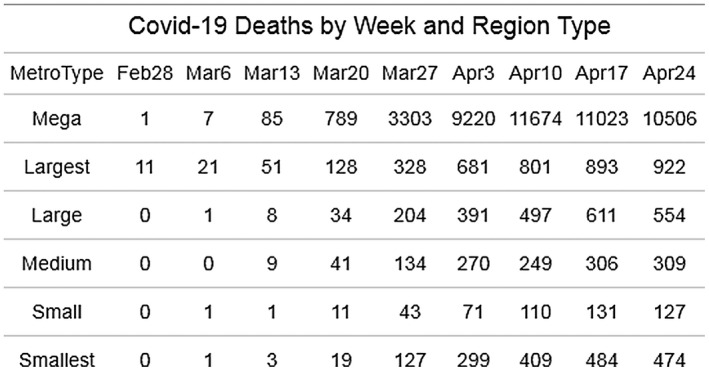
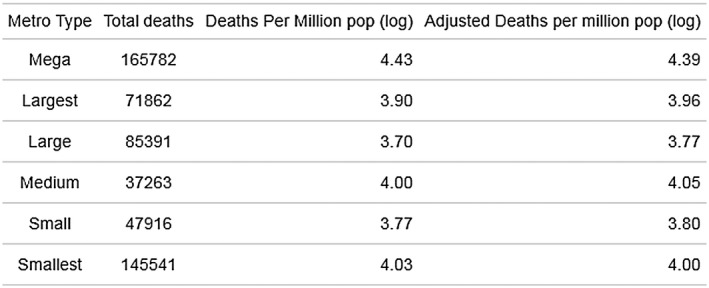
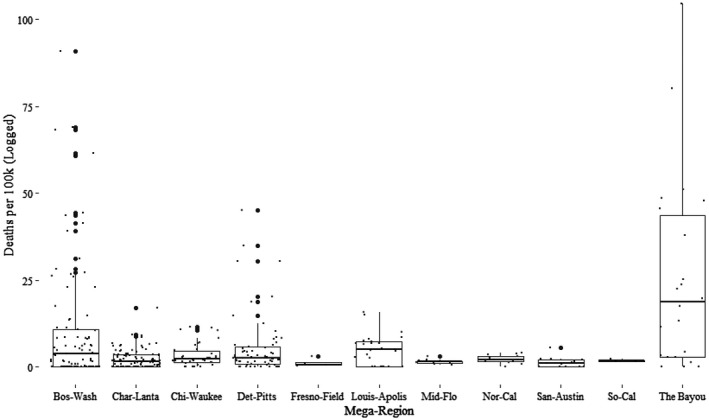
The ongoing COVID-19 crisis has put the relationship between spatial structure and disease exposure into relief. Here, we propose that mega regions - clusters of metropolitan regions like the Acela Corridor in the United States are more exposed to diseases earlier in pandemics. We review standard accounts for the benefits and costs of locating in such regions before arguing that pandemic risk is higher there on average. We test this mega region exposure theory with a study of the US urban system. Our results indicate that American mega regions have born the early brunt of the disease, and that three mega regions are hotspots. From this standpoint, the extent more than the intensity of New York's urbanization may be implicated in its COVID-19 experience. We conclude that early pandemic risk is a hitherto unrecognised diseconomy operating in mega regions.
Keywords: COVID‐19; agglomeration; clustering; coronavirus; regional economic growth; satellite data.
© 2020 Royal Dutch Geographical Society / Koninklijk Nederlands Aardrijkskundig.
Figures
References
-
- Adler, P. , Florida R., & Dias F. (2020), Mega‐Regions, Agglomeration and Economic Structure In: Ratledge E. C. and Iftikhar M. N. eds., Productivity Growth in the US:The Role of Urban and Regional Action. New York: Springer.
-
- Ahlfeldt, G.M. & Feddersen A. (2018), From Periphery to Core: Measuring Agglomeration Effects using High‐speed Rail. Journal of Economic Geography 18, pp. 355–390.
-
- Airports International Council . (2019), Preliminary World Airport Traffic Rankings Released. Available at <https://aci.aero/news/2019/03/13/preliminary‐world‐airport‐traffic‐ranki...>. Accessed 7 May 2020.
-
- Ali, S.H. & Keil R. (2006), Global Cities and the Spread of Infectious Disease: The Case of Severe Acute Respiratory Syndrome (SARS) in Toronto, Canada. Urban Studies 43, pp. 491–509.
-
- Bathelt, H. , Malmberg A. & Maskell P. (2004), Clusters and Knowledge: Local Buzz, Global Pipelines and the Process of Knowledge Creation. Progress in Human Geography 28, pp. 31–56.
LinkOut - more resources
Full Text Sources