. 2020 Nov:140:110121.
doi: 10.1016/j.chaos.2020.110121. Epub 2020 Jul 15.

Deep learning methods for forecasting COVID-19 time-Series data: A Comparative study

Affiliations

Deep learning methods for forecasting COVID-19 time-Series data: A Comparative study

Abdelhafid Zeroual et al. Chaos Solitons Fractals. 2020 Nov.

Abstract

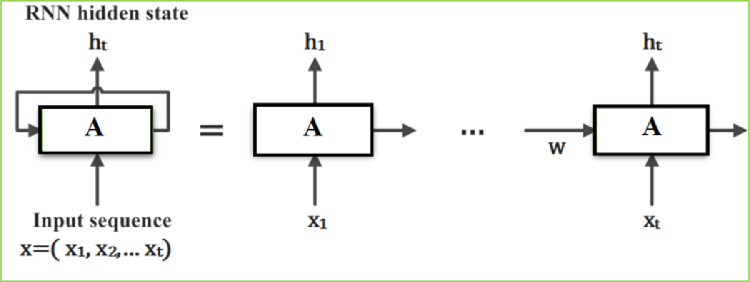
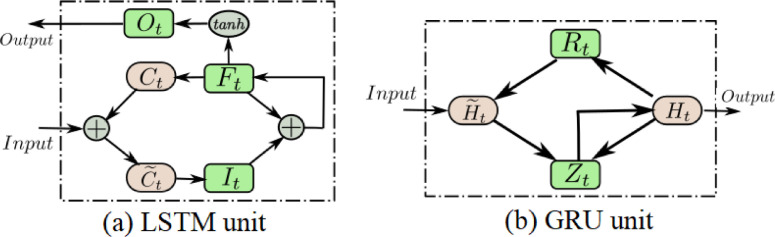
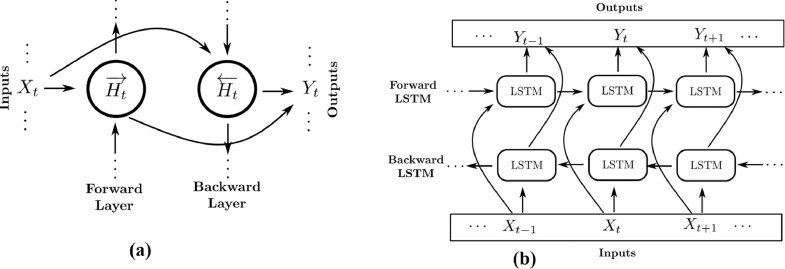
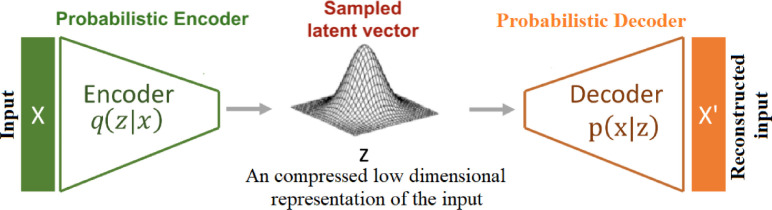
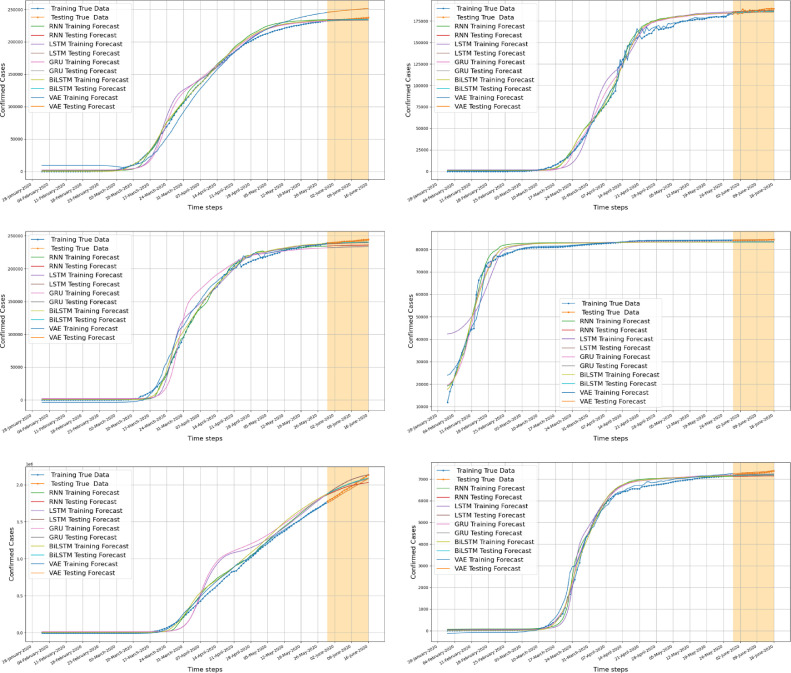
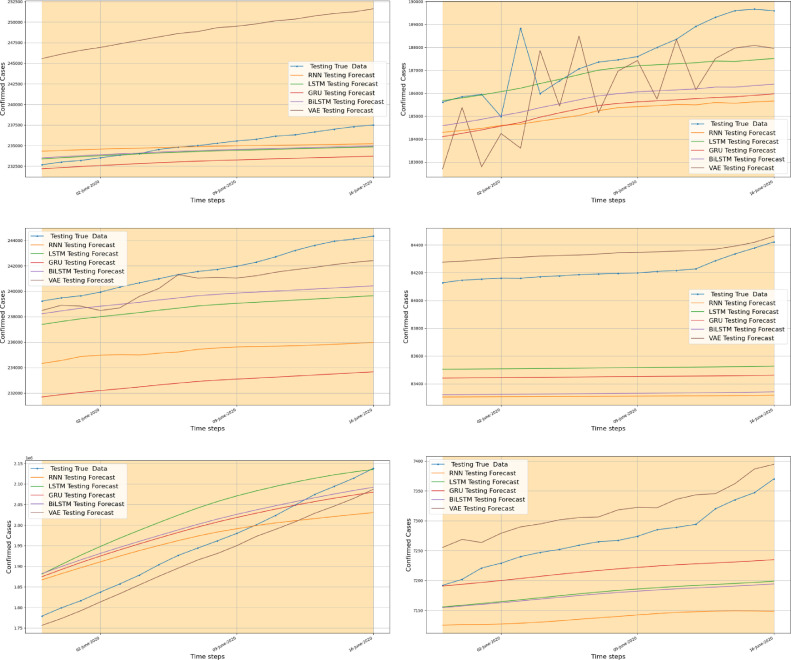
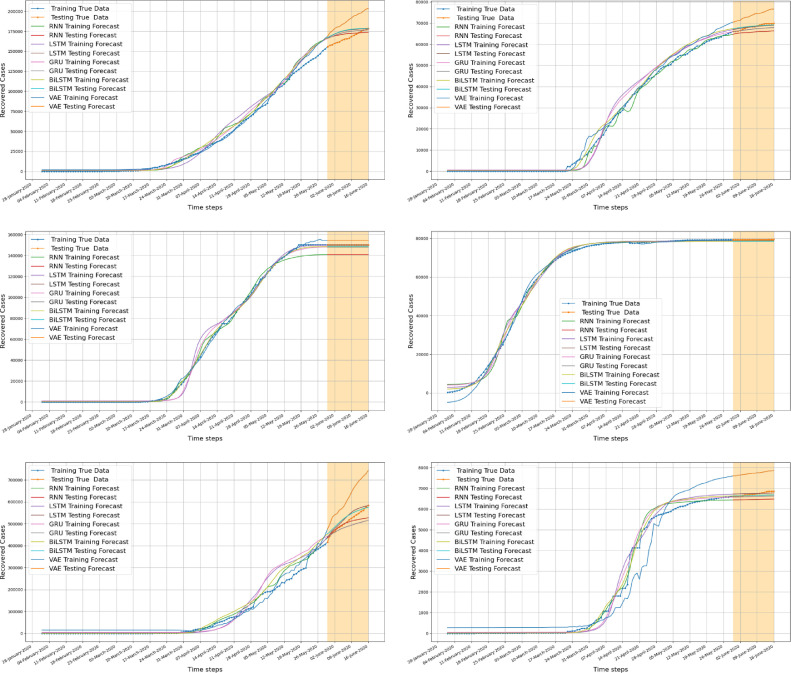
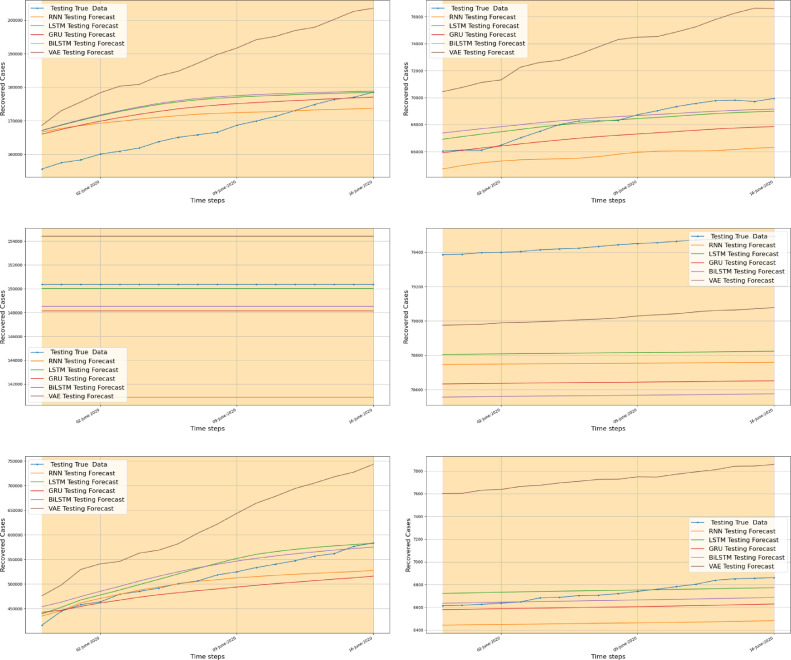
The novel coronavirus (COVID-19) has significantly spread over the world and comes up with new challenges to the research community. Although governments imposing numerous containment and social distancing measures, the need for the healthcare systems has dramatically increased and the effective management of infected patients becomes a challenging problem for hospitals. Thus, accurate short-term forecasting of the number of new contaminated and recovered cases is crucial for optimizing the available resources and arresting or slowing down the progression of such diseases. Recently, deep learning models demonstrated important improvements when handling time-series data in different applications. This paper presents a comparative study of five deep learning methods to forecast the number of new cases and recovered cases. Specifically, simple Recurrent Neural Network (RNN), Long short-term memory (LSTM), Bidirectional LSTM (BiLSTM), Gated recurrent units (GRUs) and Variational AutoEncoder (VAE) algorithms have been applied for global forecasting of COVID-19 cases based on a small volume of data. This study is based on daily confirmed and recovered cases collected from six countries namely Italy, Spain, France, China, USA, and Australia. Results demonstrate the promising potential of the deep learning model in forecasting COVID-19 cases and highlight the superior performance of the VAE compared to the other algorithms.

Keywords: COVID-19; Data-driven; Deep learning; Forecasting; Gated recurrent units; Long short-term memory; Recurrent neural network; Variational autoencoder.


Conflict of interest statement

The authors declare that they have no known competing financial interests or personal relationships that could have appeared to influence the work reported in this paper.

Figures

Fig. 1
Fig. 1
Schematic presentation of RNN.
Fig. 2
Fig. 2
Basic structure of LSTM and GRU models. (a) It, Ft, and Ot represent the three LSTM gates (input, forget and output gates respectively), C and C˜ represent the candidate memory cells and memory cell content. (b) Rt and Zt are reset gate and update gates respectively, Ht and H˜t are the candidate hidden state and hidden state respectively.
Fig. 3
Fig. 3
Schematic representation of (a) Bidirectional RNN structure and (b) Bidirectional LSTM architecture.
Fig. 4
Fig. 4
Schematic representation of Variational Autoencoders architecture.
Fig. 5
Fig. 5
Conceptual framework of the proposed forecasting methods.
Fig. 6
Fig. 6
(a) Total confirmed contaminated COVID-19 cases and (b) COVID-19 deaths in Italy, Spain, France, USA, China, and Australia.
Fig. 7
Fig. 7
ACF of confirmed and covered COVID-19 time-series datasets in the considered countries.
Fig. 8
Fig. 8
Convergence of the loss function of RNN, LSTM, Bi-LSTM, GRU, and VAE models during training stage.
Fig. 9
Fig. 9
Real and forecasted confirmed COVID19 cases using RNN, LSTM, BiLSTM, GRU and VAE (training and testing dataset) for (a) Italy, (b) France, (c) Spain, (d) China, (e) USA and (f) Australia. The orange band represent the forecast horizon.
Fig. 10
Fig. 10
Measured and forecasted confirmed COVID19 cases from 14 April to 21 April 2020 using RNN, LSTM, BiLSTM, GRU and VAE for (a) Italy, (b) France, (c) Spain, (d) China, (e) USA and (f) Australia.
Fig. 11
Fig. 11
Real and forecasted recovered COVID19 cases using RNN, LSTM, BiLSTM, GRU and VAE models (training and testing dataset) for (a) Italy, (b) France, (c) Spain, (d) China, (e) USA and (f) Australia.
Fig. 12
Fig. 12
Measured and forecasted recovered COVID19 cases from 14 April to 21 April 2020 using RNN, LSTM, BiLSTM, GRU and VAE for (a) Italy, (b) France, (c) Spain, (d) China, (e) USA and (f) Australia.

References

    1. Velásquez R.M.A., Lara J.V.M. Forecast and evaluation of COVID-19 spreading in USA with reduced-space gaussian process regression. Chaos Solitons Fractals. 2020:109924. - PMC - PubMed
    1. Yousaf M., Zahir S., Riaz M., Hussain S.M., Shah K. Statistical analysis of forecasting COVID-19 for upcoming month in Pakistan. Chaos Solitons Fractals. 2020:109926. - PMC - PubMed
    1. Ribeiro M.H.D.M., da Silva R.G., Mariani V.C., dos Santos Coelho L. Short-term forecasting COVID-19 cumulative confirmed cases: perspectives for Brazil. Chaos Solitons Fractals. 2020:109853. - PMC - PubMed
    1. Toğaçar M., Ergen B., Cömert Z. COVID-19 detection using deep learning models to exploit social mimic optimization and structured chest x-ray images using fuzzy color and stacking approaches. Comput Biol Med. 2020:103805. - PMC - PubMed
    1. Benvenuto D., Giovanetti M., Vassallo L., Angeletti S., Ciccozzi M. Application of the ARIMA model on the COVID-2019 epidemic dataset. Data Brief. 2020:105340. - PMC - PubMed

LinkOut - more resources