. 2020 Nov:140:110162.
doi: 10.1016/j.chaos.2020.110162. Epub 2020 Jul 29.

Simplified model of Covid-19 epidemic prognosis under quarantine and estimation of quarantine effectiveness

Affiliations

Simplified model of Covid-19 epidemic prognosis under quarantine and estimation of quarantine effectiveness

Algis Džiugys et al. Chaos Solitons Fractals. 2020 Nov.

Abstract

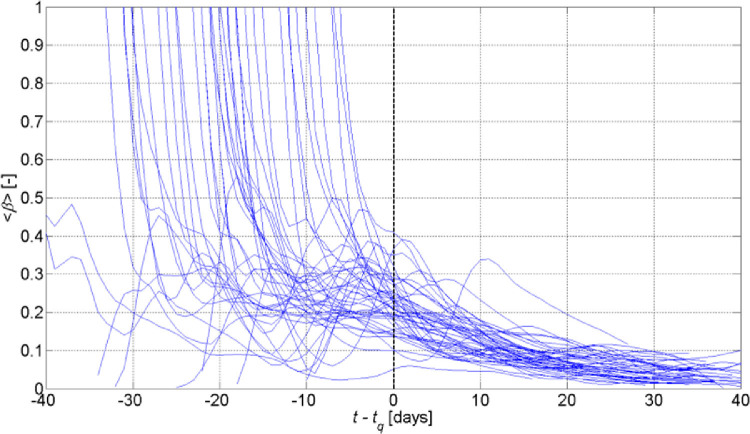
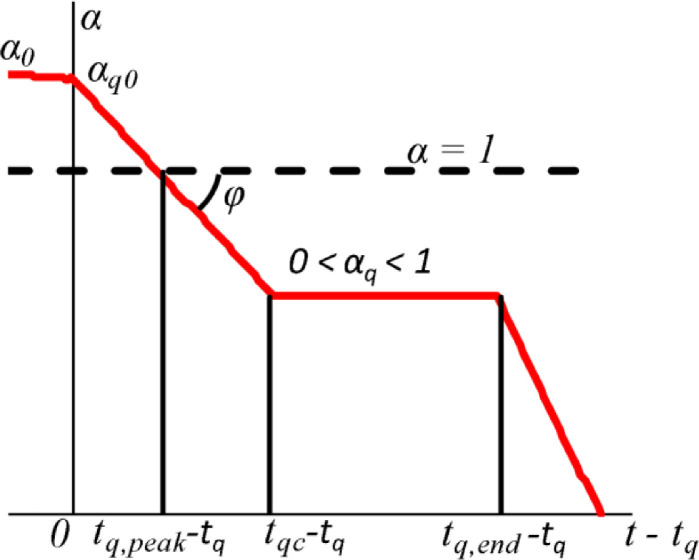
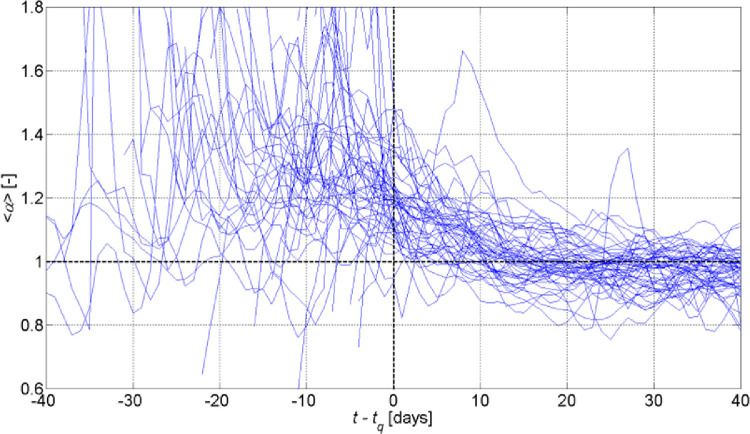
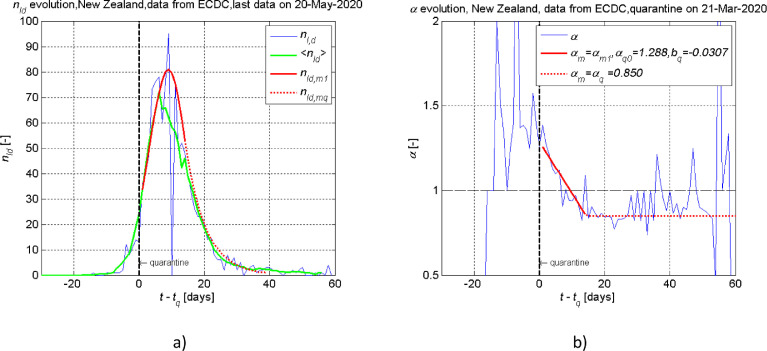
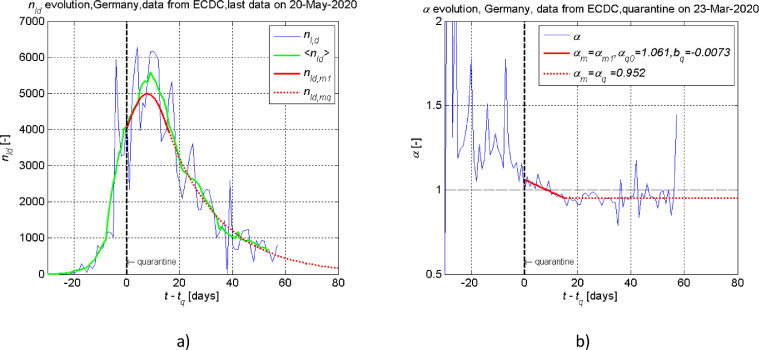
A simplified model of Covid-19 epidemic dynamics under quarantine conditions and method to estimate quarantine effectiveness are developed. The model is based on the daily growth rate of new infections when total number of infections is significantly smaller than population size of infected country or region. The model is developed on the basis of collected epidemiological data of Covid19 pandemic, which shows that the daily growth rate of new infections has tendency to decrease linearly when the quarantine is imposed in a country (or a region) until it reaches a constant value, which corresponds to the effectiveness of quarantine measures taken in the country. The daily growth rate of new infections can be used as criteria to estimate quarantine effectiveness.

Keywords: COVID-19; Forecast; Modelling; Pandemic; Quarantine effectiveness; SARS-COV-2.


Conflict of interest statement

The authors declare that they have no known competing financial interests or personal relationships that could have appeared to influence the work reported in this paper.

Figures

Fig 1
Fig. 1
The averaged infectious rate 〈β〉 versus time for 46 countries. Vertical black line points the day of imposed quarantine.
Fig 2
Fig. 2
Idealized scenario of the growth rate of new cases α dynamics with quarantine effectiveness eq: a) eq=1, b) eq < 1.
Fig 3
Fig. 3
Realistic scenario of the growth rate of new cases α dynamics.
Fig 4
Fig. 4
The averaged daily growth rate of new infection cases 〈α〉 versus time for 46 countries. Vertical black line points the day of imposed quarantine.
Fig 5
Fig. 5
Dynamics of the daily new cases nId (a) and the daily growth rate of new cases α (b) for Australia. Vertical black line points the day of imposed quarantine on 2020 March 23. Data collected from .
Fig 6
Fig. 6
Dynamics of the daily new cases nId (a) and the daily growth rate of new cases α (b) for Switzerland. Vertical black line points the day of first quarantine action on 2020 March 13. Data collected from .
Fig 7
Fig. 7
Dynamics of the daily new cases nId (a) and the daily growth rate of new cases α (b) for New Zealand. Vertical black line points the day of imposed quarantine on 2020 March 21. Data collected from .
Fig 8
Fig. 8
Dynamics of the daily new cases nId (a) and the daily growth rate of new cases α (b) for Iceland. Vertical black line points the day of imposed quarantine on 2020 March 16. Data collected from .
Fig 9
Fig. 9
Dynamics of the daily new cases nId (a) and the daily growth rate of new cases α (b) for Austria. Vertical black line points the day of first quarantine action on 2020 March 16. Data collected from .
Fig 10
Fig. 10
Dynamics of the daily new cases nId (a) and the daily growth rate of new cases α (b) for Poland. Vertical black line points the day of imposed quarantine on 2020 March 12. Data collected from .
Fig 11
Fig. 11
Dynamics of the daily new cases nId (a) and the daily growth rate of new cases α (b) for Italy. Vertical black line points the day of imposed quarantine on 2020 March 09. Data collected from .
Fig 12
Fig. 12
Dynamics of the daily new cases nId (a) and the daily growth rate of new cases α (b) for Germany. Vertical black line points the day of imposed quarantine on 2020 March 23. Data collected from .
Fig 13
Fig. 13
Dynamics of the daily new cases nId (a) and the daily growth rate of new cases α (b) for the United Kingdom. Vertical black line points the day of imposed quarantine on 2020 March 24. Data collected from .
Fig 14
Fig. 14
Dynamics of the daily new cases nId (a) and the daily growth rate of new cases α (b) for Denmark. Vertical black line points the day of imposed quarantine on 2020 March 11. Data collected from .
Fig 15
Fig. 15
Dynamics of the daily new cases nId (a) and the daily growth rate of new cases α (b) for Russia. Vertical black line points the day of imposed quarantine on 2020 March 30. Data collected from .
Fig 16
Fig. 16
Dynamics of the daily new cases nId (a) and the daily growth rate of new cases α (b) for USA. Vertical black line points the day of supposed average quarantine date 2020 March 20. Data collected from .
Fig 17
Fig. 17
Dynamics of the daily new cases nId (a) and the daily growth rate of new cases α (b) for Sweden. Vertical black line points the day of imposed initial quarantine actions on 2020 March 10. Data collected from .

References

    1. Coronavirus: 4.5 billion people confined n.d.https://www.rappler.com/world/global-affairs/258310-coronavirus-billion-....
    1. European Centre for Disease Prevention and Control n.d.https://www.ecdc.europa.eu/en/publications-data/download-todays-data-geo....
    1. Bohk-Ewald C, Dudel C, Myrskyla M. A demographic scaling model for estimating the total number of COVID-19 infections. Med RXIV. 2020;2020 doi: 10.1101/2020.04.23.20077719. 04.23.20077719. - DOI - PMC - PubMed
    1. COVID-19 Dashboard by the Center for Systems Science and Engineering (CSSE) at Johns Hopkins University (JHU) n.d.https://gisanddata.maps.arcgis.com/apps/opsdashboard/index.html#/bda7594....
    1. Tang X, Wu C, Li X, Song Y, Yao X, Wu X. On the origin and continuing evolution of SARS-CoV-2. Natl Sci Rev. 2020 doi: 10.1093/nsr/nwaa036. - DOI - PMC - PubMed

LinkOut - more resources