. 2020 Nov:140:110165.
doi: 10.1016/j.chaos.2020.110165. Epub 2020 Aug 19.

An SEIARD epidemic model for COVID-19 in Mexico: Mathematical analysis and state-level forecast

Affiliations

An SEIARD epidemic model for COVID-19 in Mexico: Mathematical analysis and state-level forecast

Ugo Avila-Ponce de León et al. Chaos Solitons Fractals. 2020 Nov.

Abstract

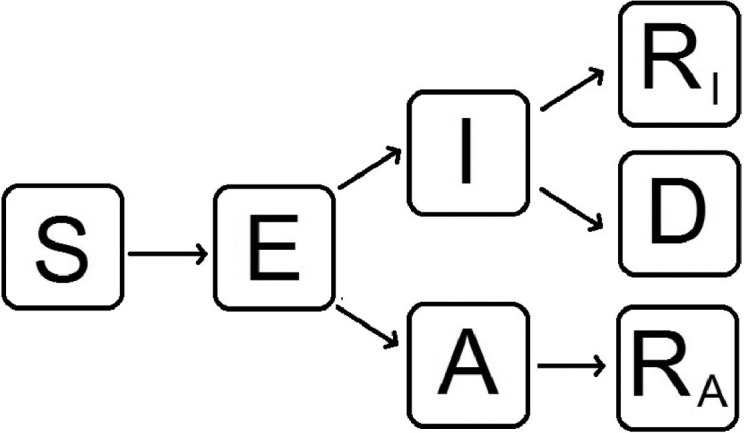
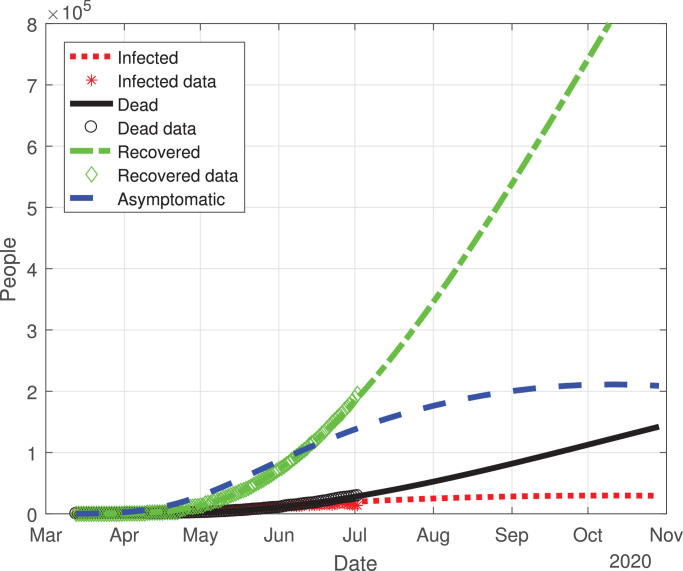
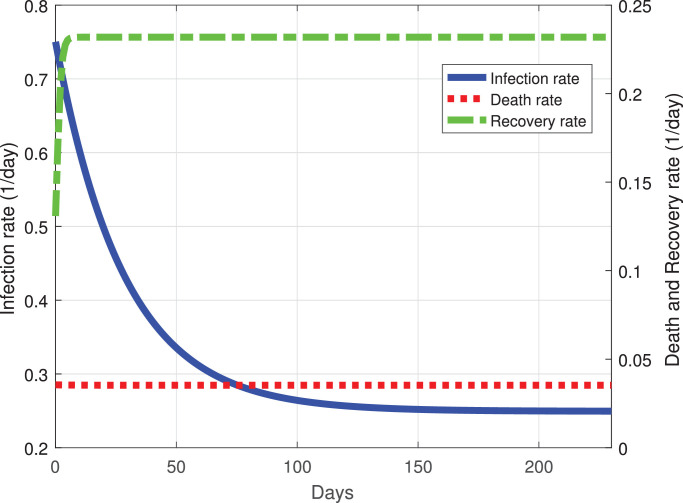
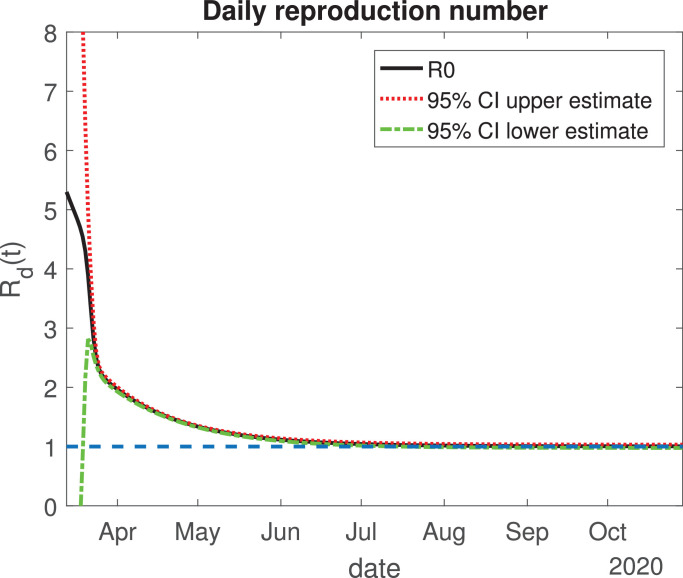
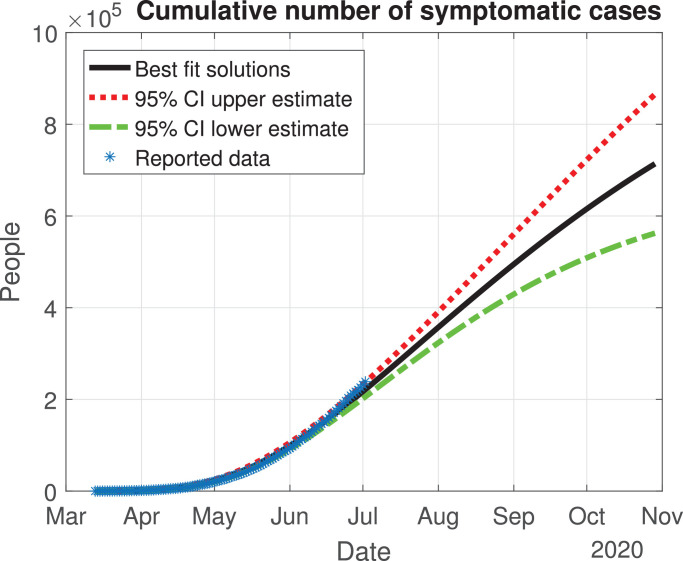
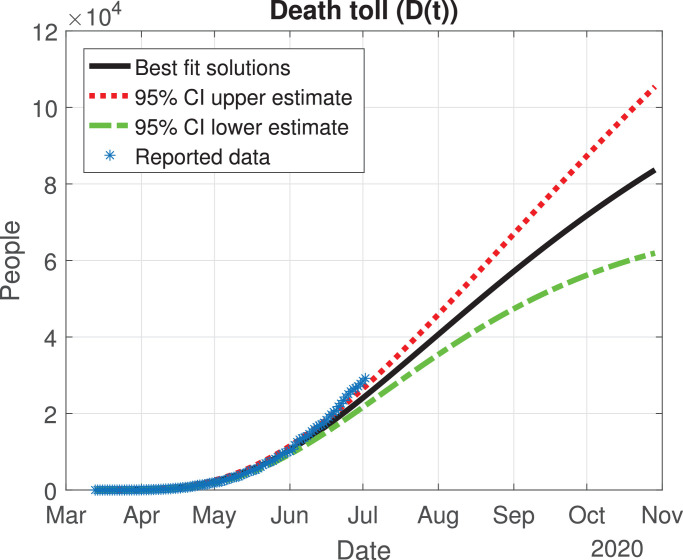
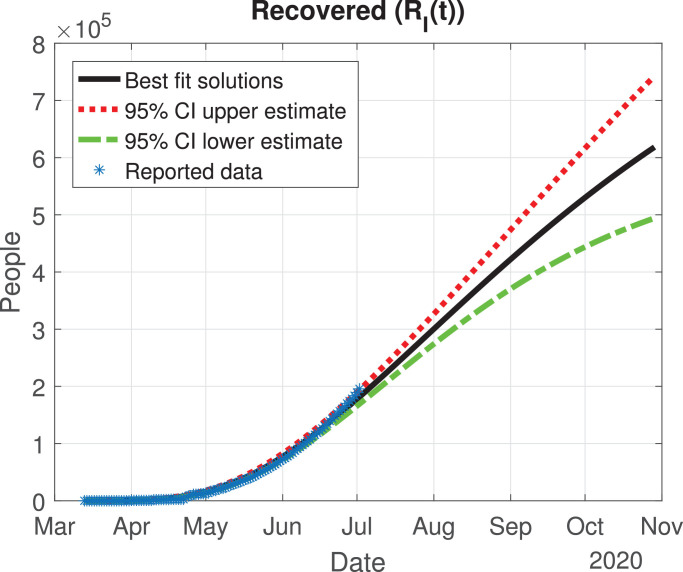
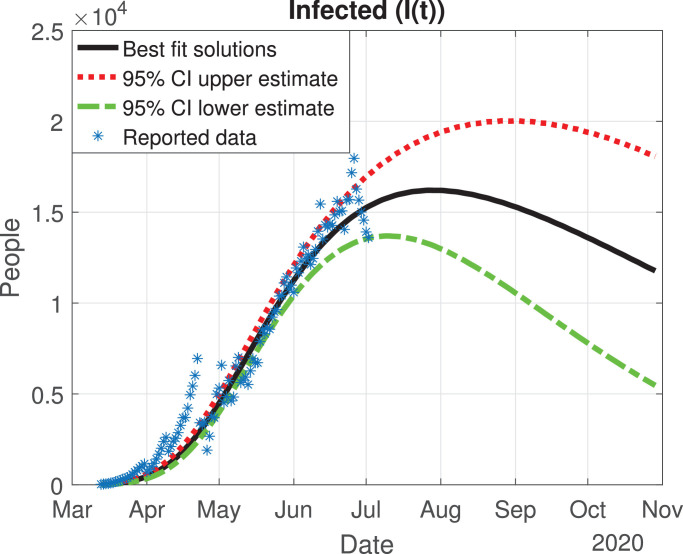
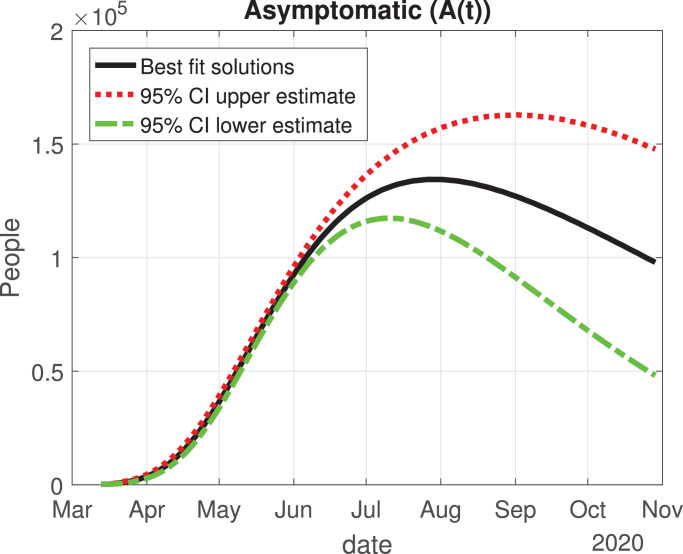
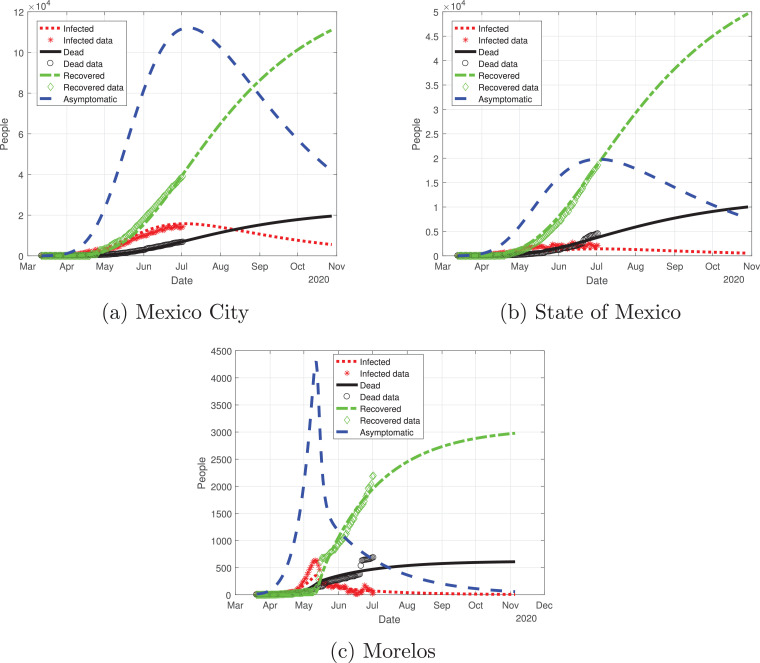
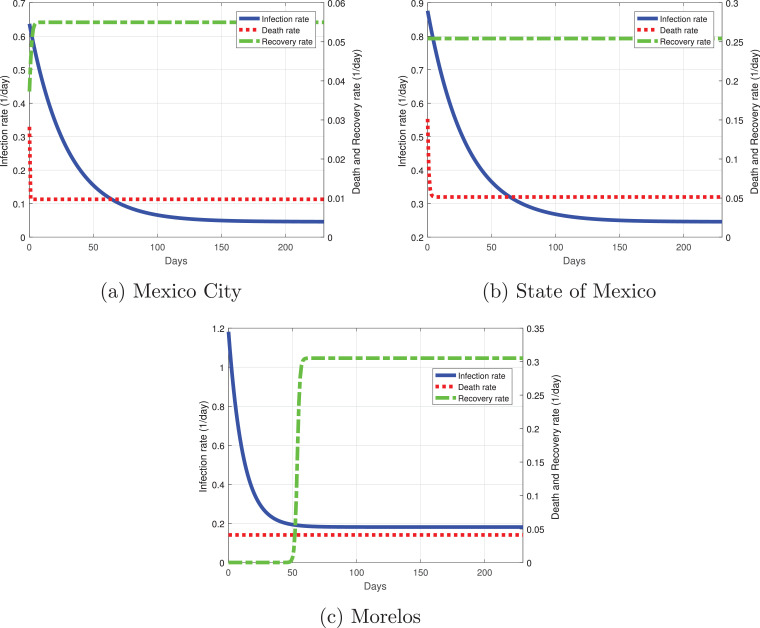
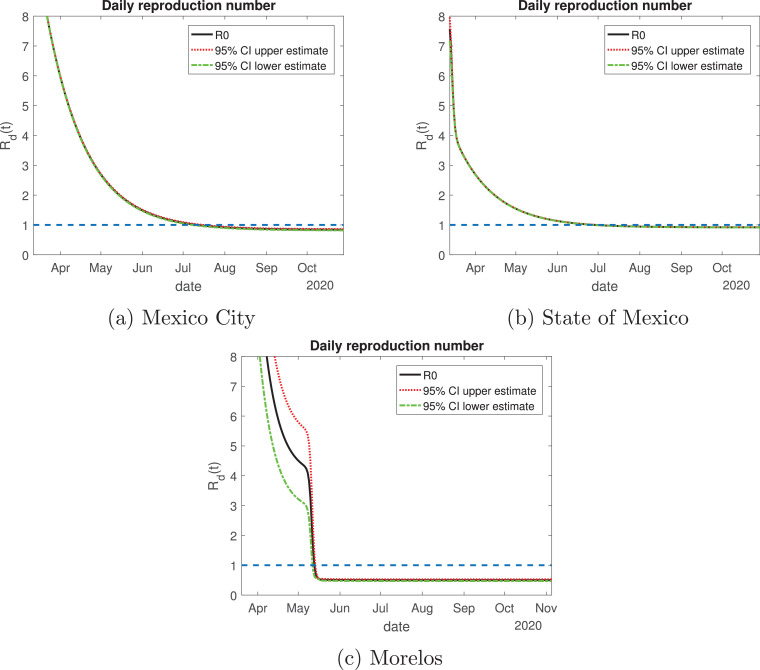
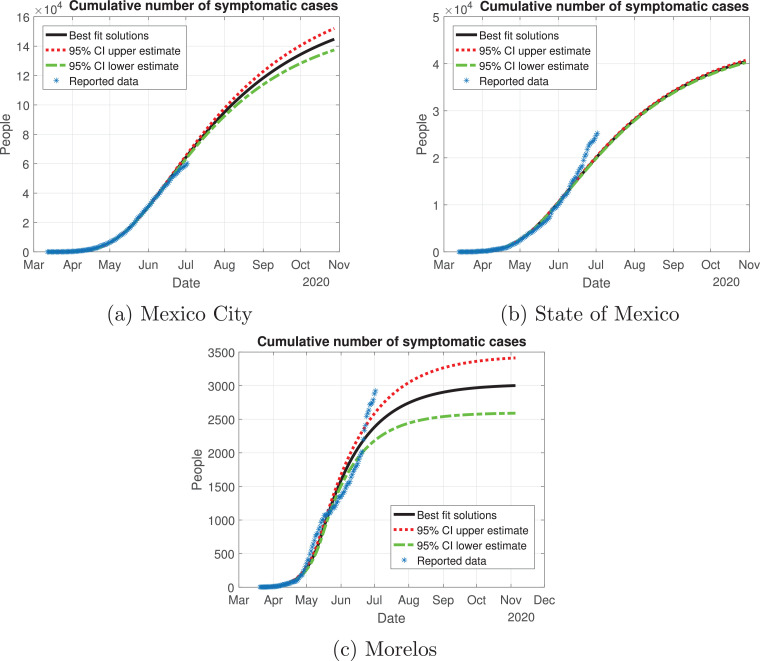
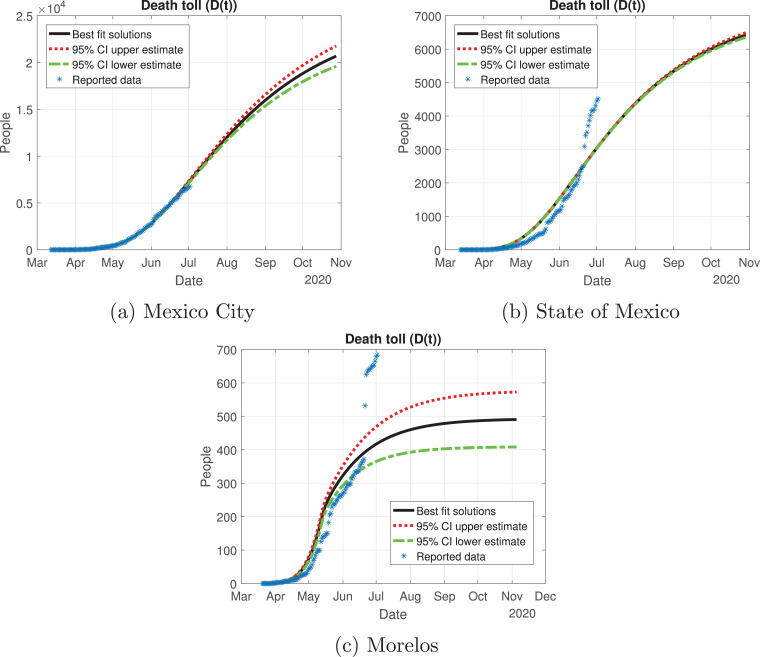
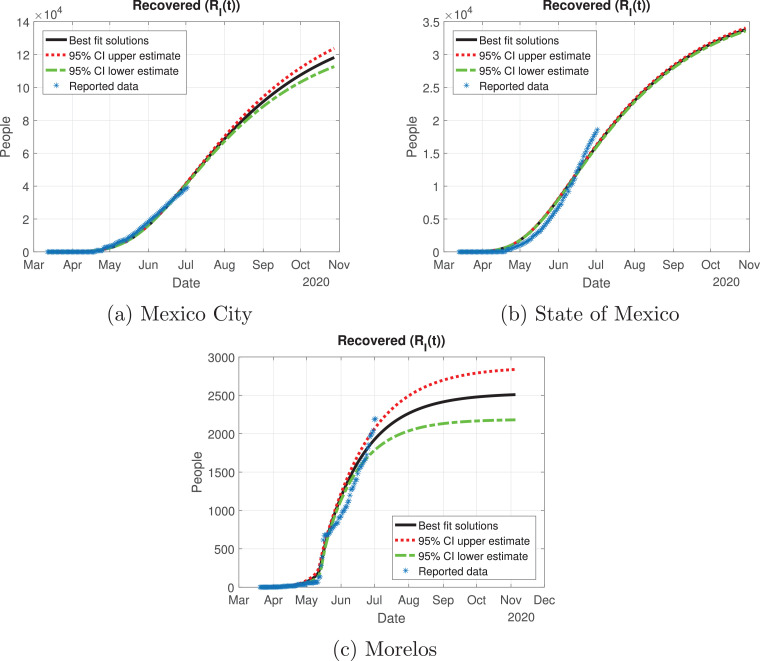
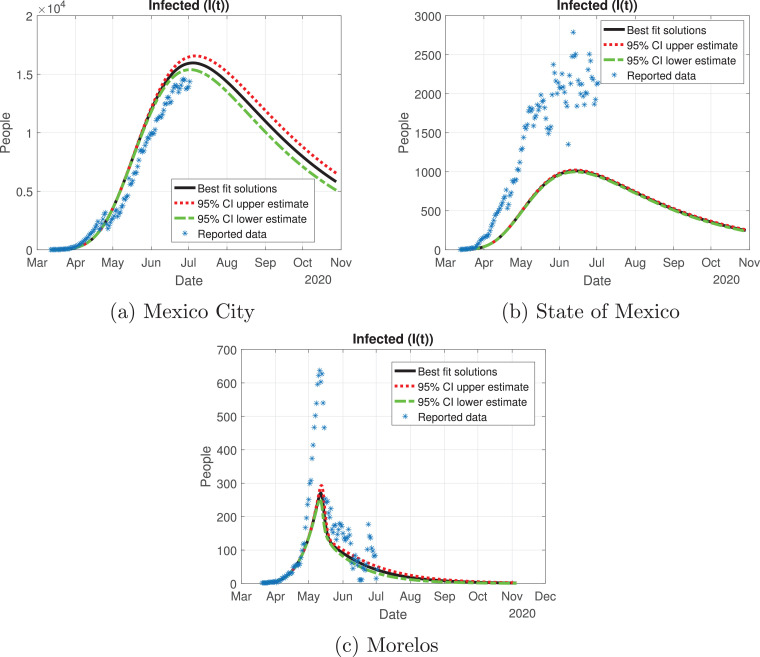
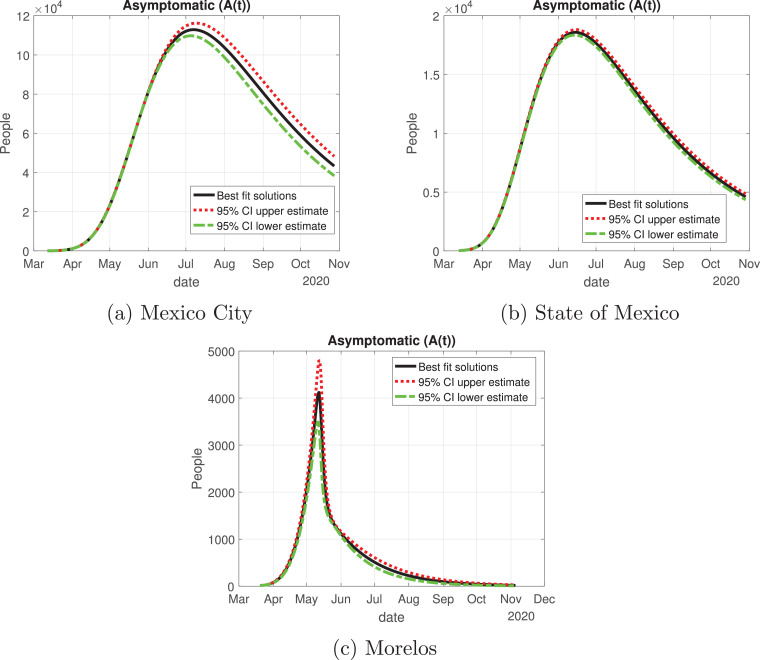
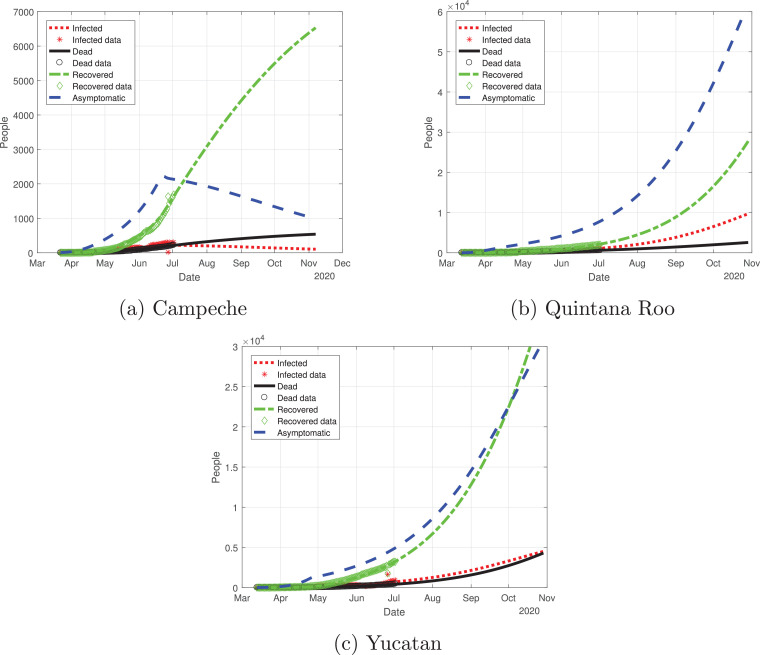
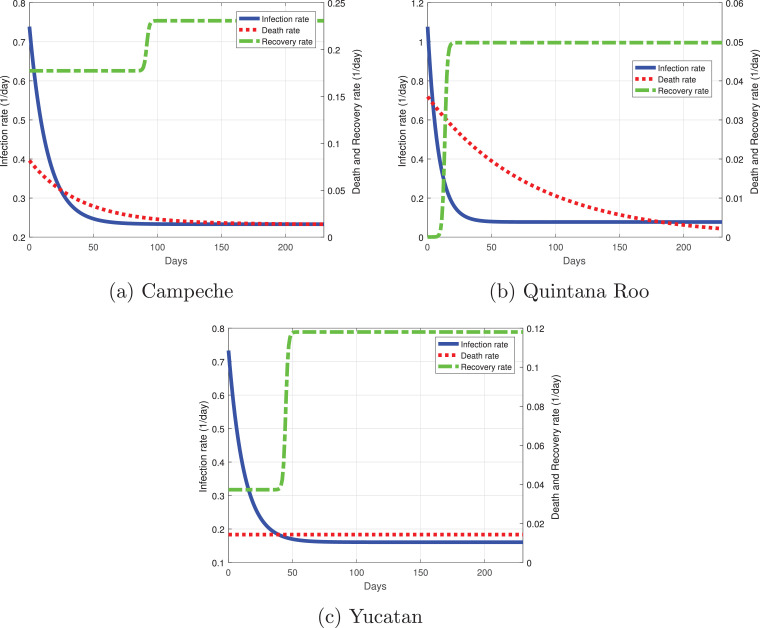
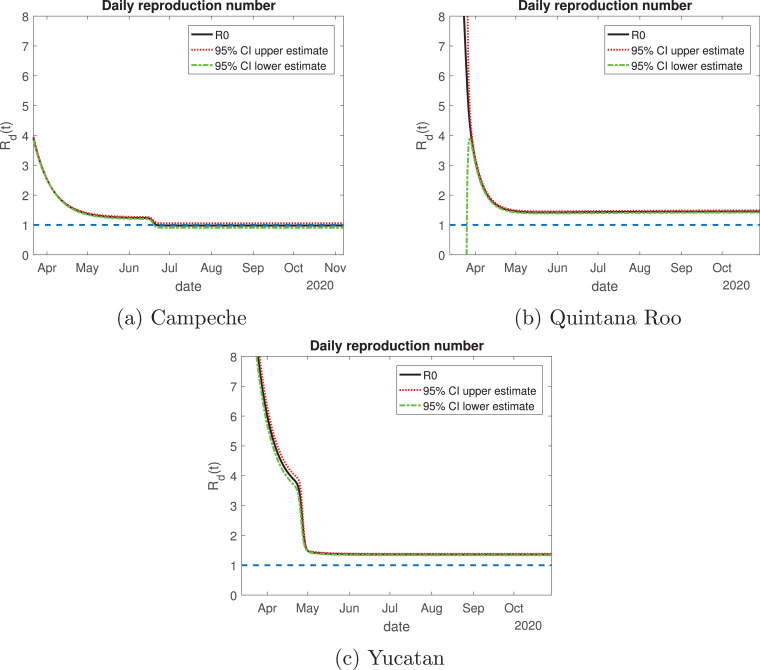
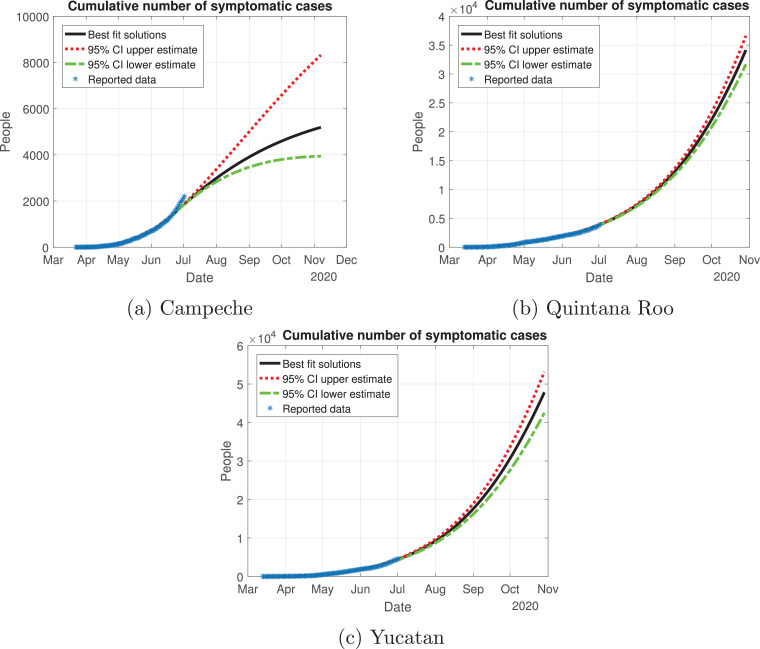
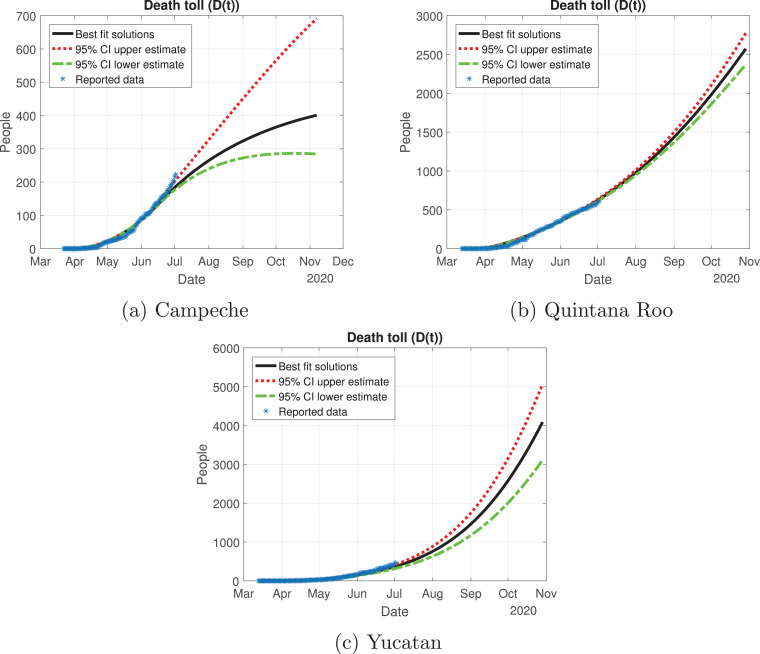
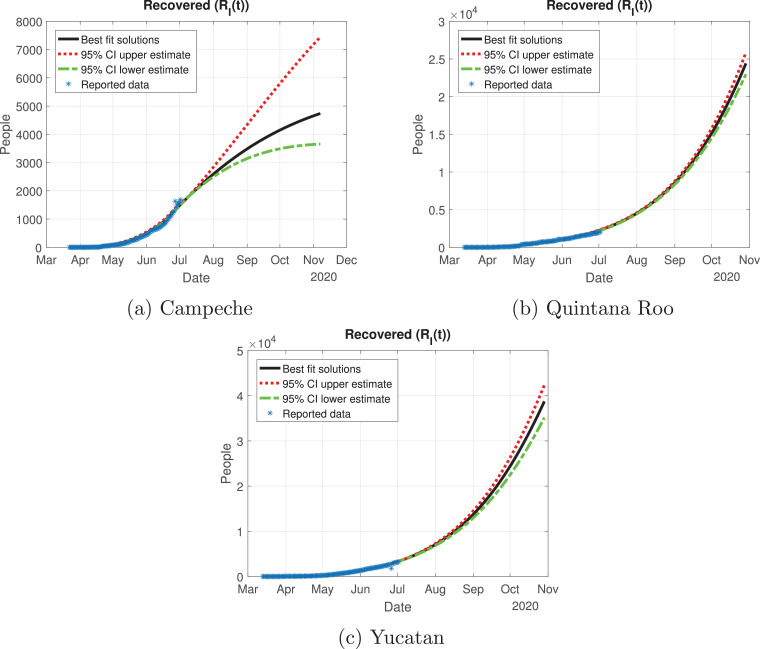
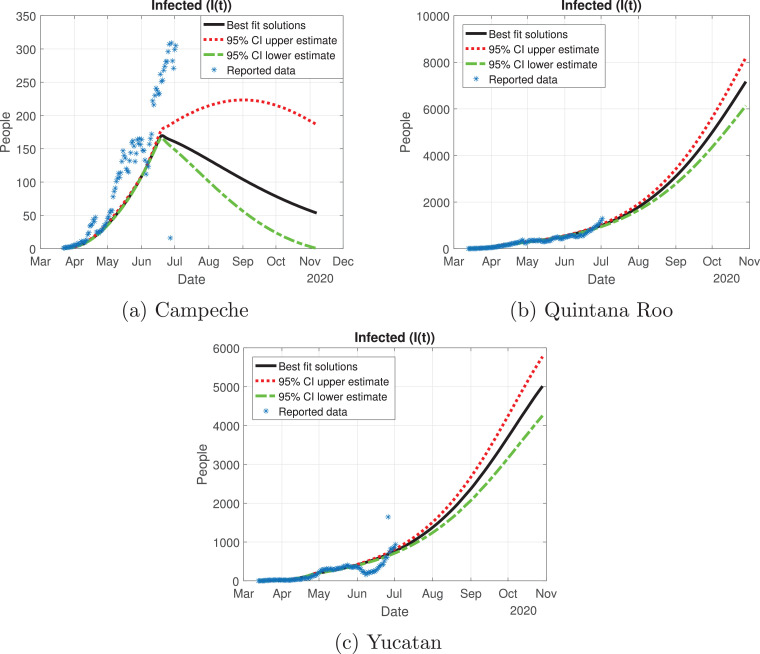
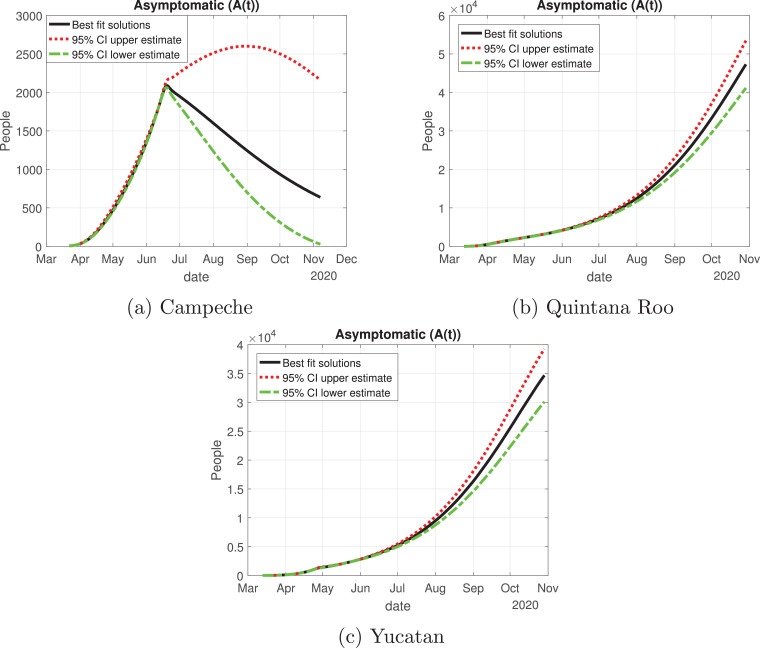
We propose an SEIARD mathematical model to investigate the current outbreak of coronavirus disease (COVID-19) in Mexico. Our model incorporates the asymptomatic infected individuals, who represent the majority of the infected population (with symptoms or not) and could play an important role in spreading the virus without any knowledge. We calculate the basic reproduction number (R 0) via the next-generation matrix method and estimate the per day infection, death and recovery rates. The local stability of the disease-free equilibrium is established in terms of R 0. A sensibility analysis is performed to determine the relative importance of the model parameters to the disease transmission. We calibrate the parameters of the SEIARD model to the reported number of infected cases, fatalities and recovered cases for several states in Mexico by minimizing the sum of squared errors and attempt to forecast the evolution of the outbreak until November 2020.

Keywords: COVID-19; Disease dynamics; Effective daily reproduction ratio; Mexico; Sensitivity analysis.


Conflict of interest statement

The authors declare that they have no known competing financial interests or personal relationships that could have appeared to influence the work reported in this paper.

Figures

Fig. 1
Fig. 1
Flow diagram of our mathematical model to evaluate the behavior of the spread of nCoV-2019 in Mexico. S: susceptible, E: exposed, I: infected with symptoms, A: infected but without symptoms (asymptomatic), RI: recovered from symptomatic infection, RA: recovered from asymptomatic infection, D: dead.
Fig. 2
Fig. 2
Graphs for the spread of COVID-19 in Mexico. The dotted red line represents infected individuals, the solid black line represents the fatalities by the disease, the dash-dot green line represents recovered individuals, finally, the dashed blue line represents infected individuals but without any type of symptoms. (For interpretation of the references to color in this figure legend, the reader is referred to the web version of this article.)
Fig. 3
Fig. 3
Best fit values of the infection, recovery and death rates as functions of time. Dotted red line is the death rate, dash-dot green line the recovery rate and the solid blue line the infection rate. (For interpretation of the references to color in this figure legend, the reader is referred to the web version of this article.)
Fig. 4
Fig. 4
Variation of the effective daily reproduction number through time. The solid black line represents the value of the reproduction number; the red dotted and green dash-dot lines are the 95% confidence interval upper and lower bounds, respectively. The blue dashed line represents the value one. (For interpretation of the references to color in this figure legend, the reader is referred to the web version of this article.)
Fig. 5
Fig. 5
Cumulative number of symptomatic infected individuals (I(t)+RI(t)+D(t)) predicted by the model, 95% confidence interval and reported cases.
Fig. 6
Fig. 6
Death toll (D(t)) predicted by the model, 95% confidence interval and reported number of fatalities.
Fig. 7
Fig. 7
Number of recovered cases (RI(t)) predicted by the model, 95% confidence interval and reported number of recoveries.
Fig. 8
Fig. 8
Number of infected cases (I(t)) predicted by the model, 95% confidence interval and number of active infections computed from the reported data.
Fig. 9
Fig. 9
Number of asymptomatic cases (A(t)) predicted by the model and 95% confidence interval.
Fig. 10
Fig. 10
Graphs for the spread of COVID-19 in the Valley of Mexico. Dotted red lines represent infected individuals, solid black lines represent the fatalities by the disease, dash-dot green lines represent recovered individuals, finally, dashed blue lines represent infected individuals but without any type of symptoms. (For interpretation of the references to color in this figure legend, the reader is referred to the web version of this article.)
Fig. 11
Fig. 11
Best fit parameters of the infection, death and recovery rates as functions of time for the Valley of Mexico. Dotted red line is the death rate, dash-dot green line the recovery rate and the solid blue line the infection rate. (For interpretation of the references to color in this figure legend, the reader is referred to the web version of this article.)
Fig. 12
Fig. 12
Variation of the effective daily reproduction number through time for the Mexico Valley. The solid black line represents the value of the reproduction number; the red dotted and green dash-dot lines are the 95% confidence interval upper and lower bounds, respectively. The blue dashed line represents the value one. (For interpretation of the references to color in this figure legend, the reader is referred to the web version of this article.)
Fig. 13
Fig. 13
Cumulative number of symptomatic infected individuals C(t)=I(t)+RI(t)+D(t) predicted by the model, 95% confidence intervals and reported cases for the Mexico Valley.
Fig. 14
Fig. 14
Death toll (D(t)) predicted by the model, 95% confidence intervals and reported number of fatalities for the Mexico Valley.
Fig. 15
Fig. 15
Number of recovered cases (RI(t)) predicted by the model of the Mexico Valley, 95% confidence intervals and reported number of recoveries.
Fig. 16
Fig. 16
Number of infected cases (I(t)) predicted by the model of the Mexico Valley, 95% confidence intervals and number of active infections computed from the reported data.
Fig. 17
Fig. 17
Number of asymptomatic cases (A(t)) predicted by our model for the Mexico Valley and 95% confidence intervals.
Fig. 18
Fig. 18
Graphs for the spread of COVID-19 in the Yucatan Peninsula. Dotted red lines represent infected individuals, solid black lines represent the fatalities by the disease, dash-dot green lines represent recovered individuals, finally, dashed blue lines represent infected individuals but without any type of symptoms. (For interpretation of the references to color in this figure legend, the reader is referred to the web version of this article.)
Fig. 19
Fig. 19
Best fit parameters of the infection, death and recovery rates as functions of time for the Yucatan Peninsula. Dotted red line is the death rate, dash-dot green line the recovery rate and the solid blue line the infection rate. (For interpretation of the references to color in this figure legend, the reader is referred to the web version of this article.)
Fig. 20
Fig. 20
Variation of the effective daily reproduction number throughout time for the Yucatan Peninsula. The solid black line represents the value of the reproduction number; the red dotted and green dash-dot lines are the 95% confidence interval upper and lower bounds, respectively. The blue dashed line represents the value one. (For interpretation of the references to color in this figure legend, the reader is referred to the web version of this article.)
Fig. 21
Fig. 21
Cumulative number of symptomatic infected individuals C(t)=I(t)+RI(t)+D(t) predicted by the model, 95% confidence intervals and reported cases for the Yucatan Peninsula.
Fig. 22
Fig. 22
Death toll (D(t)) predicted by the model, 95% confidence intervals and reported number of fatalities for the Yucatan Peninsula.
Fig. 23
Fig. 23
Number of recovered cases (RI(t)) predicted by the model of the Yucatan Peninsula, 95% confidence intervals and reported number of recoveries.
Fig. 24
Fig. 24
Number of infected cases (I(t)) predicted by the model of the Yucatan Peninsula, 95% confidence intervals and number of active infections computed from the reported data.
Fig. 25
Fig. 25
Number of asymptomatic cases (A(t)) predicted by our model for the Yucatan Peninsula and 95% confidence intervals.

References

    1. Zhang G., Zhang J., Wang B., Zhu X., Wang Q., Qiu S. Analysis of clinical characteristics and laboratory findings of 95 cases of 2019 novel coronavirus pneumonia in Wuhan, China: a retrospective analysis. Respir Res. 2020;21(1):1–10. - PMC - PubMed
    1. Coronaviridae Study Group of the International Committee on Taxonomy of Viruses The species severe acute respiratory syndrome-related coronavirus: classifying 2019-nCoV and naming it SARS-CoV-2. Nat Microbiol. 2020;5:536–544. - PMC - PubMed
    1. Urso D.L. Coronavirus disease 2019 (COVID-19): A brief report. Clin Manag Issues. 2020;14(1):15–19.
    1. Cruz-Pacheco G., Bustamante-Castaneda F.J., Caputo J.G., Jimenez-Corona M.E., Ponce-de Leon S. Dispersion of a new coronavirus SARS-CoV-2 by airlines in 2020: Temporal estimates of the outbreak in Mexico. medRxiv2020. - PubMed
    1. Alvarez M.M., Gonzalez-Gonzalez E., Trujillo-de Santiago G.. Modeling COVID-19 epidemics in an Excel spreadsheet: Democratizing the access to first-hand accurate predictions of epidemic outbreaks. medRxiv2020. - PMC - PubMed

LinkOut - more resources