. 2020 Nov:140:110203.
doi: 10.1016/j.chaos.2020.110203. Epub 2020 Aug 15.

Neural network powered COVID-19 spread forecasting model

Affiliations

Neural network powered COVID-19 spread forecasting model

Michał Wieczorek et al. Chaos Solitons Fractals. 2020 Nov.

Abstract

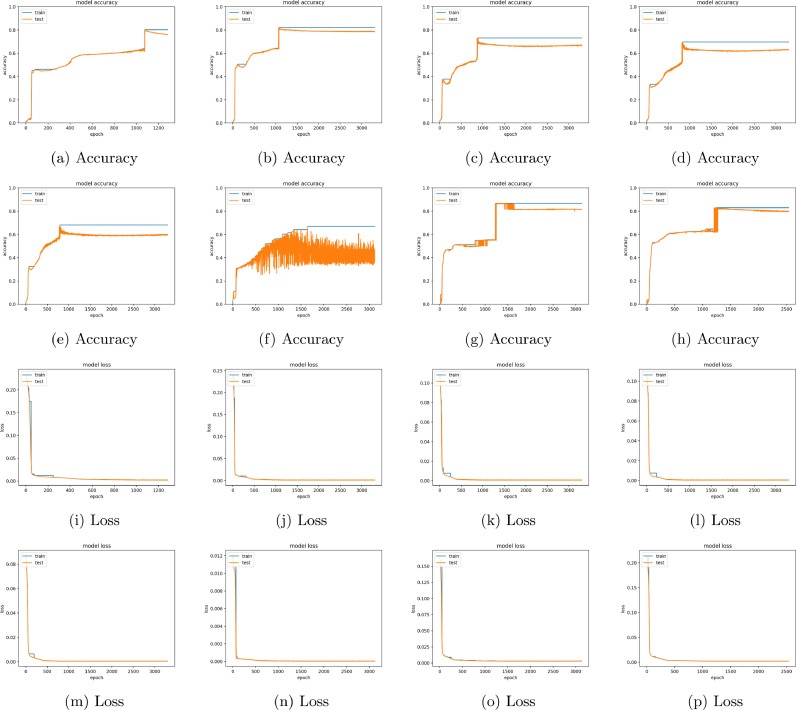
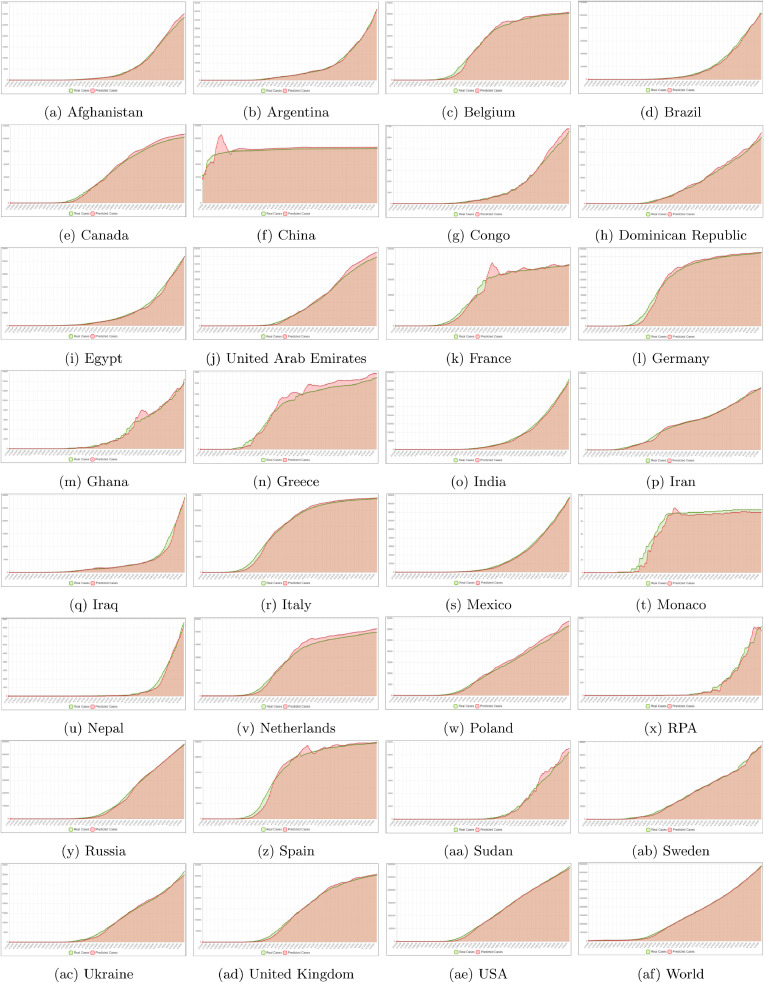
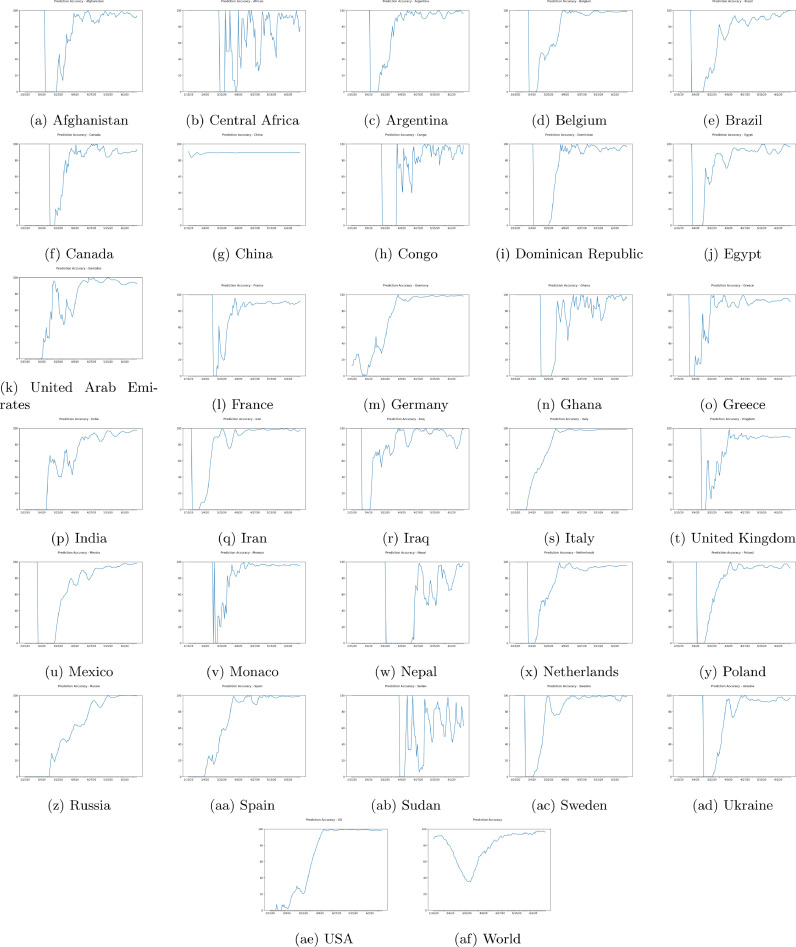
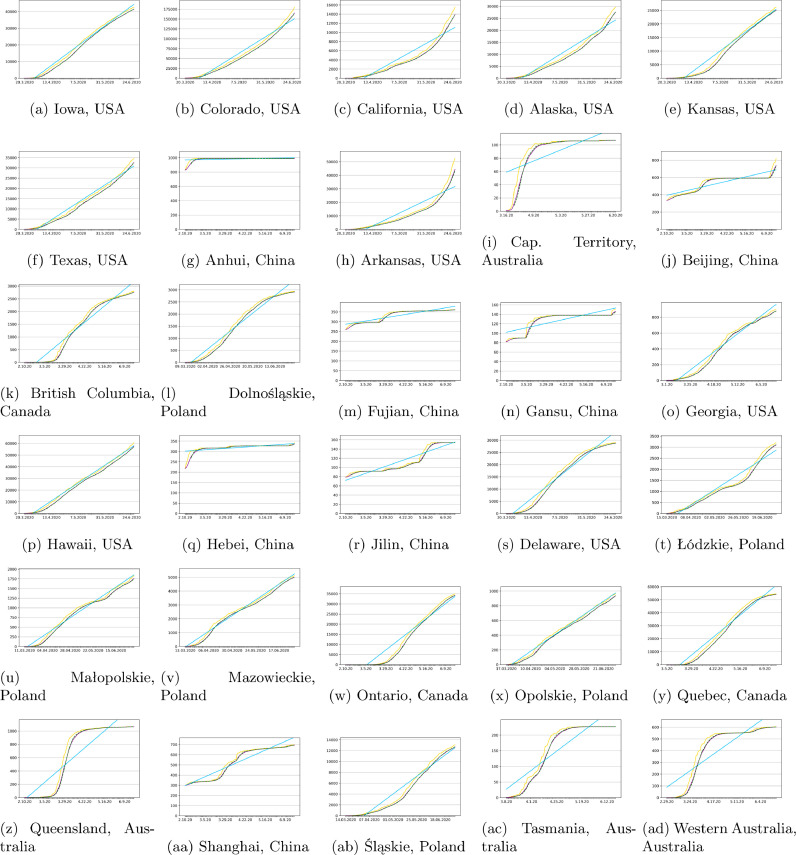
Virus spread prediction is very important to actively plan actions. Viruses are unfortunately not easy to control, since speed and reach of spread depends on many factors from environmental to social ones. In this article we present research results on developing Neural Network model for COVID-19 spread prediction. Our predictor is based on classic approach with deep architecture which learns by using NAdam training model. For the training we have used official data from governmental and open repositories. Results of prediction are done for countries but also regions to provide possibly wide spectrum of values about predicted COVID-19 spread. Results of the proposed model show high accuracy, which in some cases reaches above 99%.

Keywords: 60G25; 68T05; 68T37; COVID-19; Neural network; Prediction.


Conflict of interest statement

The authors declare that they have no known competing financial interests or personal relationships that could have appeared to influence the work reported in this paper.

Figures

Fig. 1
Fig. 1
Predicted total cases curve using different time-steps.
Fig. 2
Fig. 2
Developed ANN architecture.
Fig. 3
Fig. 3
Test results of using ANN on different parts of the research dataset.
Fig. 4
Fig. 4
Test results of using RNN on different parts of the research dataset.
Fig. 5
Fig. 5
Results of using different optimization algorithms. On this plots we can see the loss and accuracy during training for the World.
Fig. 7
Fig. 7
Sample predicted COVID-19 cases growth curve in selected countries.
Fig. 8
Fig. 8
Sample predicted COVID-19 cases growth curve in selected regions.
Fig. 9
Fig. 9
Accuracy per day for selected countries.
Fig. 10
Fig. 10
Accuracy per day for selected regions.
Fig. 6
Fig. 6
Graphs showing various statistical methods in comparison to real number of detected cases. Yellow - number of detected cases, Green (dotted line) - Sample Moving Average (SMA), Magenta - Exponential Moving Average (EMA), Blue - linear trend line. (For interpretation of the references to color in this figure legend, the reader is referred to the web version of this article.)
Fig. 11
Fig. 11
World map from our prediction system with marked growth values. Red color represents prediction of increasing trend, while green decreasing trend. The size of each circle represents the power of predicted change. The bigger the size the bigger growth predictor calculates. (For interpretation of the references to colour in this figure legend, the reader is referred to the web version of this article.)

References

    1. Bárcena M., Oostergetel G.T., Bartelink W., Faas F.G., Verkleij A., Rottier P.J. Cryo-electron tomography of mouse hepatitis virus: insights into the structure of the coronavirion. ProcNatl Acad Sci. 2009;106(2):582–587. - PMC - PubMed
    1. Zhou P., Yang X.-L., Wang X.-G., Hu B., Zhang L., Zhang W. A pneumonia outbreak associated with a new coronavirus of probable bat origin. Nature. 2020;579(7798):270–273. - PMC - PubMed
    1. Cascella M., Rajnik M., Cuomo A., Dulebohn S.C., Di Napoli R. Statpearls [internet] StatPearls Publishing; 2020. Features, evaluation and treatment coronavirus (COVID-19) - PubMed
    1. Li L.-Q., Huang T., Wang Y.-Q., Wang Z.-P., Liang Y., Huang T.-B. COVID-19 patients’ clinical characteristics, discharge rate, and fatality rate of meta-analysis. J Med Virol. 2020;92(6):577–583. - PMC - PubMed
    1. Ardabili S.F., Mosavi A., Ghamisi P., Ferdinand F., Varkonyi-Koczy A.R., Reuter U., et al. COVID-19 outbreak prediction with machine learning. Available at SSRN 35801882020;.

LinkOut - more resources