

Examining the association between socio-demographic composition and COVID-19 fatalities in the European region using spatial regression approach
- PMID: 32834939
- PMCID: PMC7395296
- DOI: 10.1016/j.scs.2020.102418
Examining the association between socio-demographic composition and COVID-19 fatalities in the European region using spatial regression approach
Abstract
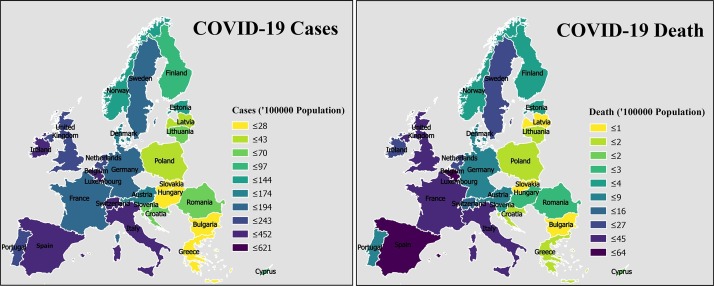
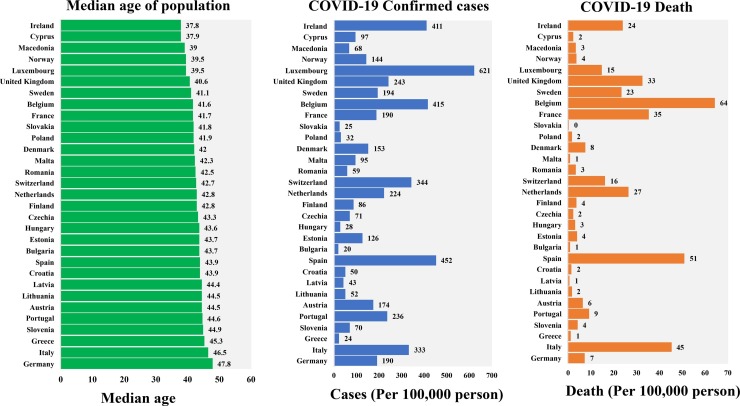
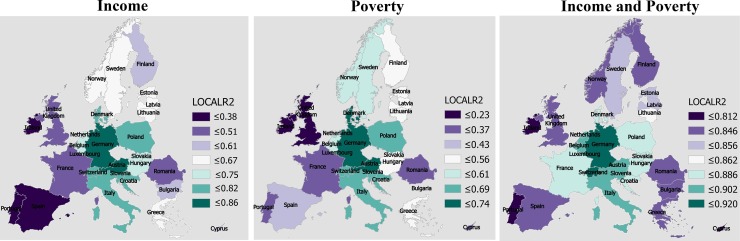
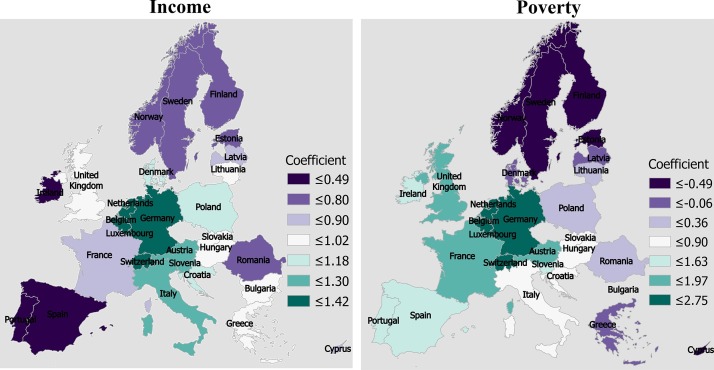
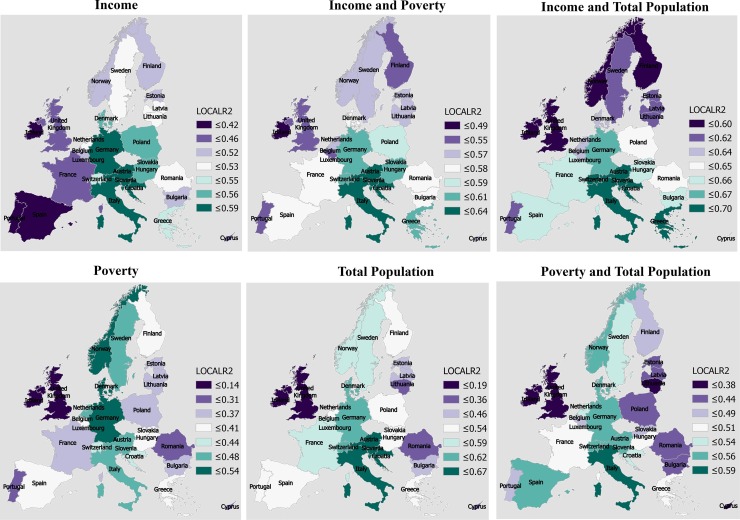
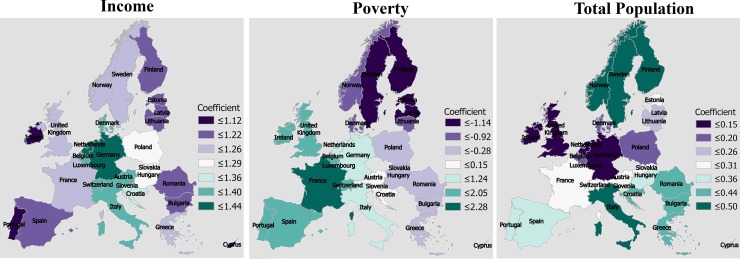
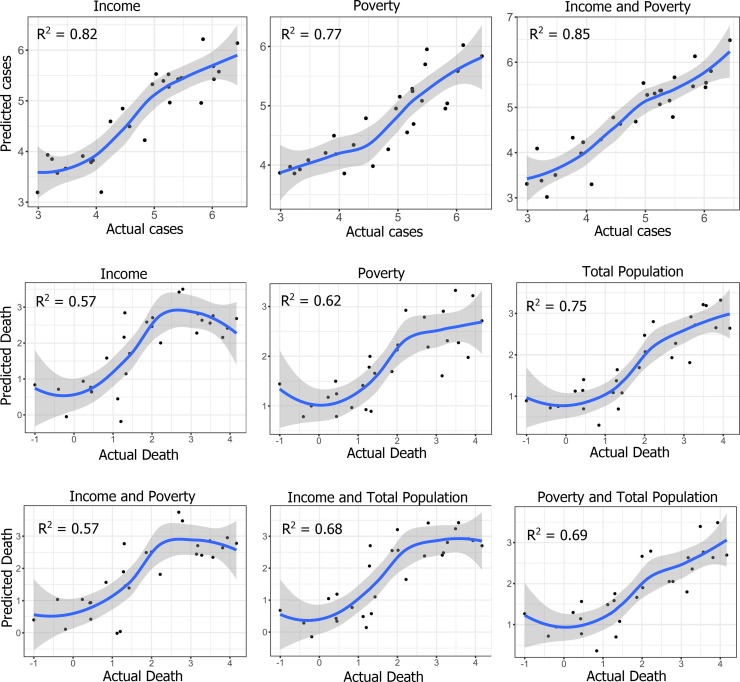
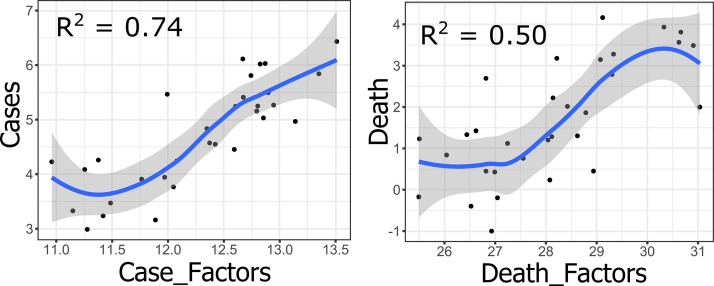
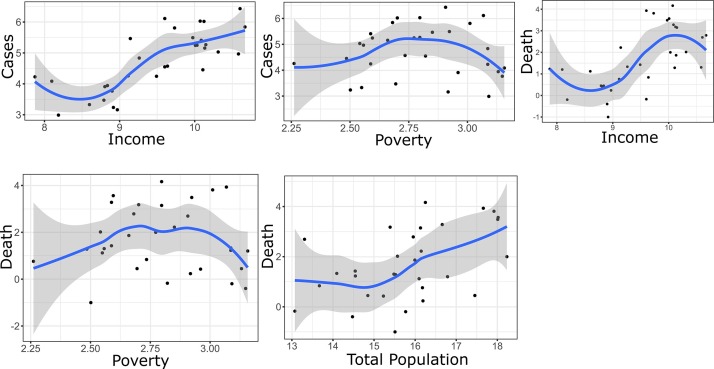
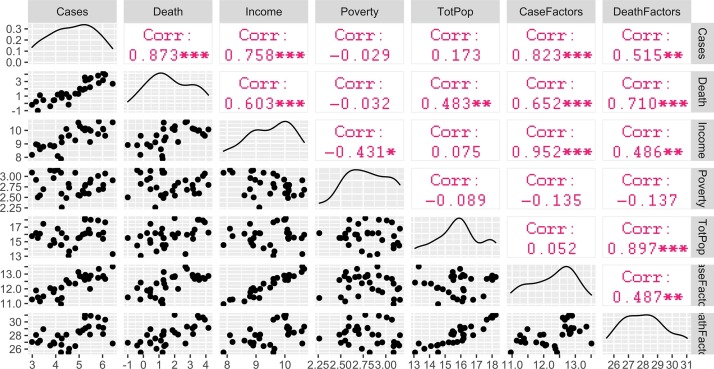
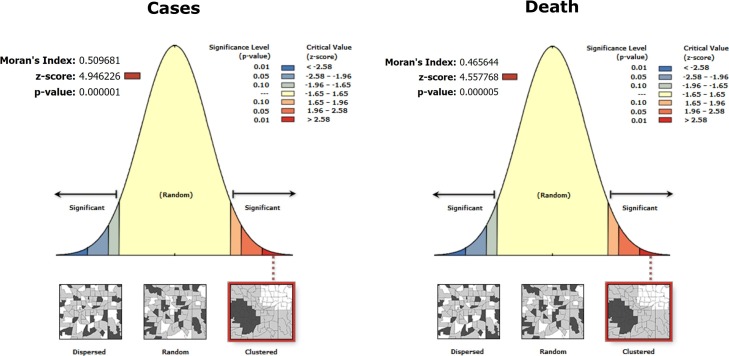
The socio-demographic factors have a substantial impact on the overall casualties caused by the Coronavirus (COVID-19). In this study, the global and local spatial association between the key socio-demographic variables and COVID-19 cases and deaths in the European regions were analyzed using the spatial regression models. A total of 31 European countries were selected for modelling and subsequent analysis. From the initial 28 socio-demographic variables, a total of 2 (for COVID-19 cases) and 3 (for COVID-19 deaths) key variables were filtered out for the regression modelling. The spatially explicit regression modelling and mapping were done using four spatial regression models such as Geographically Weighted Regression (GWR), Spatial Error Model (SEM), Spatial Lag Model (SLM), and Ordinary Least Square (OLS). Additionally, Partial Least Square (PLS) and Principal Component Regression (PCR) was performed to estimate the overall explanatory power of the regression models. For the COVID cases, the local R2 values, which suggesting the influences of the selected socio-demographic variables on COVID cases and death, were found highest in Germany, Austria, Slovenia, Switzerland, Italy. The moderate local R2 was observed for Luxembourg, Poland, Denmark, Croatia, Belgium, Slovakia. The lowest local R2 value for COVID-19 cases was accounted for Ireland, Portugal, United Kingdom, Spain, Cyprus, Romania. Among the 2 variables, the highest local R2 was calculated for income (R2 = 0.71), followed by poverty (R2 = 0.45). For the COVID deaths, the highest association was found in Italy, Croatia, Slovenia, Austria. The moderate association was documented for Hungary, Greece, Switzerland, Slovakia, and the lower association was found in the United Kingdom, Ireland, Netherlands, Cyprus. This suggests that the selected demographic and socio-economic components, including total population, poverty, income, are the key factors in regulating overall casualties of COVID-19 in the European region. In this study, the influence of the other controlling factors, such as environmental conditions, socio-ecological status, climatic extremity, etc. have not been considered. This could be the scope for future research.
Keywords: COVID-19; Demography; Outbreak; Pandemic; Spatial regression; Virus.
© 2020 The Author(s).
Conflict of interest statement
The authors whose names are listed in this manuscript certify that they have NO conflict of interest for subject matter or materials discussed in this manuscript.
Figures
References
-
- Anselin L. Spatial externalities, spatial multipliers and spatial econometrics. International Regional Science Review. 2003;26(2):153–166.
-
- Anselin L., Arribas-Bel D. Spatial fixed effects and spatial dependence in a single cross-section. Papers in Regional. 2013;92(1):3–17.
-
- Blyth M.J.G., Kincaid R., Craigen M.A.C., Bennet G.C. The changing epidemiology of acute and subacute haematogenous osteomyelitis in children. The Journal of Bone and Joint Surgery British Volume. 2001;83(1):99–102. - PubMed
LinkOut - more resources
Full Text Sources