. 2020 Jul 21;1(4):100059.
doi: 10.1016/j.xcrm.2020.100059.

Characterization and Treatment of SARS-CoV-2 in Nasal and Bronchial Human Airway Epithelia

Affiliations

Characterization and Treatment of SARS-CoV-2 in Nasal and Bronchial Human Airway Epithelia

Andrés Pizzorno et al. Cell Rep Med. .

Abstract

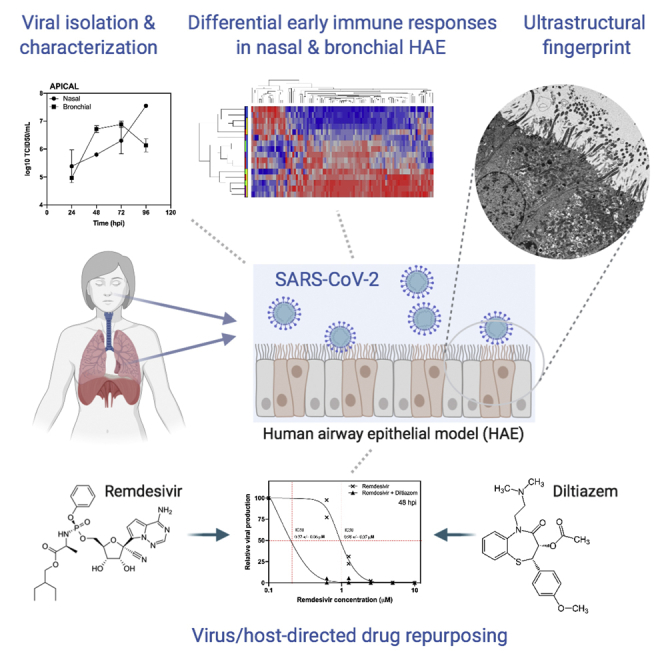
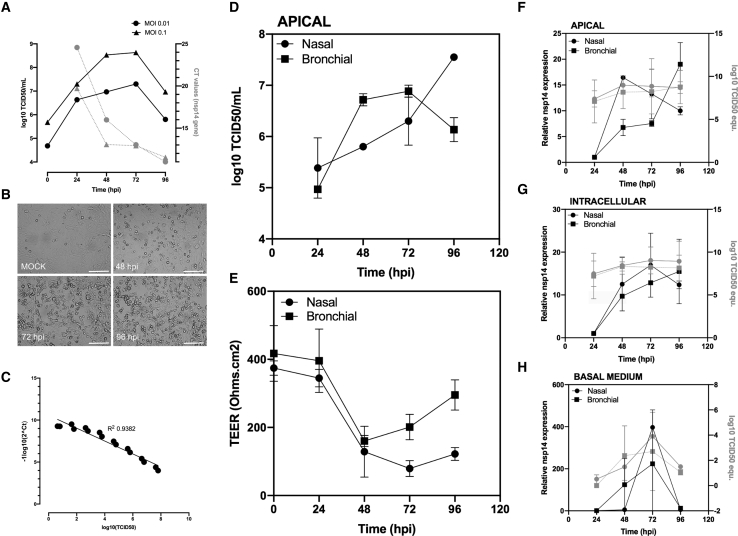
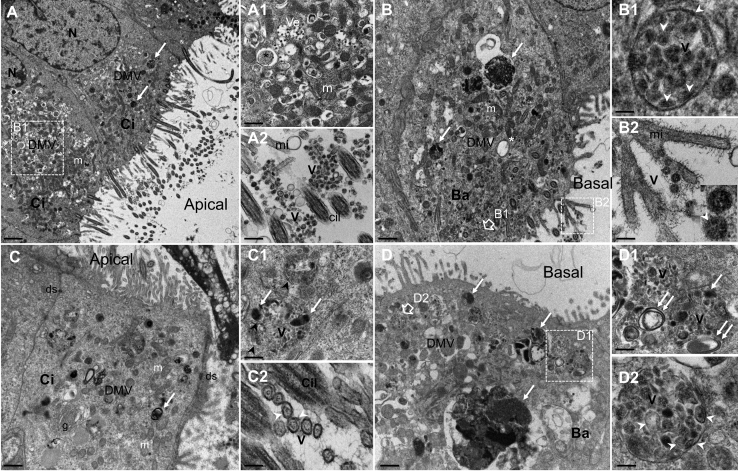
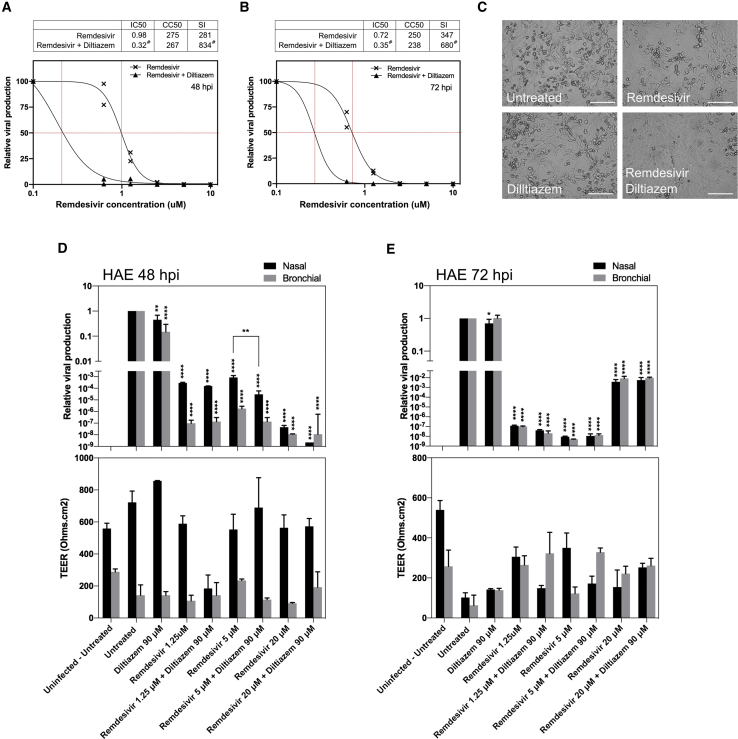
In the current COVID-19 pandemic context, proposing and validating effective treatments represents a major challenge. However, the scarcity of biologically relevant pre-clinical models of SARS-CoV-2 infection imposes a significant barrier for scientific and medical progress, including the rapid transition of potentially effective treatments to the clinical setting. We use reconstituted human airway epithelia to isolate and then characterize the viral infection kinetics, tissue-level remodeling of the cellular ultrastructure, and transcriptional early immune signatures induced by SARS-CoV-2 in a physiologically relevant model. Our results emphasize distinctive transcriptional immune signatures between nasal and bronchial HAE, both in terms of kinetics and intensity, hence suggesting putative intrinsic differences in the early response to SARS-CoV-2 infection. Most important, we provide evidence in human-derived tissues on the antiviral efficacy of remdesivir monotherapy and explore the potential of the remdesivir-diltiazem combination as an option worthy of further investigation to respond to the still-unmet COVID-19 medical need.

Keywords: COVID-19; SARS-CoV-2; cell ultrastructure remodeling; coronavirus; diltiazem; drug combination; innate immune response; remdesivir; repurposing.


Conflict of interest statement

A.P., B.P., T.J., A.T., O.T., and M.R.-C. are co-inventors of a patent application filed by INSERM, CNRS, Université Claude Bernard Lyon 1, and Signia Therapeutics for the repurposing of diltiazem for the treatment of SARS-CoV-2 infections (FR 20/02351). A.P., O.T., and M.R.-C. are co-founders of Signia Therapeutics SAS. S.C. is the founder of Epithelix, the developer and provider of MucilAir HAE. F.-X.L. has received funding for lectures from Gilead Sciences and Merck Sharp & Dohme France, and funding for travel to meetings from Merck Sharp & Dohme France, Astellas, and Eumedica. B.L. is the co-chair of the Global Influenza and RSV Initiative and the chair of the scientific committee of the Global Influenza Hospital Surveillance Network. B.L. received no personal remuneration for these activities. B.L. received travel grants to attend meetings by Abbott, Seegene, Sanofi, and bioMérieux. All of the other authors declare no competing interests.

Figures

None
Graphical abstract
Figure 1
Figure 1
Characterization of a SARS-CoV-2 Infection Model in Vero E6 Cells and in Nasal and Bronchial Reconstituted Human Airway Epithelia (HAE) (A) SARS-CoV-2 replication kinetics in Vero E6 cells. (B) Virus-induced cytopathic effects in Vero E6 cells (scale bar, 150 μM). (C) Correlation between viral quantification methods. (D) Apical viral production was assessed in washes of the apical pole at 24, 48, 72, and 96 hpi. Vero E6 cells were incubated with serial dilutions of the collected sample for the determination of viral titers (log10 TCID50/mL) at the indicated time points. (E) Trans-epithelial resistance (TEER in Ω/cm2) between the apical and basal poles was measured at each time point. (F–H) Relative viral genome quantification at the apical, intracellular, and basal compartments of the HAE was performed after viral or total RNA extraction and qRT-PCR. Results are expressed in fold change of nsp14 expression compared to 24 hpi and also as log10 TCID50 equivalent values. Presented data (means and SDs) from 3 independent experiments are shown.
Figure 2
Figure 2
Ultrastructure of SARS-CoV-2-Infected Nasal and Bronchial Reconstituted HAE MucilAir HAE were infected on the apical surface with SARS-CoV-2 (MOI 0.1). Forty-eight hours post-inoculation, HAE were fixed and processed for transmission electron microscopy analysis, as described in Method Details. (A and B) Section of apical ciliated (Ci) and basal (Ba) cells from nasal HAE showing numerous viral vesicles (DMVs) clustered in the perinuclear region in areas with mitochondria (m) and electron-dense accumulation of viral material (white arrow). Scale bars, 2 μm (A) and 1 μm (B). (A1) Enlargement of cytoplasmic area with smooth-walled secretory vesicles containing virions (Ve) and virus-induced DMVs (asterisk). Scale bar, 1 μm. (A2) Enlargement of ciliated cell surface showing virion clusters (V). Microvilli (mi) and transverse sections of cilia (Cil) are also observed. Scale bar, 0.05 μm. (B1) Enlargement of double-membraned spherules containing electron-dense material and pieces of double membranes interspaced among virions (V). Scale bar, 0.1 μm. (B2) Enlargement of and virons (V). The white arrows point to viral double membranes seen at high magnification (inset). Scale bar, 0.2 μm. (C and D) Section of Ci and Ba cells from bronchial HAE showing numerous viral vesicles (DMVs) clustered in the perinuclear region in areas with m and electron-dense accumulation of viral materials (white arrow). Scale bar, 1 μm. (C1) Enlargement of cytoplasmic area with spherules containing virions being formed (V), electron-dense accumulation of viral material (white arrow), and pieces of membranes (black arrowhead). Scale bar, 0.5 μm. (C2) High magnification of transverse section of virions (V) at the cell surface with Ci and mi. Their double membrane (white arrowhead) and spikes at their outer edge are visible. Scale bar, 0.1 μm. (D1) Section of Ba showing virus-induced DMVs, large electron-dense accumulation of viral materials (white arrow), and double-membrane vesicles containing virions near the plasmatic membrane. Scale bar, 1 μm. (E) Enlargements of the cytoplasmic area containing viral replication sites (double white arrows) and virions being formed (V). Scale bar, 0.1 μm. (D2) Enlargement of a double-membraned spherule containing virions (V), double-membrane vesicles, and electron-dense viral materials. Scale bar, 0.1 μm. N, nucleus; DMV, cytoplasmic double-membrane vesicles; m, mitochondria; and ds, desmosome. Representative micrographs are shown from 2 independent experiments. See also Figure S1.
Figure 3
Figure 3
Nasal and Bronchial Innate Immune Transcriptional Signature during the Time Course of SARS-CoV-2 Infection Differential expression of both immune response (96 genes) and type III IFNs (12 genes) panels was evaluated in infected nasal and bronchial HAE using the Nanostring technology at the indicated time points. Data processing and normalization were performed with nSolver analysis software (version 4.0, NanoString Technologies), and the results are expressed in fold change induction compared to the mock condition. (A) Heatmap and hierarchical clustering of differentially expressed genes compared to the mock-infected condition. (B) Principal-component analysis (PCA). (C) mRNA expression ratio of selected genes compared to the mock infected condition. Data from 2 independent experiments are shown.
Figure 4
Figure 4
Evaluation of Antiviral Activity of Remdesivir-Diltiazem in Vero E6 Cells and in HAE (A and B) Dose-response curves of remdesivir and remdesivir-diltiazem combination (11.5 μM fixed diltiazem concentration) at 48 hpi (A) and 72 hpi (B) in Vero E6 cells. #Estimated IC50 and SI values. (C) Effect of antiviral treatment on virally induced cytopathic effects in Vero E6 cells (scale bar, 150 μM). (D and E) Relative intracellular viral genome quantification and trans-epithelial resistance (TEER in Ω/cm2) between the apical and basal poles in nasal and bronchial HAE at (D) 48 and (E) 72 hpi. Results are expressed in relative viral production compared to the infected untreated control and relative TEER compared to t = 0 (before infection). Data (means ± SDs) from 3 independent experiments are shown. Statistical significance was calculated by 1-way ANOVA; ∗p < 0.05, ∗∗p < 0.01, and ∗∗∗∗p < 0.0001 versus untreated group. See also Figure S2.

References

    1. Hui D.S., I Azhar E., Madani T.A., Ntoumi F., Kock R., Dar O., Ippolito G., Mchugh T.D., Memish Z.A., Drosten C. The continuing 2019-nCoV epidemic threat of novel coronaviruses to global health - The latest 2019 novel coronavirus outbreak in Wuhan, China. Int. J. Infect. Dis. 2020;91:264–266. - PMC - PubMed
    1. World Health Organization . 2020. WHO Director-General’s opening remarks at the media briefing on COVID-19 - 11 March 2020.https://www.who.int/dg/speeches/detail/who-director-general-s-opening-re...
    1. World Health Organization . 2020. Novel Coronavirus (2019-nCoV) Situation Report - 3, 23 January 2020.https://www.who.int/docs/default-source/coronaviruse/situation-reports/2...
    1. Lu R., Zhao X., Li J., Niu P., Yang B., Wu H., Wang W., Song H., Huang B., Zhu N. Genomic characterisation and epidemiology of 2019 novel coronavirus: implications for virus origins and receptor binding. Lancet. 2020;395:565–574. - PMC - PubMed
    1. Cascella M., Rajnik M., Cuomo A., Dulebohn S.C., Di Napoli R. 2020. Features, Evaluation and Treatment Coronavirus (COVID-19)https://www.ncbi.nlm.nih.gov/books/NBK554776/ - PubMed

Publication types

MeSH terms