. 2020 Dec;9(1):484-494.
doi: 10.1080/21623945.2020.1807850.

The diabetes medication canagliflozin promotes mitochondrial remodelling of adipocyte via the AMPK-Sirt1-Pgc-1α signalling pathway

Affiliations

The diabetes medication canagliflozin promotes mitochondrial remodelling of adipocyte via the AMPK-Sirt1-Pgc-1α signalling pathway

Xuping Yang et al. Adipocyte. 2020 Dec.

Abstract

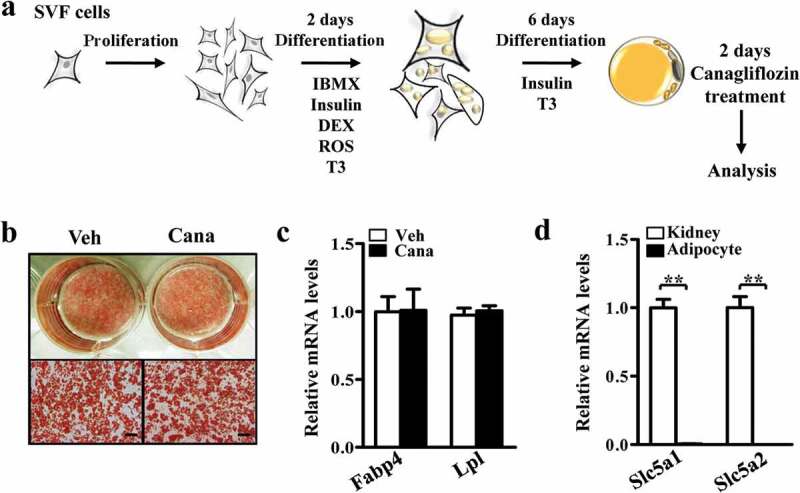
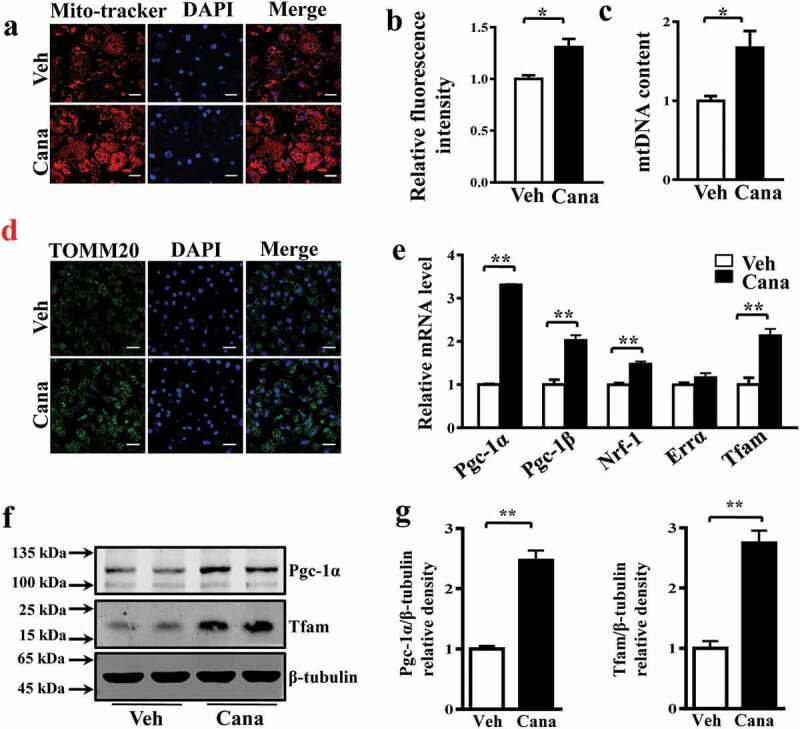
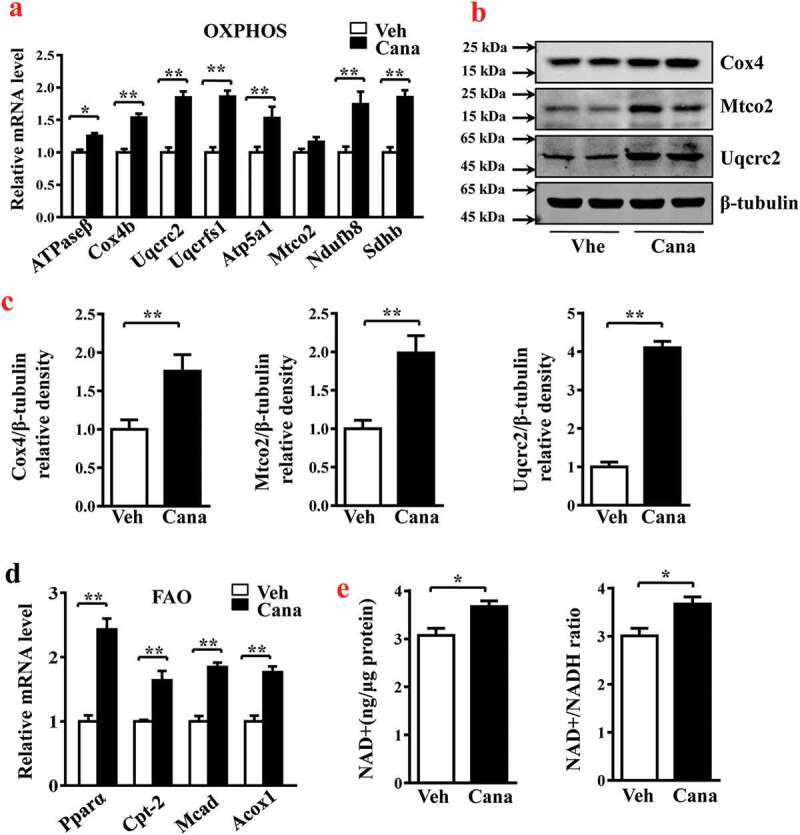
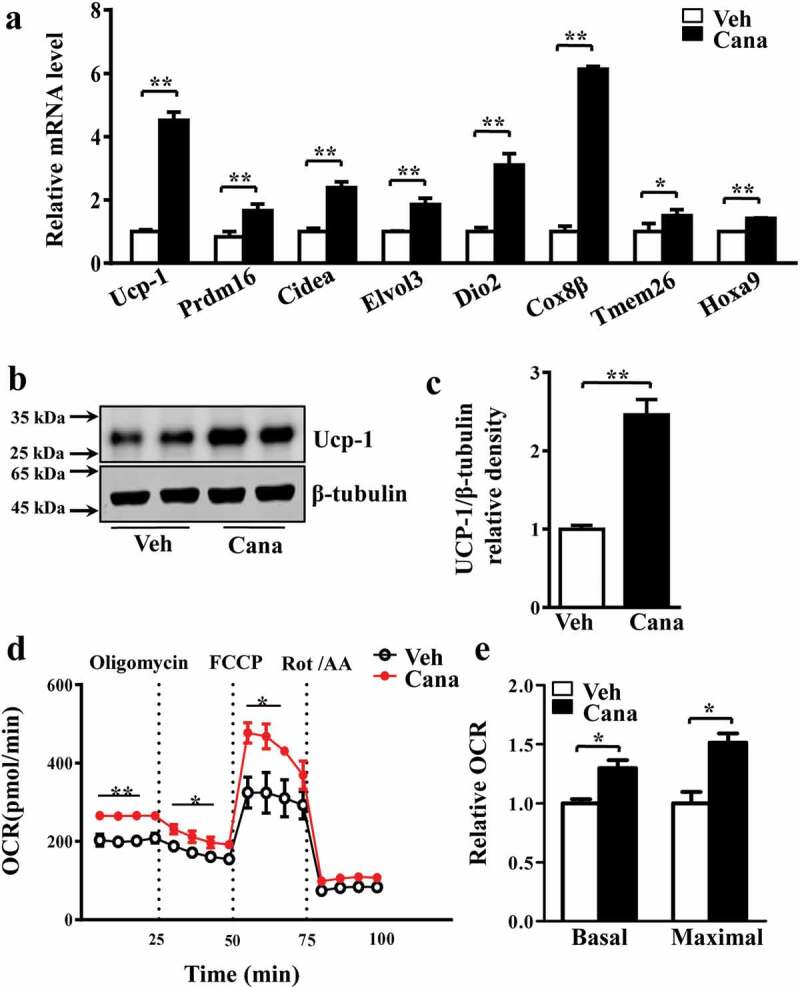
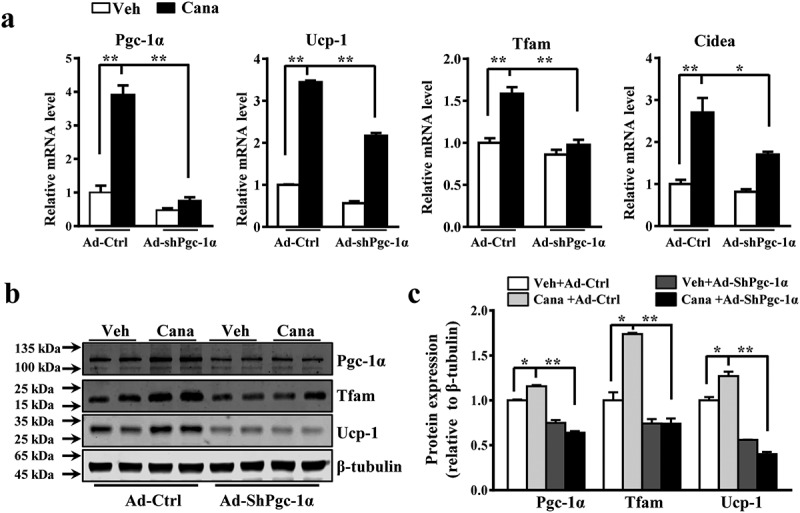
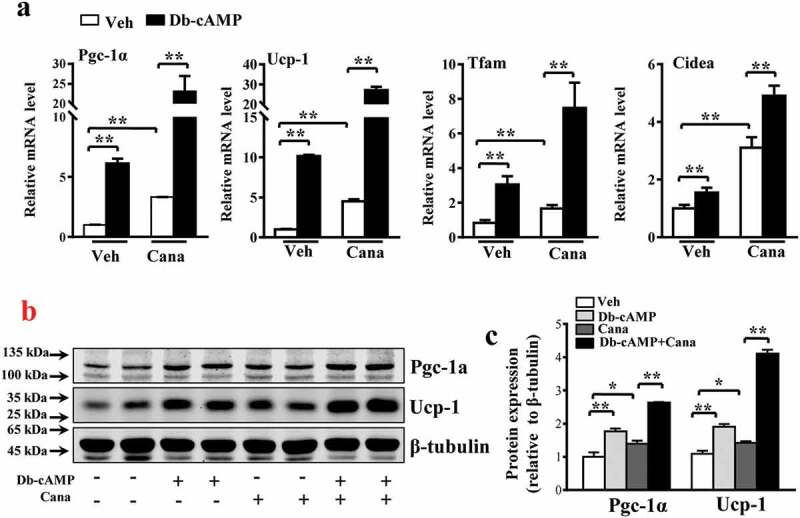
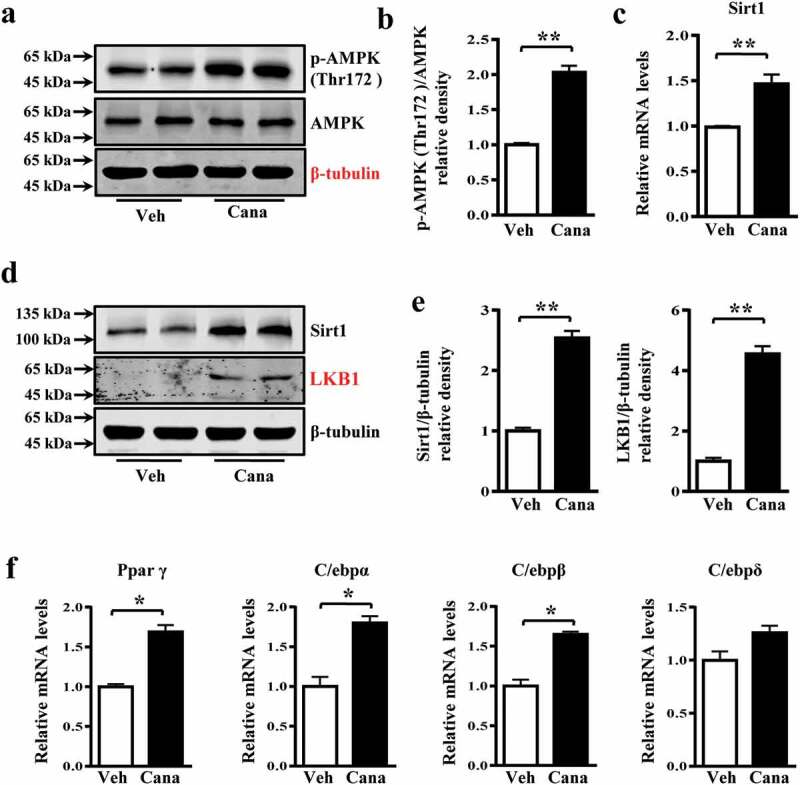
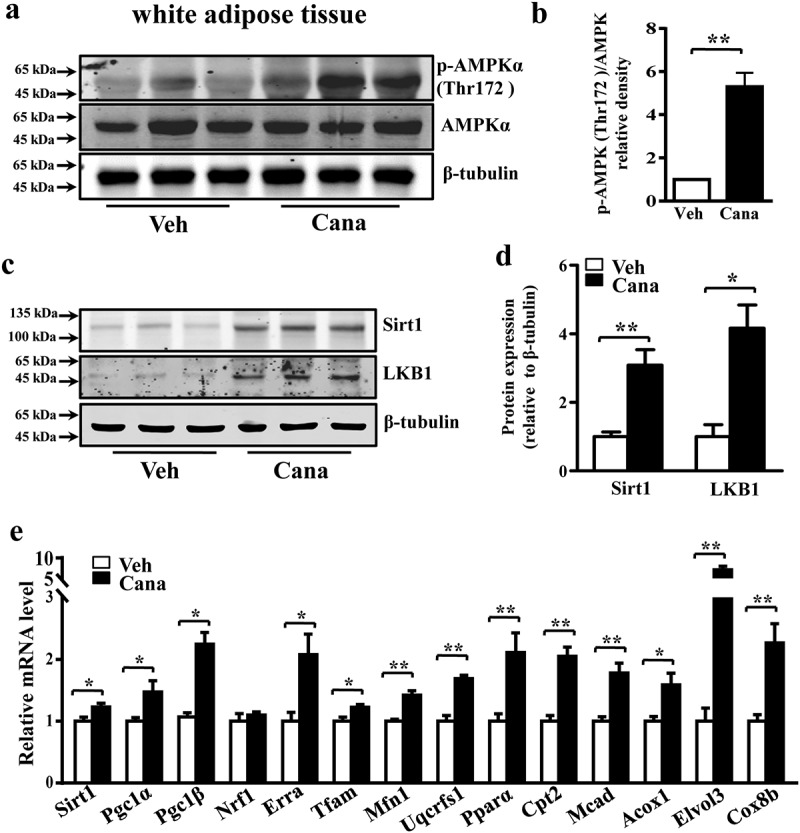
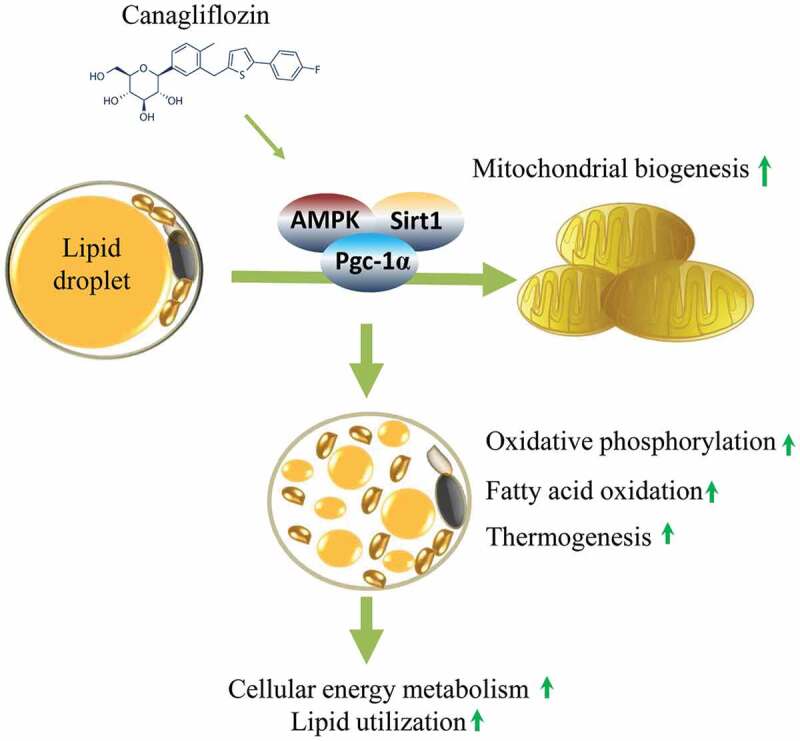
The diabetes medication canagliflozin (Cana) is a sodium glucose cotransporter 2 (SGLT2) inhibitor acting by increasing urinary glucose excretion and thus reducing hyperglycaemia. Cana treatment also reduces body weight. However, it remains unclear whether Cana could directly work on adipose tissue. In the present study, the pharmacological effects of Cana and the associated mechanism were investigated in adipocytes and mice. Stromal-vascular fractions (SVFs) were isolated from subcutaneous adipose tissue and differentiated into mature adipocytes. Our results show that Cana treatment directly increased cellular energy expenditure of adipocytes by inducing mitochondrial biogenesis independently of SGLT2 inhibition. Along with mitochondrial biogenesis, Cana also increased mitochondrial oxidative phosphorylation, fatty acid oxidation and thermogenesis. Mechanistically, Cana promoted mitochondrial biogenesis and function via an Adenosine monophosphate-activated protein kinase (AMPK) - silent information regulator 1 (Sirt1) - peroxisome proliferator-activated receptor γ coactivator-1α (Pgc-1α) signalling pathway. Consistently, in vivo study demonstrated that Cana increased AMPK phosphorylation and the expression of Sirt1 and Pgc-1α. The present study reveals a new therapeutic function for Cana in regulating energy homoeostasis.

Abbreviations: Ucp-1, uncoupling protein 1; cAMP, cyclic adenosine monophosphate; PKA, cAMP-dependent protein kinase A; SGLT, sodium glucose cotransporter; Cana, canagliflozin; T2DM: type 2 diabetes; Veh, vehicle; Pgc-1α, peroxisome proliferator-activated receptor γ coactivator-1α; SVFs, stromal-vascular fractions; FBS, bovine serum; Ad, adenovirus; mtDNA, mitochondrial DNA; COX2, cytochrome oxidase subunit 2; RT-PCR, real-time PCR; SDS-PAGE, sodium dodecyl sulphate-polyacrylamide gel electrophoresis; Prdm16, PR domain zinc finger protein 16; Cidea, cell death inducing DFFA-like effector A; Pgc-1β, peroxisome proliferator-activated receptor γ coactivator-1β; NRF1, nuclear respiratory factor 1; Tfam, mitochondrial transcription factor A; OXPHOS, oxidative phosphorylation; FAO, fatty acid oxidation; AMPK, Adenosine monophosphate-activated protein kinase; p-AMPK, phosphorylated AMPK; Sirt1, silent information regulator 1; mTOR, mammalian target of rapamycin; WAT, white adipose tissue; Fabp4, fatty acid binding protein 4; Lpl, lipoprotein lipase; Slc5a2, solute carrier family 5 member 2; ERRα, oestrogen related receptor α; Uqcrc2, ubiquinol-cytochrome c reductase core protein 2; Uqcrfs1, ubiquinol-cytochrome c reductase, Rieske iron-sulphur polypeptide 1; Cox4, cytochrome c oxidase subunit 4; Pparα, peroxisome proliferator activated receptor α; NAD+, nicotinamide adenine dinucleotide; Dio2, iodothyronine deiodinase 2; Tmem26, transmembrane protein 26; Hoxa9, homeobox A9; FCCP, carbonyl cyanide 4-(trifluoromethoxy) phenylhydrazone; Rot/AA, rotenone/antimycin A; OCR, oxygen consumption rate; Pparγ, peroxisome proliferator activated receptor γ; C/ebp, CCAAT/enhancer binding protein; LKB1, liver kinase B1; AUC, area under the cure; Vd, apparent volume of distribution.

Keywords: Canagliflozin; Pgc-1α; adipocytes; energy homoeostasis; mitochondrial biogenesis.


Conflict of interest statement

The authors have declared that no competing interest exists.

Figures

Figure 1.
Figure 1.
Isolation and differentiation of primary adipocyte. Differentiated primary adipocytes were treated with Canagliflozin (Cana) 10 μM or vehicle for 48 h. (a) Flow chart of isolation and differentiation of primary adipocyte. (b) Oil red staining of differentiated adipocytes. Scale bar, 50 μm. All representative images were repeated in at least three independent experiments. (c) Fabp4 and Lpl mRNA levels in differentiated adipocytes. (d) Slc5a1 and Slc5a2 mRNA levels in kidney from C57BL/6 J male mice and differentiated adipocytes. All group data subjected to statistical analysis were repeated in at least three independent experiments, each in duplicate or triplicate. Data are presented as mean ± SEM and *p < 0.05, **p < 0.01 compared to control group. IBMX, isobutyl-methylxanthine, DEX, dexamethasone; ROS, rosiglitazone
Figure 2.
Figure 2.
Cana directly promotes mitochondrial biogenesis. Differentiated primary adipocytes were treated with Canagliflozin (Cana) 10 μM or vehicle for 48 h. (a) Mitochondrial staining of differentiated adipocytes. Scale bar, 10 μm. (b) Relative fluorescence intensity of Mitochondrial staining in (a). (c) Relative mtDNA content of differentiated adipocytes. (d) Representative images of TOMM20 immunofluorescence (in green) on differentiated adipocytes. Nuclei were stained with DAPI (in blue). Scale bars, 25 μm. (e) mRNA levels of gene involved in mitochondrial biogenesis in differentiated adipocytes. (f, g) Protein levels of Pgc-1α and Tfam in differentiated adipocytes. The relative average protein level was determined by densitometry and normalized with β-tubulin. All group data subjected to statistical analysis were repeated in at least three independent experiments, each in duplicate or triplicate. Data are presented as mean ± SEM and *p < 0.05, **p < 0.01 compared to control group
Figure 3.
Figure 3.
Cana directly promotes mitochondrial OXPHOS and FAO. Differentiated primary adipocytes were treated with Canagliflozin (Cana) 10 μM or vehicle for 48 h. (a) mRNA levels of gene involved in mitochondrial OXPHOS in differentiated adipocytes. (b-c) Protein levels of Cox4, Mtco2 and Uqcrc2 in differentiated adipocytes. The relative average protein level was determined by densitometry and normalized with β-tubulin. (d) mRNA levels of gene involved in mitochondrial FAO in differentiated adipocytes. (e) Intracellular NAD+ level and NAD+/NADH ratio in differentiated adipocytes. All group data subjected to statistical analysis were repeated in at least three independent experiments, each in duplicate or triplicate. Data are presented as mean ± SEM and *p < 0.05, **p < 0.01 compared to control group
Figure 4.
Figure 4.
Cana directly promotes thermogenesis and energy metabolism. Differentiated primary adipocytes were treated with Canagliflozin (Cana) 10 μM or vehicle for 48 h. (a) mRNA levels of gene involved in thermogenesis in differentiated adipocytes. (b-c) Protein levels of Ucp-1 in differentiated adipocytes. The relative average protein level was determined by densitometry and normalized with β-tubulin. (d) Oxygen consumption rate (OCR) in differentiated adipocytes in basal conditions, in the presence of 1 μM oligomycin, 0.5 μM FCCP, or 0.5 μM rotenone/antimycin A. (e) Relative OCR in (d). All group data subjected to statistical analysis were repeated in at least three independent experiments, each in duplicate or triplicate. Data are presented as mean ± SEM and *p < 0.05, **p < 0.01 compared to control group
Figure 5.
Figure 5.
Pgc-1a knockdown abolishes the effects of Cana on primary adipocyte. Differentiated primary adipocytes were treated with Canagliflozin (Cana) 10 μM or vehicle for 48 h. (a) mRNA levels of Pgc-1α, Ucp-1, Tfam and Cidea in control and in Pgc-1α knockdown (Ad-shPgc-1α) differentiated primary adipocyte. (b-c) Protein levels of Pgc-1α, Ucp-1 and Tfam in control and in Pgc-1α knockdown (Ad-shPgc-1α) differentiated primary adipocyte. The relative average protein level was determined by densitometry and normalized with β-tubulin. All group data subjected to statistical analysis were repeated in at least three independent experiments, each in duplicate or triplicate. Data are presented as mean ± SEM and *p < 0.05, **p < 0.01 compared to control group
Figure 6.
Figure 6.
Cana enlarges the effects of Db-cAMP on differentiated primary adipocyte. Differentiated primary adipocyte preincubated with Cana 10 μM or vehicle for 48 h, then stimulated with Db-cAMP 10 μM for 4 h. (a) mRNA levels of Pgc-1α, Ucp-1, Tfam and Cidea. (b-c) Protein levels of Pgc-1α and Ucp-1. The relative average protein level was determined by densitometry and normalized with β-tubulin. All group data subjected to statistical analysis were repeated in at least three independent experiments, each in duplicate or triplicate. Data are presented as mean ± SEM and *p < 0.05, **p < 0.01 compared to control group
Figure 7.
Figure 7.
Cana induces Sirt1 expression and promotes AMPK activation. Differentiated primary adipocytes were treated with Canagliflozin (Cana) 10 μM or vehicle for 48 h. (a-b) Protein levels of AMPK and phosphorylation levels of AMPK (p-AMPK) at Thr 172 site in differentiated adipocytes. The relative average phosphorylation levels of AMPK determined by densitometry and normalized with AMPK. (c) mRNA levels of Sirt1 in differentiated adipocytes. (d-e) Protein levels of Sirt1 and LKB1 in differentiated adipocytes. The relative average protein level was determined by densitometry and normalized with β-tubulin. (f) mRNA levels of Ppar γ, C/ebpα, C/ebpβ and C/ebpδ in differentiated adipocytes. All group data subjected to statistical analysis were repeated in at least three independent experiments, each in duplicate or triplicate. Data are presented as mean ± SEM and *p < 0.05, **p < 0.01 compared to control group
Figure 8.
Figure 8.
Cana promotes AMPK activation in vivo. Mice were treated with Canagliflozin (Cana) or vehicle for 8 weeks. (a-b) Protein levels of AMPK and phosphorylation levels of AMPK (p-AMPK) at Thr172 site in subcutaneous adipose tissue. The relative average phosphorylation levels of AMPK determined by densitometry and normalized with AMPK. (c-d) Protein levels of Sirt1 and LKB1 in differentiated adipocytes. The relative average protein level was determined by densitometry and normalized with β-tubulin. (e) mRNA levels of gene involved in mitochondrial remodelling of subcutaneous adipose tissue (n = 6). All group data subjected to statistical analysis were repeated in at least three independent experiments. Data are presented as mean ± SEM and *p < 0.05, **p < 0.01 compared to control group
None

Similar articles

Cited by

References

    1. Wai T, Langer T.. Mitochondrial dynamics and metabolic regulation. Trends Endocrinol Metab. 2016;27(2):105–117. - PubMed
    1. Deveaud C, Beauvoit B, Salin B, et al. Regional differences in oxidative capacity of rat white adipose tissue are linked to the mitochondrial content of mature adipocytes. Mol Cell Biochem. 2004;267:157–166. - PubMed
    1. Rosen ED, Spiegelman BM. Adipocytes as regulators of energy balance and glucose homeostasis. Nature. 2006;444:847–853. - PMC - PubMed
    1. Patti ME, Corvera S. The role of mitochondria in the pathogenesis of type 2 diabetes. Endocr Rev. 2010;31:364–395. - PMC - PubMed
    1. Wu Z, Puigserver P, Andersson U, et al. Mechanisms controlling mitochondrial biogenesis and respiration through the thermogenic coactivator PGC-1. Cell. 1999;98:115–124. - PubMed

MeSH terms

Substances