. 2020 Dec;159(6):2116-2129.e4.
doi: 10.1053/j.gastro.2020.08.027. Epub 2020 Aug 21.

Single-Cell Transcriptional Analyses Identify Lineage-Specific Epithelial Responses to Inflammation and Metaplastic Development in the Gastric Corpus

Affiliations

Single-Cell Transcriptional Analyses Identify Lineage-Specific Epithelial Responses to Inflammation and Metaplastic Development in the Gastric Corpus

Kevin A Bockerstett et al. Gastroenterology. 2020 Dec.

Abstract

Background & aims: Chronic atrophic gastritis can lead to gastric metaplasia and increase risk of gastric adenocarcinoma. Metaplasia is a precancerous lesion associated with an increased risk for carcinogenesis, but the mechanism(s) by which inflammation induces metaplasia are poorly understood. We investigated transcriptional programs in mucous neck cells and chief cells as they progress to metaplasia mice with chronic gastritis.

Methods: We analyzed previously generated single-cell RNA-sequencing (scRNA-seq) data of gastric corpus epithelium to define transcriptomes of individual epithelial cells from healthy BALB/c mice (controls) and TxA23 mice, which have chronically inflamed stomachs with metaplasia. Chronic gastritis was induced in B6 mice by Helicobacter pylori infection. Gastric tissues from mice and human patients were analyzed by immunofluorescence to verify findings at the protein level. Pseudotime trajectory analysis of scRNA-seq data was used to predict differentiation of normal gastric epithelium to metaplastic epithelium in chronically inflamed stomachs.

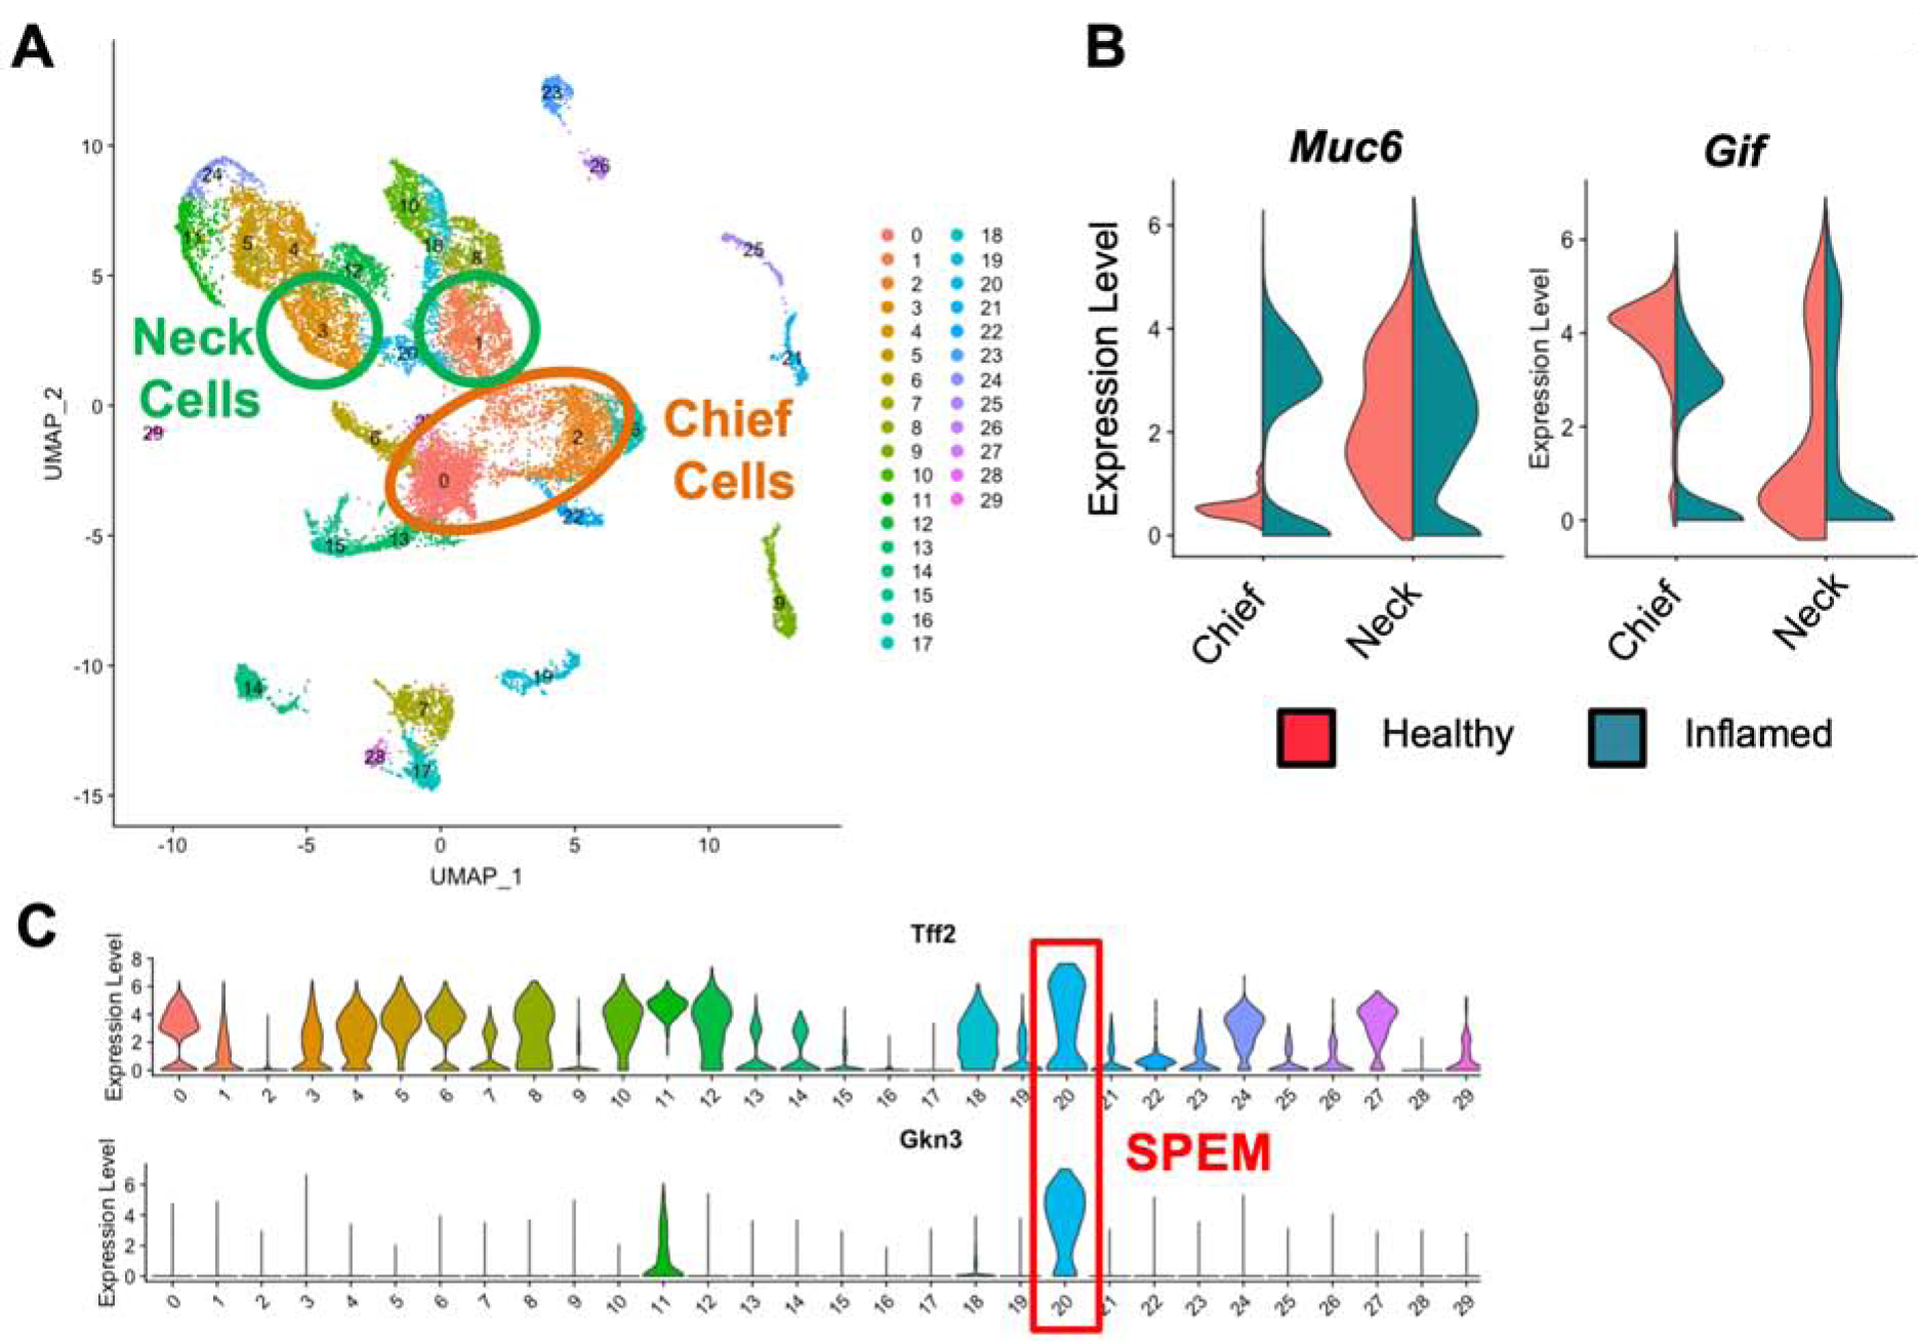
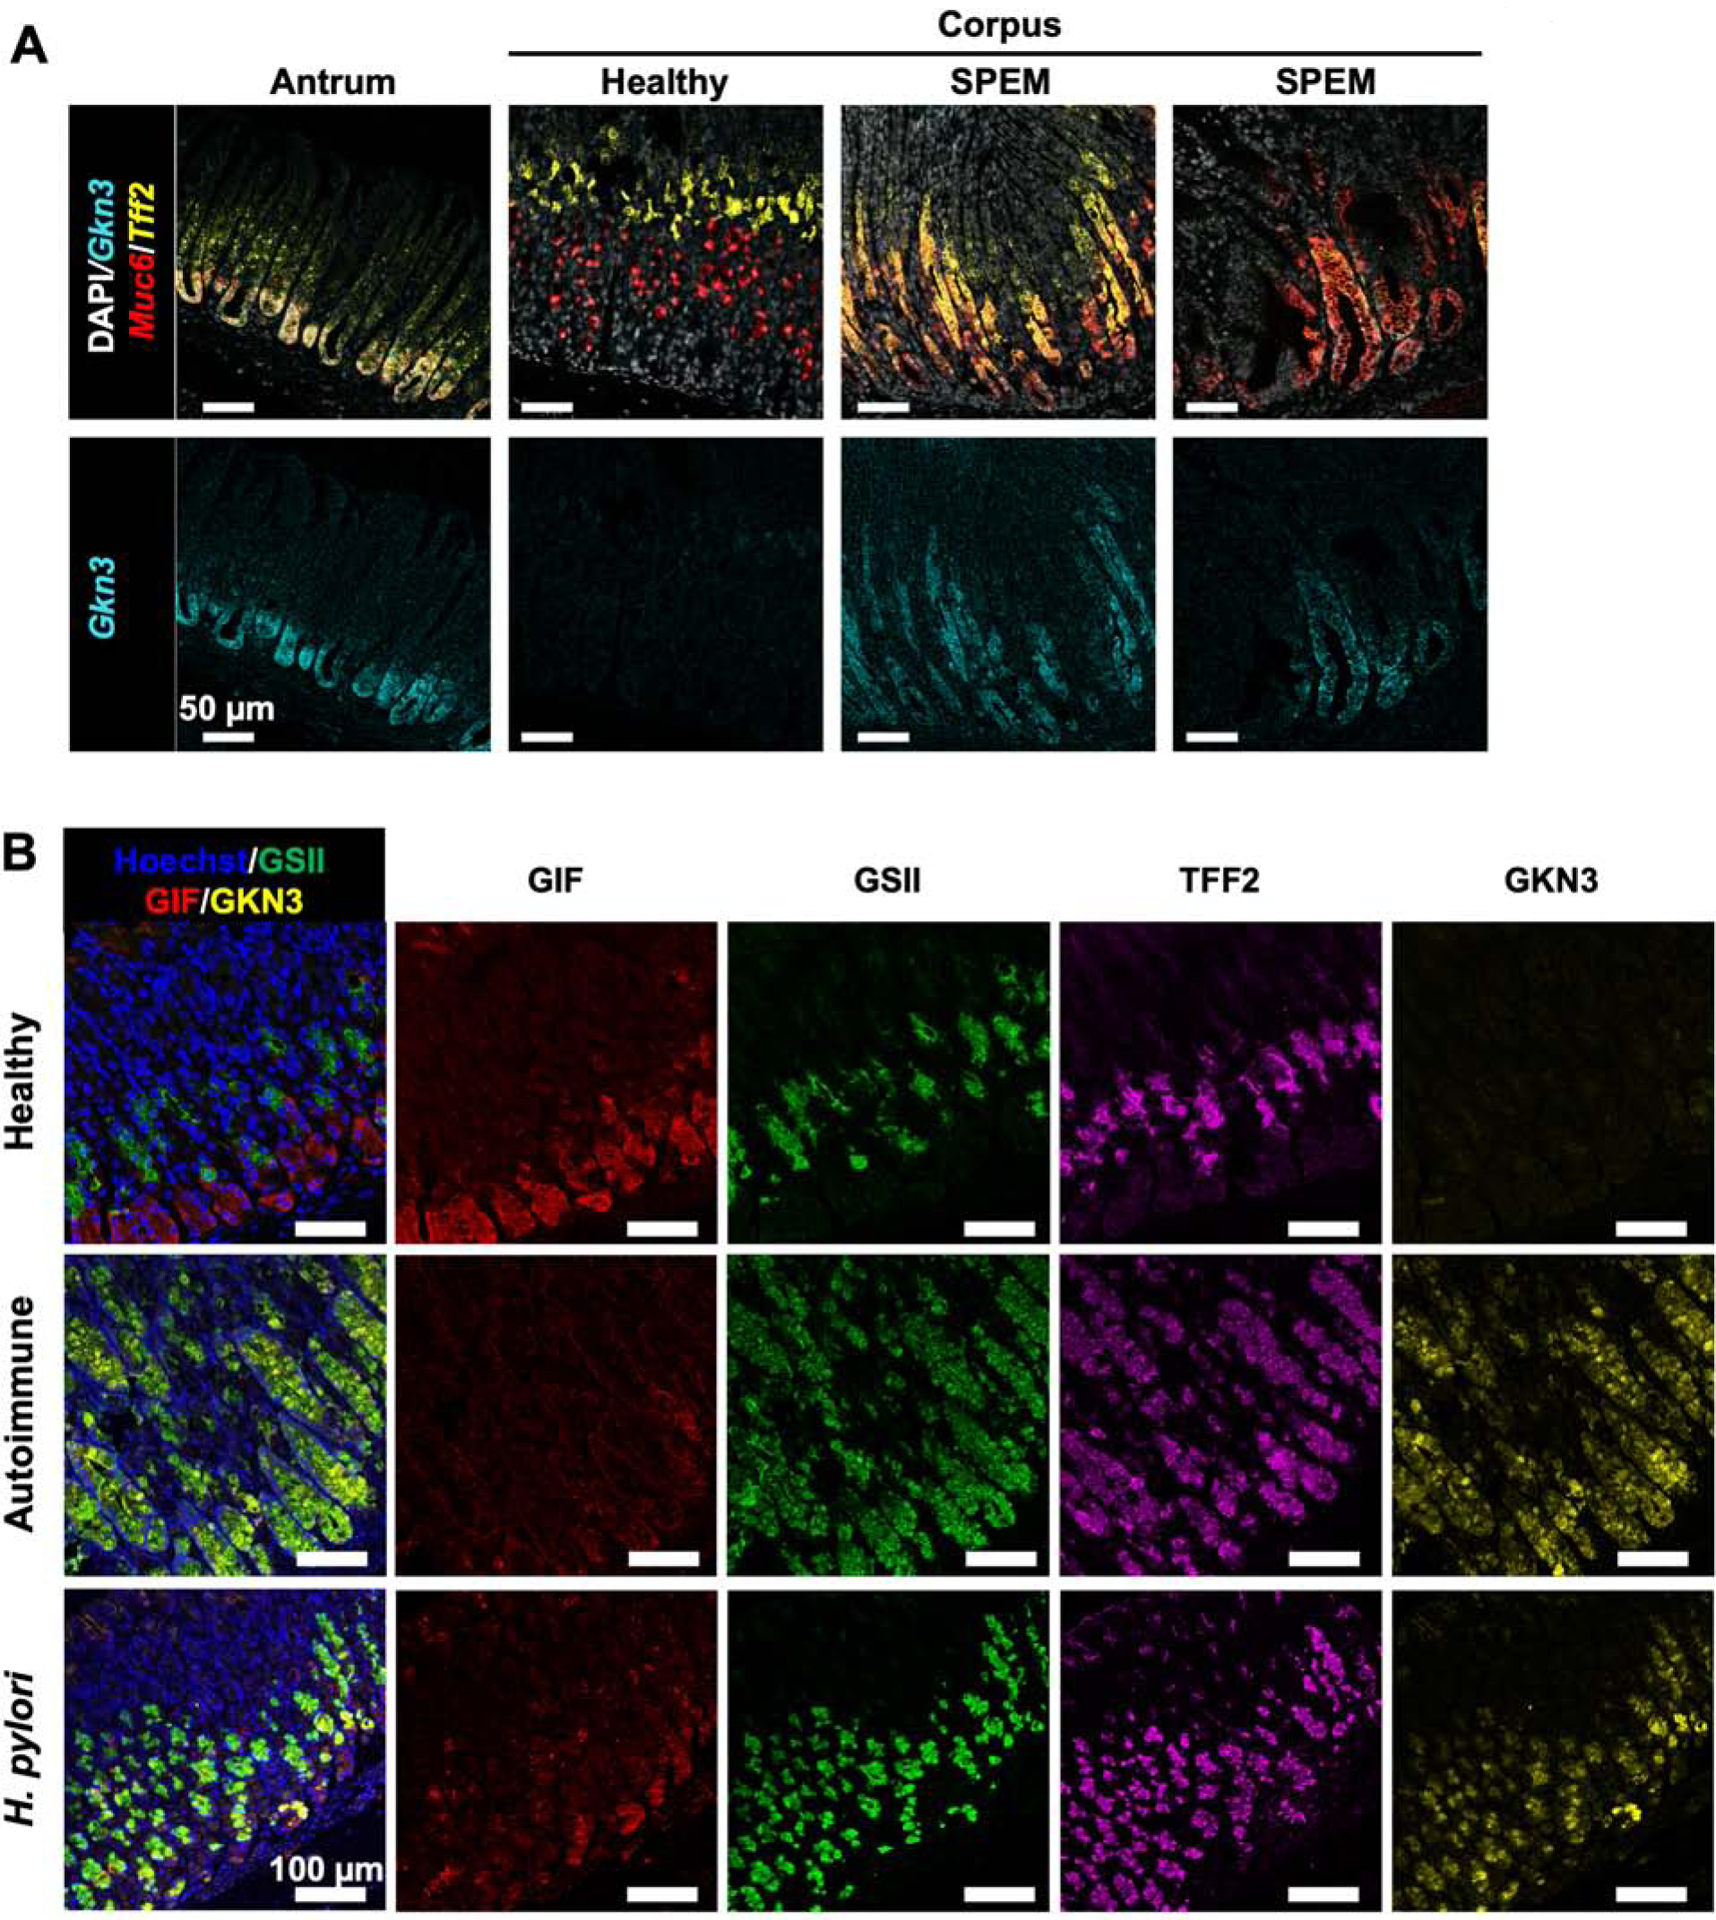
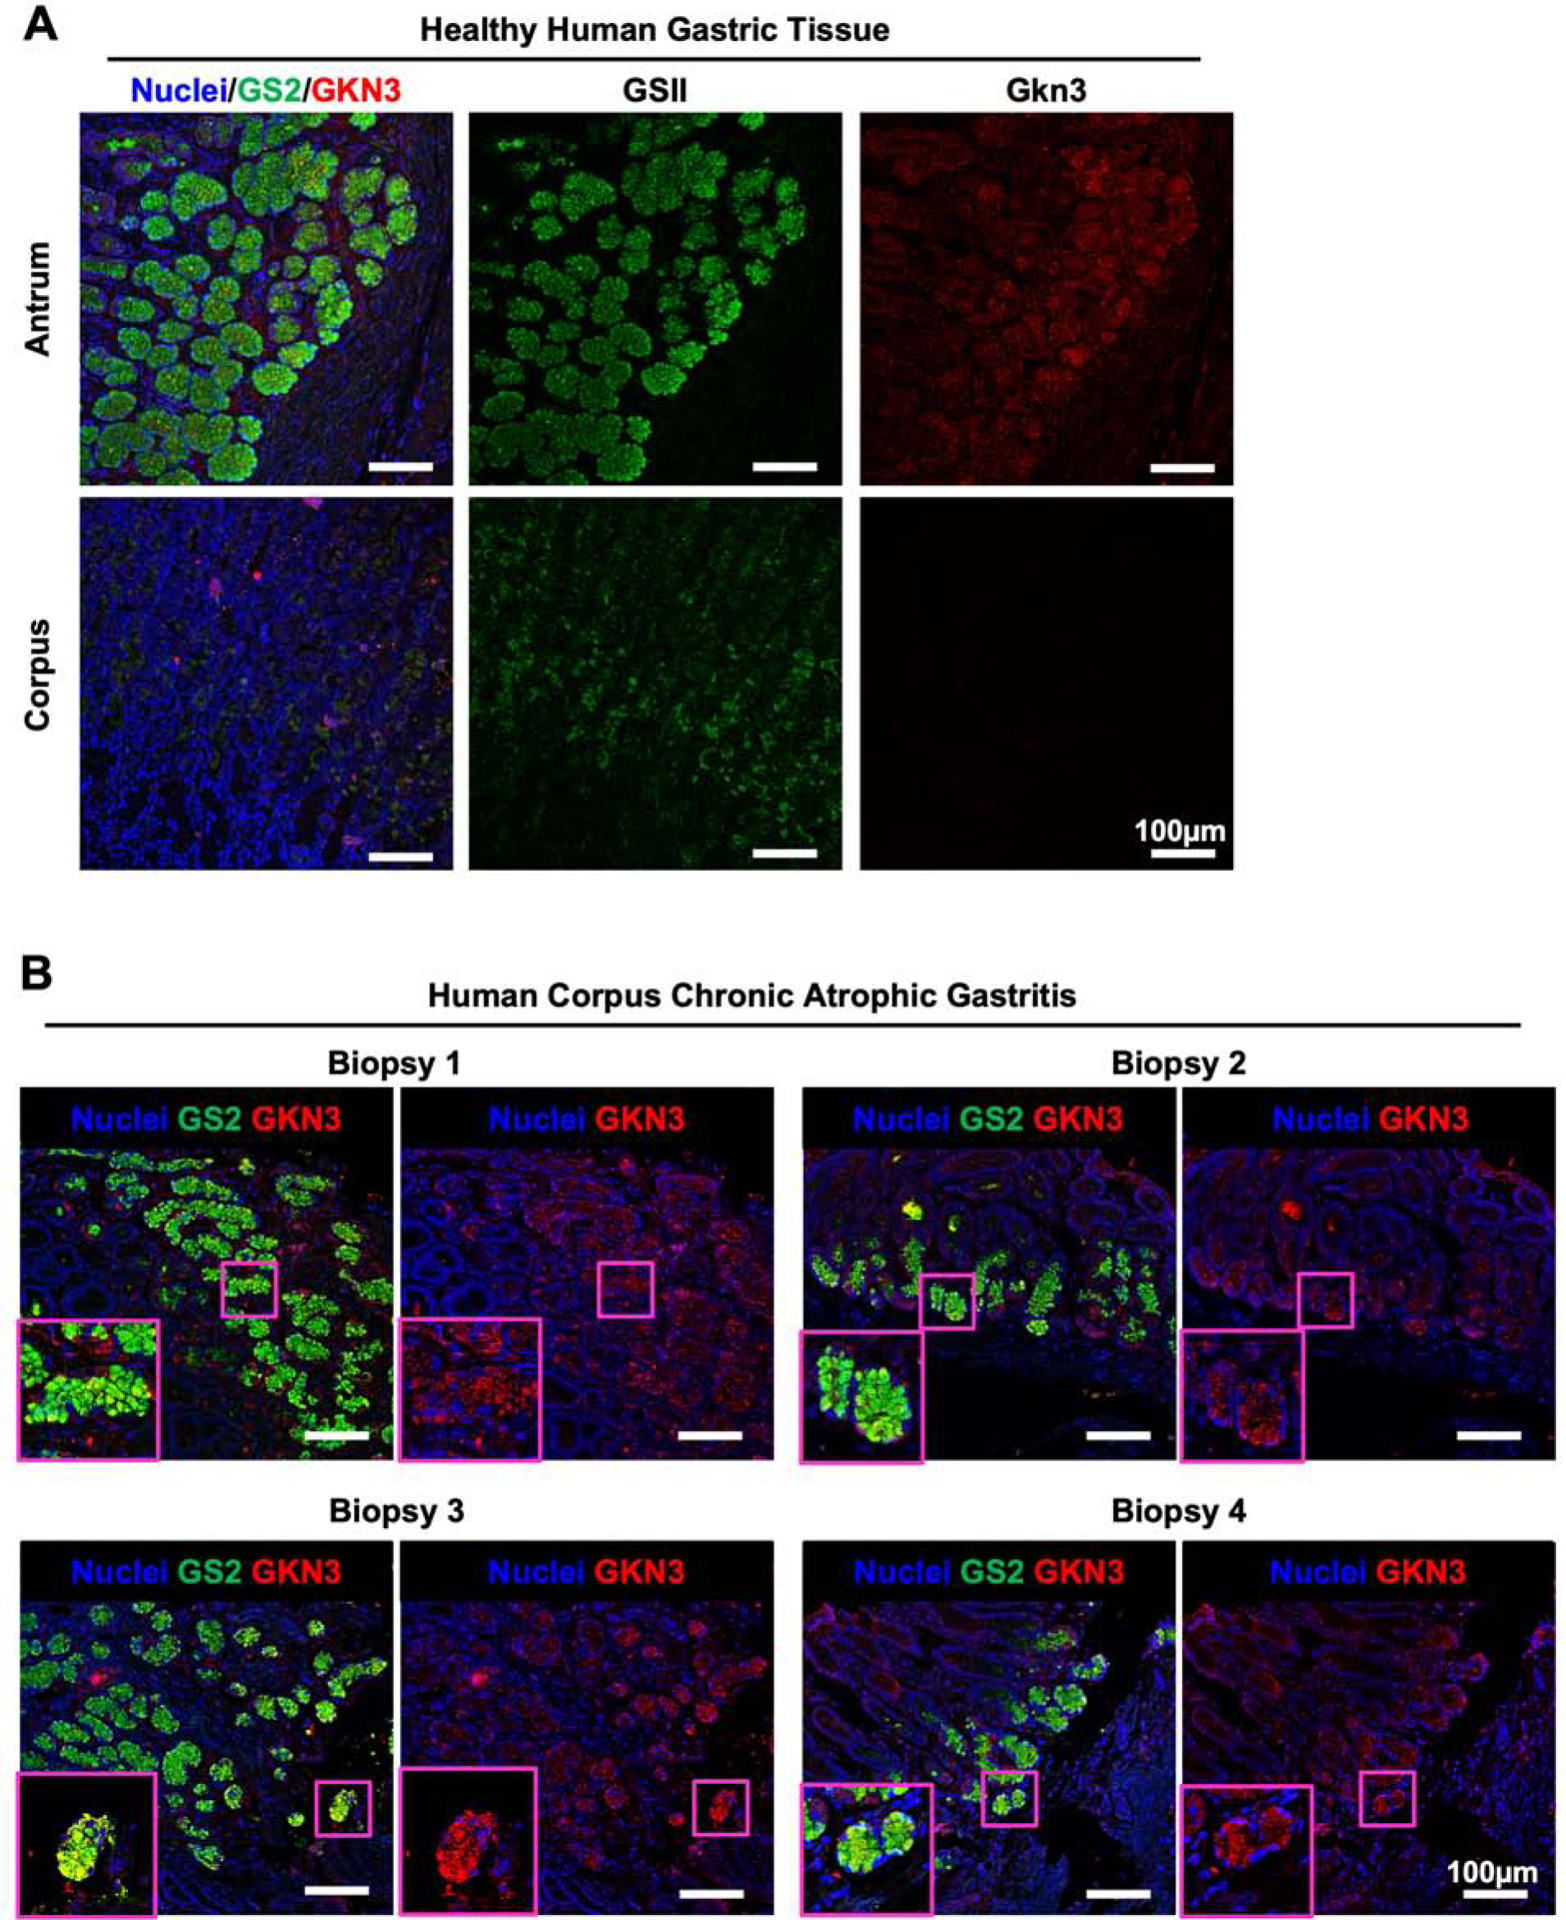
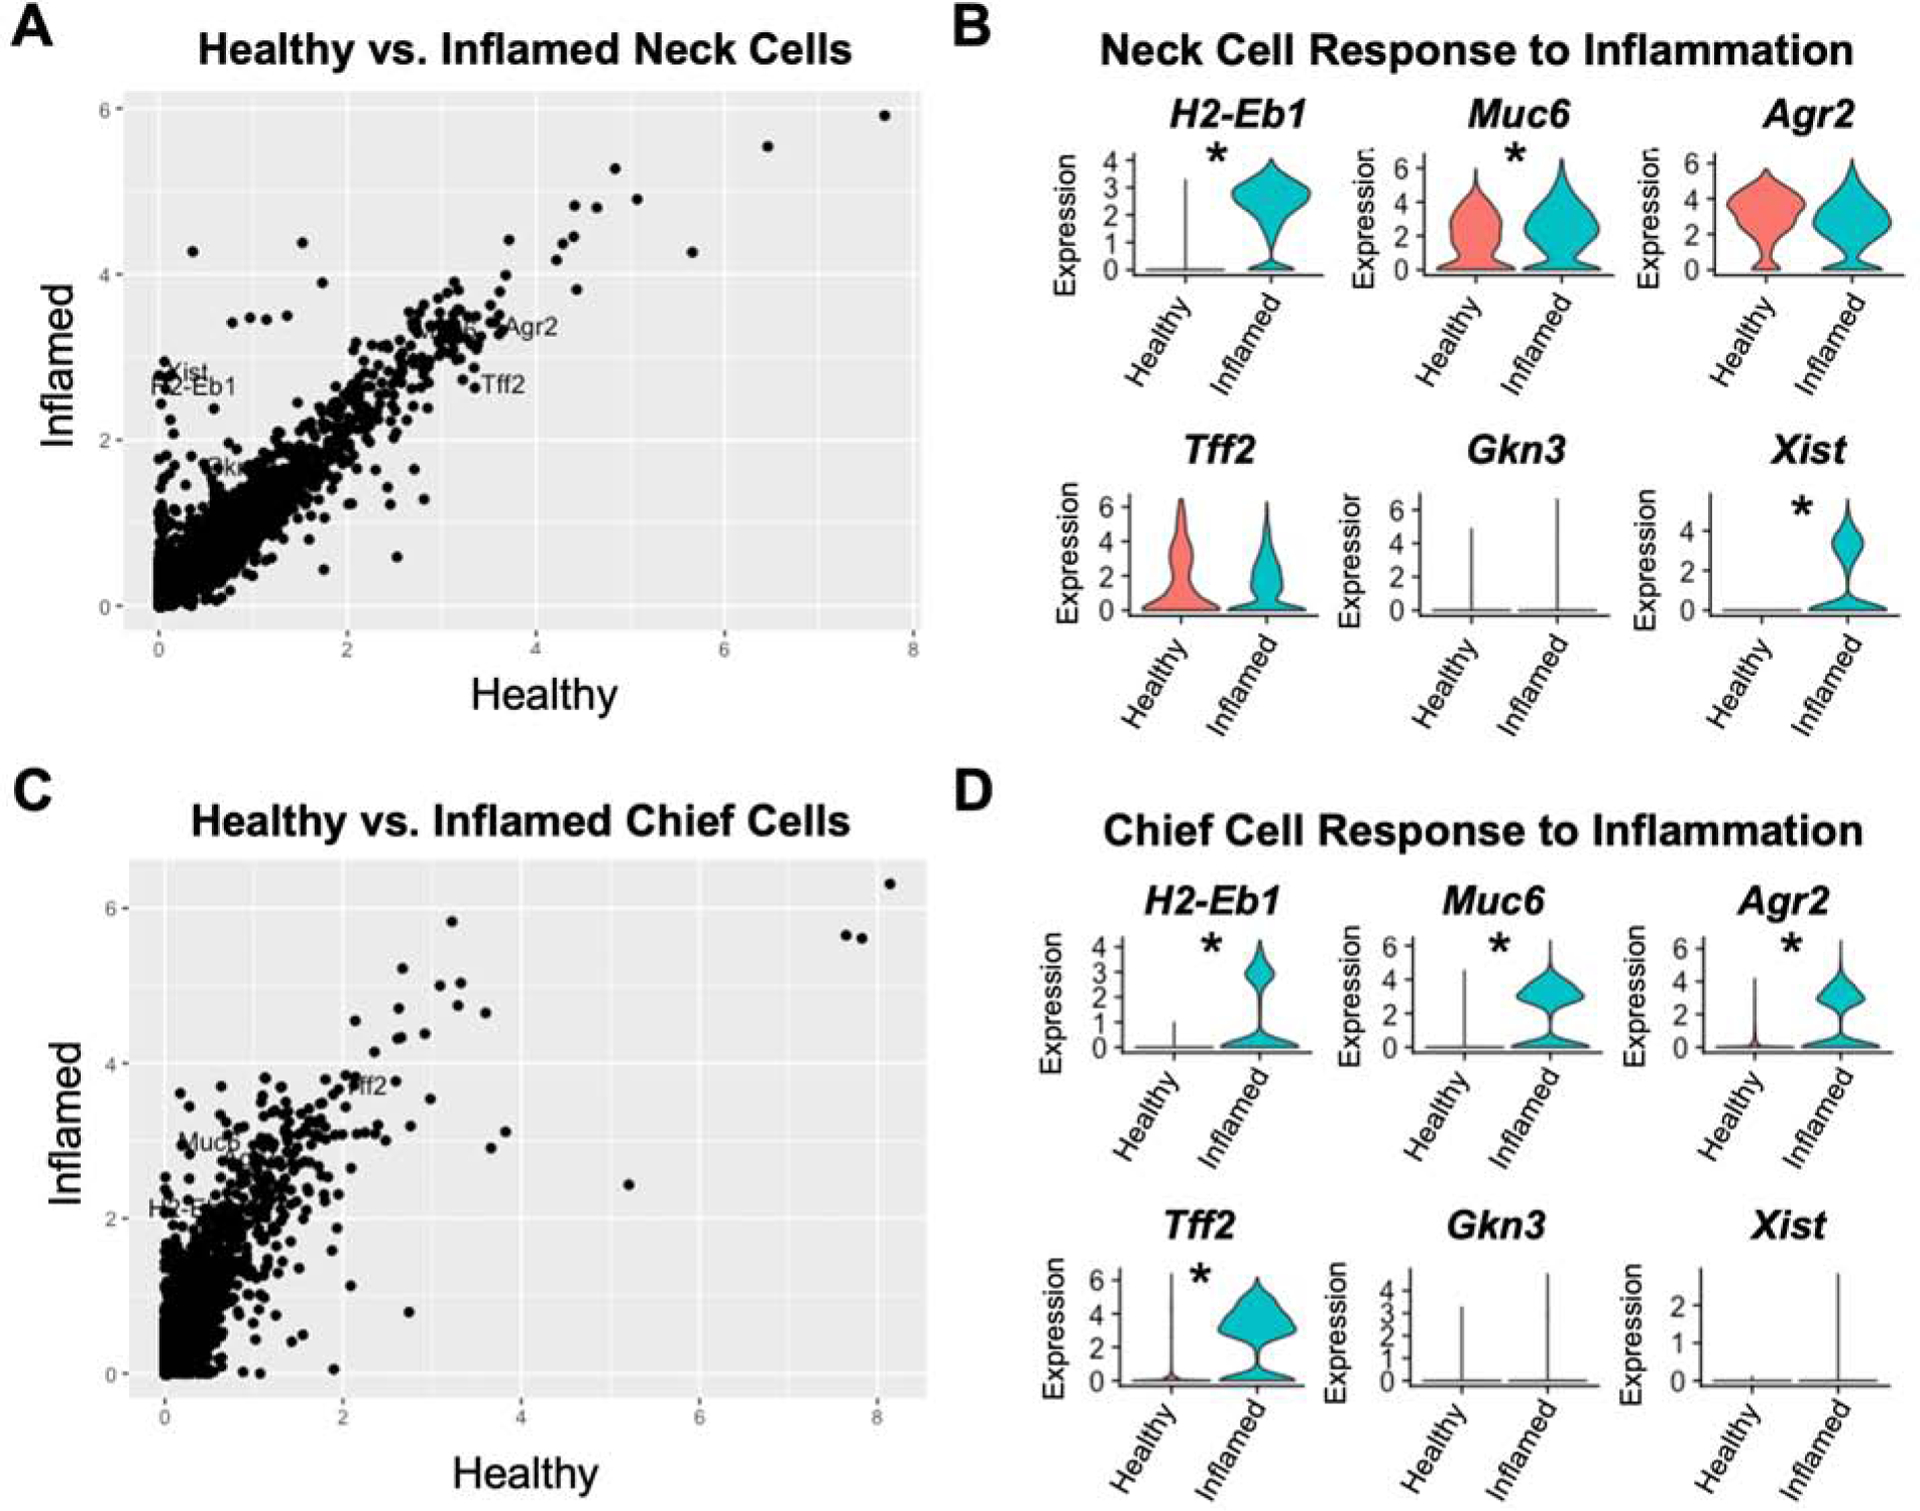
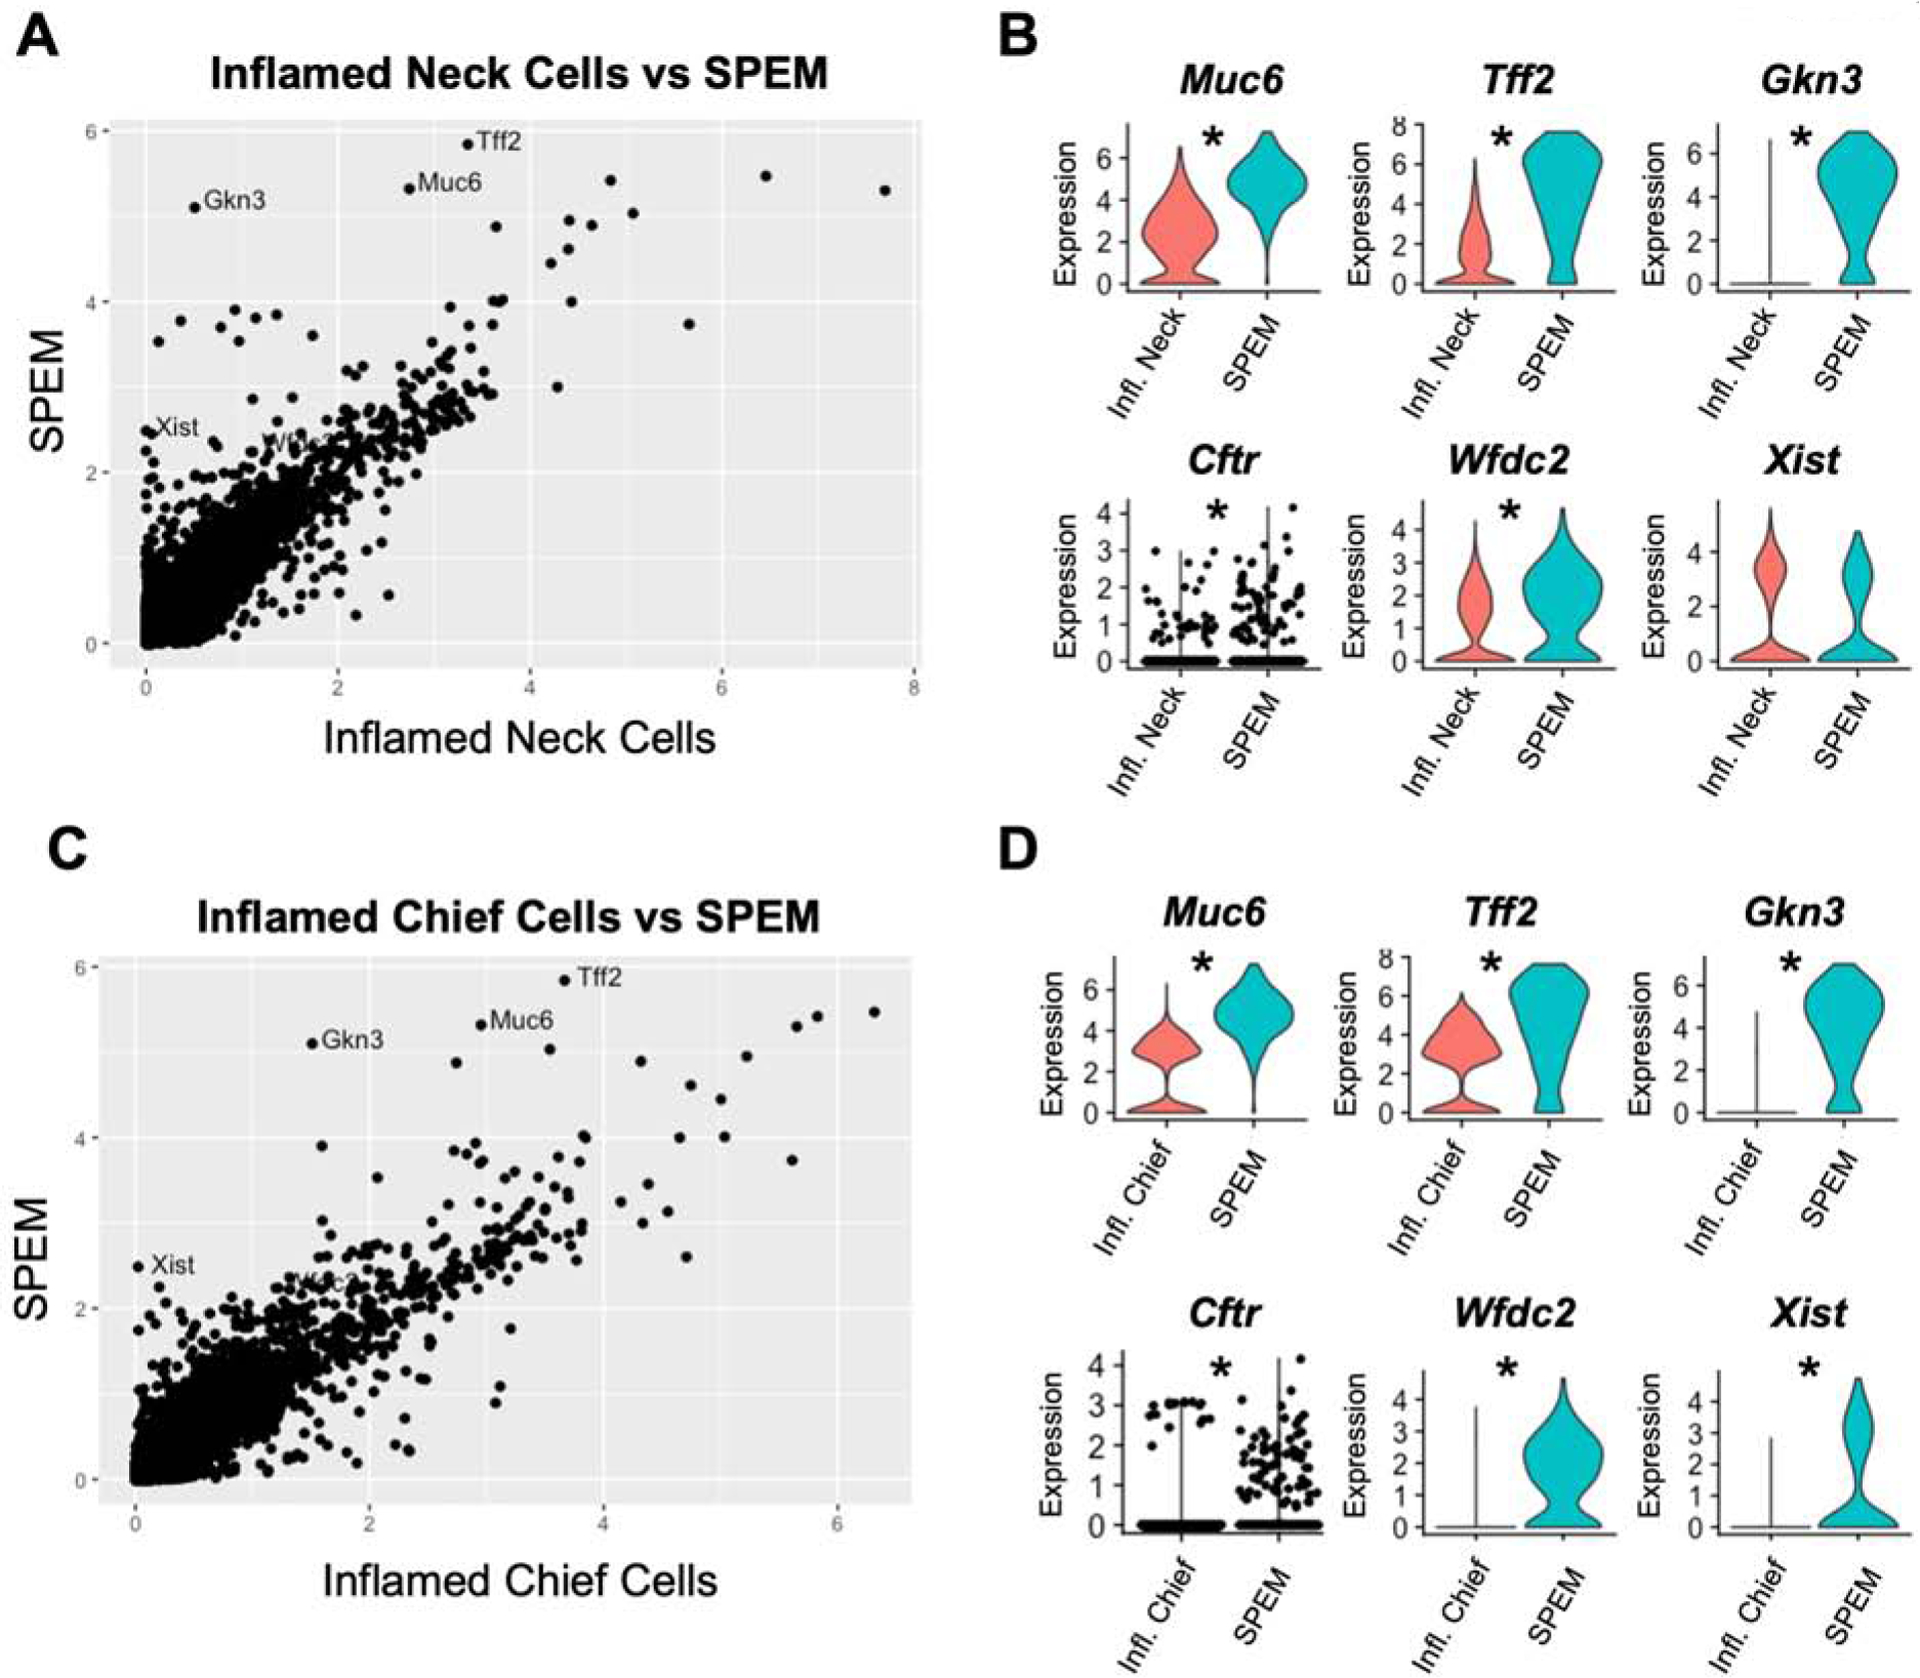
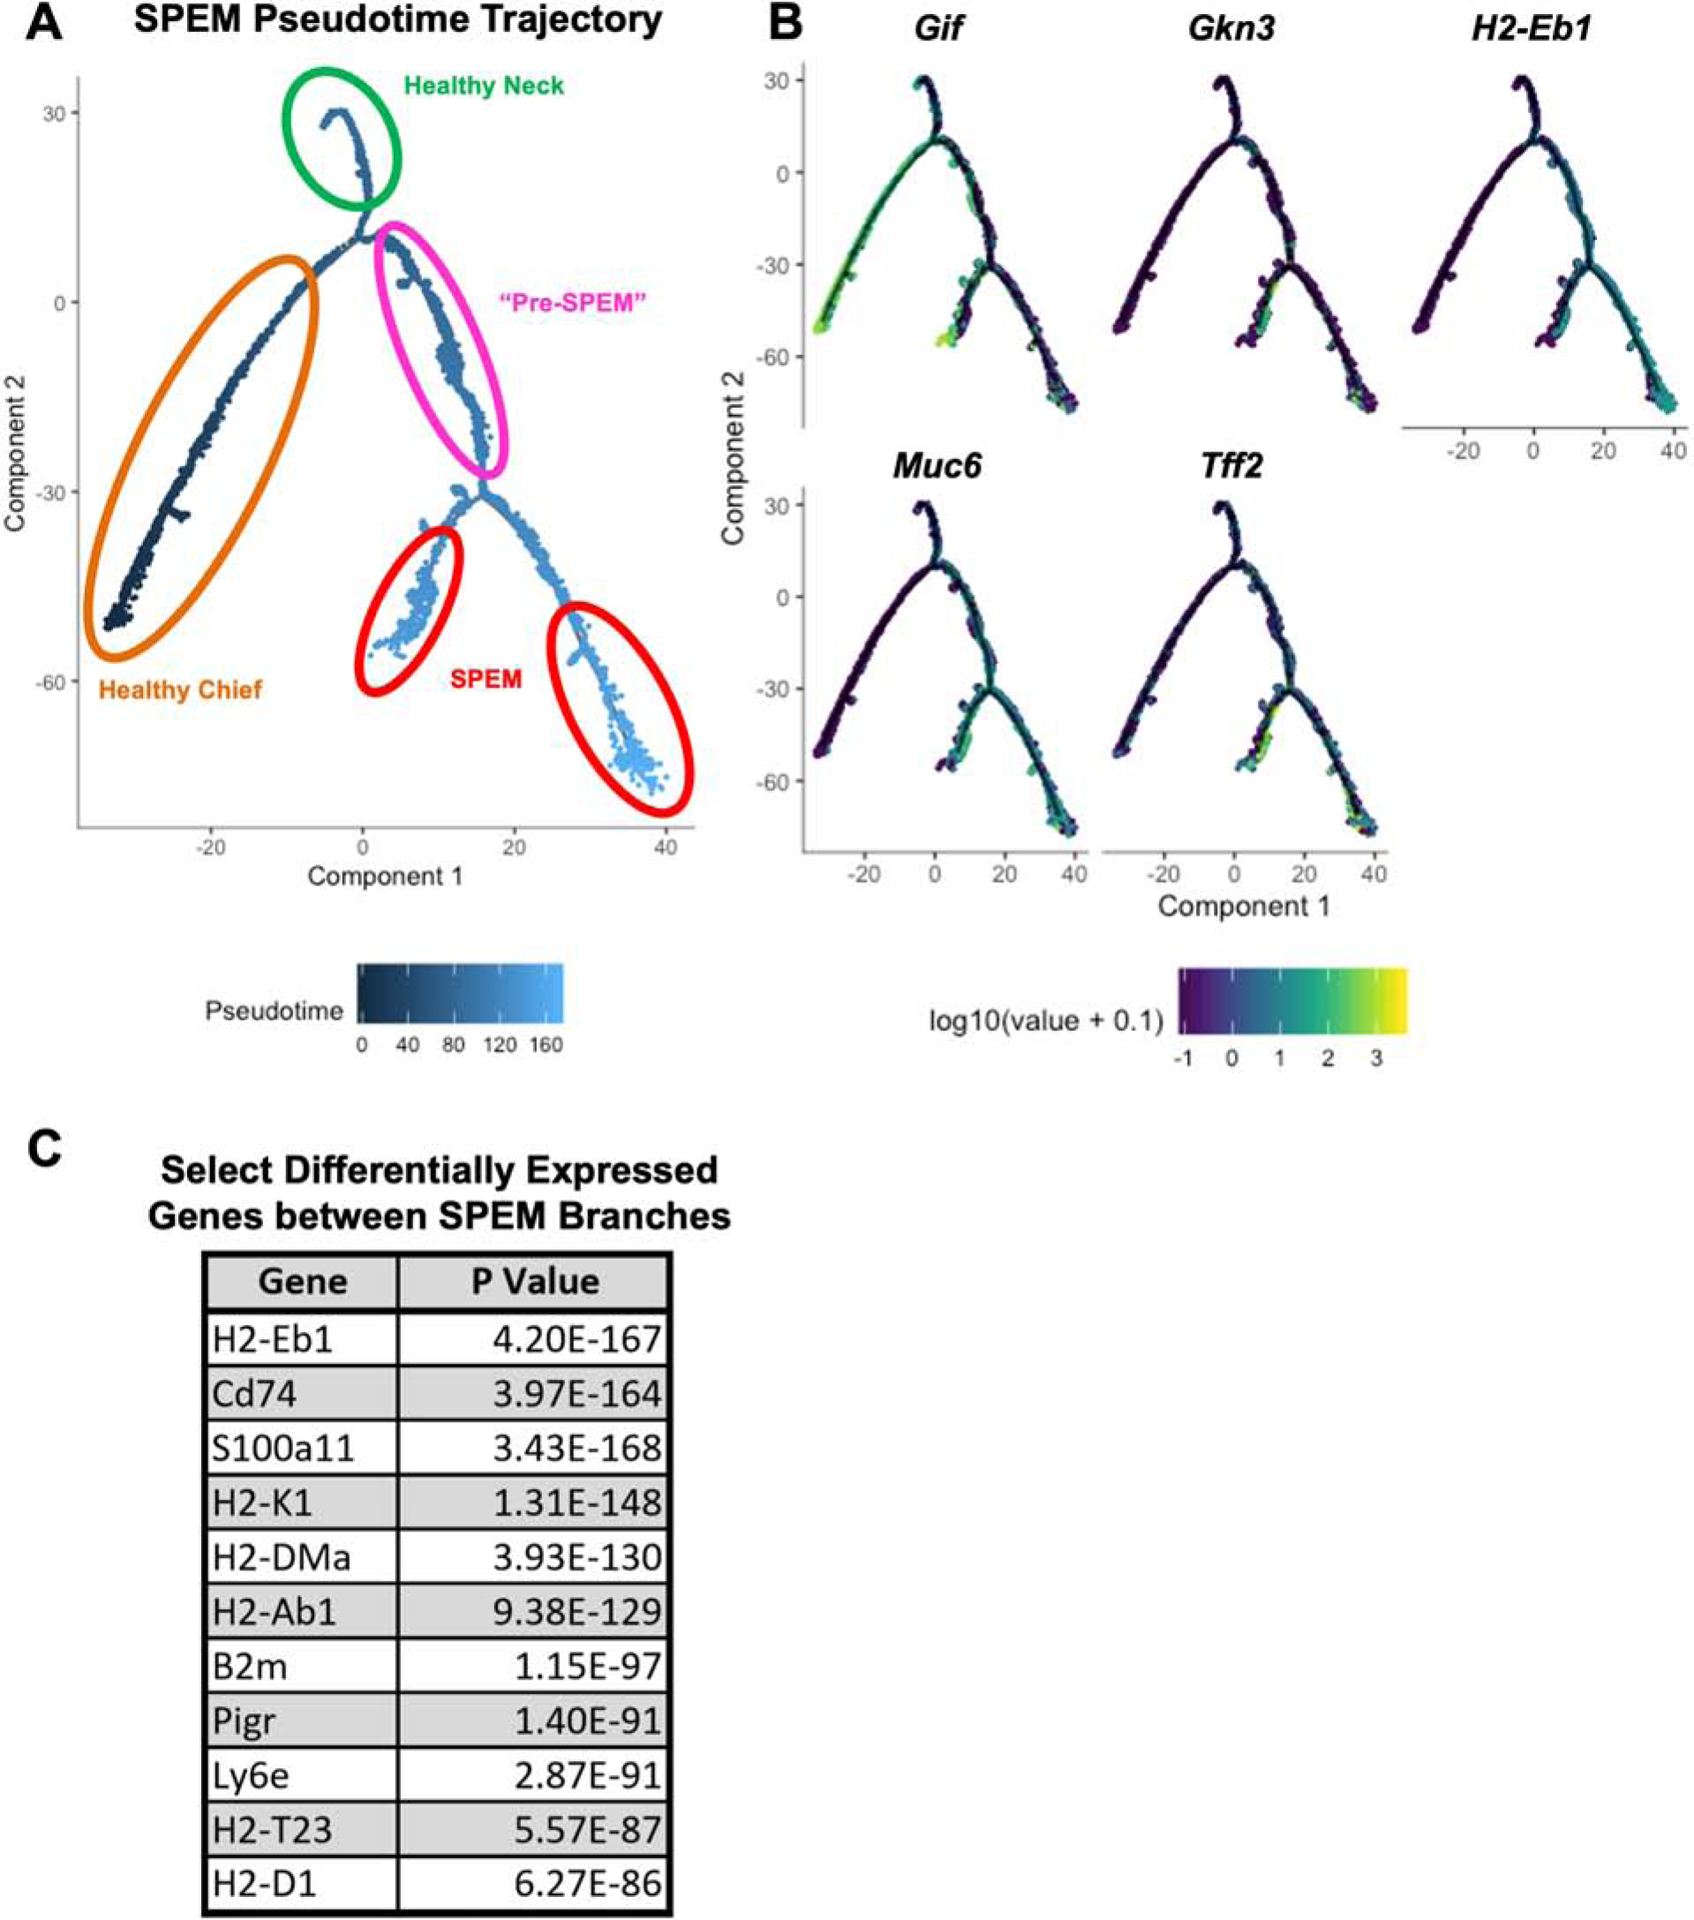
Results: Analyses of gastric epithelial transcriptomes revealed that gastrokine 3 (Gkn3) mRNA is a specific marker of mouse gastric corpus metaplasia (spasmolytic polypeptide expressing metaplasia, SPEM). Gkn3 mRNA was undetectable in healthy gastric corpus; its expression in chronically inflamed stomachs (from TxA23 mice and mice with Helicobacter pylori infection) identified more metaplastic cells throughout the corpus than previously recognized. Staining of healthy and diseased human gastric tissue samples paralleled these results. Although mucous neck cells and chief cells from healthy stomachs each had distinct transcriptomes, in chronically inflamed stomachs, these cells had distinct transcription patterns that converged upon a pre-metaplastic pattern, which lacked the metaplasia-associated transcripts. Finally, pseudotime trajectory analysis confirmed the convergence of mucous neck cells and chief cells into a pre-metaplastic phenotype that ultimately progressed to metaplasia.

Conclusions: In analyses of tissues from chronically inflamed stomachs of mice and humans, we expanded the definition of gastric metaplasia to include Gkn3 mRNA and GKN3-positive cells in the corpus, allowing a more accurate assessment of SPEM. Under conditions of chronic inflammation, chief cells and mucous neck cells are plastic and converge into a pre-metaplastic cell type that progresses to metaplasia.

Keywords: Atrophy; Gastric Cancer; Immune Response; SPEM.


Conflict of interest statement

Disclosures: The authors declare no potential conflicts of interest.

Figures

Figure 1.
Figure 1.. Identification of mucous neck cells, chief cells, and SPEM cells in single cell transcriptional data sets.
(A) Uniform manifold approximation and projection (UMAP) based unbiased clustering of gastric epithelial cell suspensions isolated from healthy BALB/c and chronically inflamed TxA23 mice. Cells are colored by cluster identity. Clusters corresponding to mucous neck cells are circled in green and clusters corresponding to chief cells are circled in orange. (B) Violin plots of mucous neck cell and chief lineage specific gene expression within the mucous neck and chief cell clusters identified in Figure 1A. Violin plots are divided in half by the library the cell was identified in, left side showing gene expression in healthy BALB/c cells (red), right side showing gene expression in chronically inflamed cells (green). (C) Violin plots of Tff2 and Gkn3 gene expression levels in all identified clusters of the combined healthy and inflamed scRNA-seq libraries. The cluster identified as SPEM is outlined in red.
Figure 2.
Figure 2.. GKN3 is expressed by SPEM cells in the murine gastric corpus.
(A) Representative RNAscope images of healthy antrum, healthy corpus, and atrophic corpus from TxA23 mice with chronic gastritis. Nuclei identified with DAPI (white). The identified transcripts were Gkn3 (cyan), Tff2 (yellow), and Muc6 (red). Fluorescent images are representative of 3–5 mice per group from 1–2 separate experiments. (B) Representative fluorescent images gastric corpus from healthy mice, mice with chronic autoimmune gastritis (“Autoimmune”) and mice with chronic Helicobacter pylori infection (“H. pylori”). Tissue is stained with anti-GIF (red), GSII (green), anti-TFF2 (magenta), and anti-GKN3 (yellow).
Figure 3.
Figure 3.. GKN3 is expressed in normal human antrum and in the inflamed human corpus.
(A) Representative fluorescent images of normal human antrum and corpus. Tissue is stained with GSII (green) and anti-GKN3 (red). (B) Representative fluorescent images of corpus biopsies from human patients diagnosed with corpus gastritis. Tissue is stained with GSII (green) and anti-GKN3 (red). Magenta boxes indicate high magnification inserts demonstrating GSII+GKN3+ cells in human gastritis biopsies.
Figure 4.
Figure 4.. Mucous neck cells and chief cells adopt a mucinous transcriptional program in response to inflammation.
(A) Dot plot of the relative expression of all detected transcripts calculated from the per-cell average relative expression from scRNA-seq data sets of Mucous neck cells from healthy stomachs vs mucous neck cells from inflamed stomachs. (B) Violin plots of select gene expression levels in healthy (red) and inflamed (green) mucous neck cells. (C) Dot plot of the relative expression of all detected transcripts calculated from the per-cell average relative expression from scRNA-seq data sets of chief cells from healthy stomachs vs chief cells from inflamed stomachs. (D) Violin plots of select gene expression levels in healthy (red) and inflamed (green) chief cells. * indicates p value <0.001 by Wilcoxon rank sum test with Bonferroni post-test correction.
Figure 5.
Figure 5.. Mucous neck cells and chief cells transition to a “pre-SPEM” cell type in response to inflammation.
(A) Dot plot of the relative expression of all detected transcripts calculated from the per-cell average relative expression from scRNA-seq data sets of mucous neck cells from inflamed stomachs vs SPEM cells. (B) Violin plots of select gene expression levels in inflamed mucous neck cells (red) and SPEM cells (green). Violin plot for Cftr has individual cell points visualized as black dots overlaid on the violin distribution. (C) Dot plot of the relative expression of all detected transcripts calculated from the per-cell average relative expression from scRNA-seq data sets of chief cells from inflamed stomachs vs SPEM cells. (D) Violin plots of select gene expression levels in inflamed chief cells (red) and SPEM cells (green). Violin plot for Cftr has individual cell points visualized as black dots overlaid on the violin distribution. * indicates p value <0.001 by Wilcoxon rank sum test with Bonferroni post-test correction.
Figure 6.
Figure 6.. Pseudotime trajectory analysis traces the origins of inflammation-induced SPEM to both mucous neck cells and chief cells.
(A) Calculated pseudotime trajectory based on differentially expressed genes in healthy and inflamed mucous neck cells, healthy and inflamed chief cells, and SPEM cells. Cells are colored according to computed pseudotime coordinate, with darker cells denoting earlier time points in the trajectory and lighter cells denoting later time points. Branches of the timeline containing healthy chief cells (orange), healthy mucous neck cells (green), “Pre-SPEM” comprised of inflamed mucous neck and chief cells (pink), and SPEM cells (red) are circled. (B) Pseudotime trajectory as shown in Figure 4A, but cells are now colored according to gene expression for Gif, Gkn3, Muc6, Tff2, and H2-Eb1. Darker cells indicate lower expression, lighter cells indicate higher expression. (C) Select significant differentially expressed genes between the terminal SPEM branches shown in 4A.

References

    1. Ferlay J, Soerjomataram I, Dikshit R, et al. Cancer incidence and mortality worldwide: sources, methods and major patterns in GLOBOCAN 2012. Int J Cancer 2015;136:E359–86. - PubMed
    1. Fox JG, Wang TC. Inflammation, atrophy, and gastric cancer. J Clin Invest 2007;117:60–9. - PMC - PubMed
    1. Landgren AM, Landgren O, Gridley G, et al. Autoimmune disease and subsequent risk of developing alimentary tract cancers among 4.5 million US male veterans. Cancer 2011;117:1163–71. - PMC - PubMed
    1. Jeong S, Choi E, Petersen CP, et al. Distinct metaplastic and inflammatory phenotypes in autoimmune and adenocarcinoma-associated chronic atrophic gastritis. United European Gastroenterol J 2017;5:37–44. - PMC - PubMed
    1. Elsborg L, Mosbech J. [Pernicious anemia as a risk factor for development of stomach cancer]. Ugeskr Laeger 1979;141:773–6. - PubMed

Publication types

MeSH terms