

A Spatio-Temporal Analysis of the Environmental Correlates of COVID-19 Incidence in Spain
- PMID: 32836331
- PMCID: PMC7300768
- DOI: 10.1111/gean.12241
A Spatio-Temporal Analysis of the Environmental Correlates of COVID-19 Incidence in Spain
Abstract
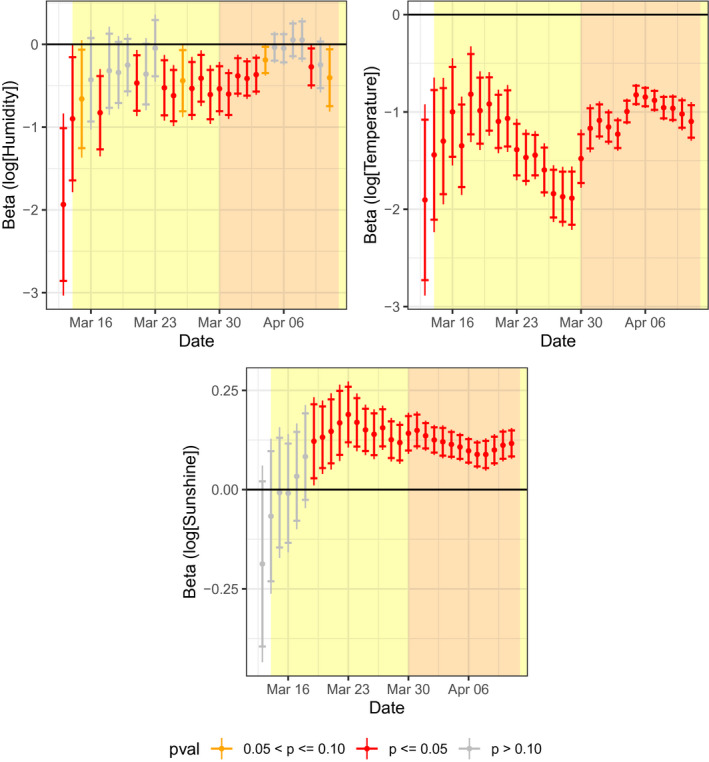
The novel SARS-CoV2 has disrupted health systems and the economy, and public health interventions to slow its spread have been costly. How and when to ease restrictions to movement hinges in part on whether SARS-CoV2 will display seasonality due to variations in temperature, humidity, and hours of sunshine. Here, we address this question by means of a spatio-temporal analysis in Spain of the incidence of COVID-19, the disease caused by the virus. Use of spatial Seemingly Unrelated Regressions (SUR) allows us to model the incidence of reported cases of the disease per 100,000 population as an interregional contagion process, in addition to a function of temperature, humidity, and sunshine. In the analysis we also control for GDP per capita, percentage of older adults in the population, population density, and presence of mass transit systems. The results support the hypothesis that incidence of the disease is lower at higher temperatures and higher levels of humidity. Sunshine, in contrast, displays a positive association with incidence of the disease. Our control variables also yield interesting insights. Higher incidence is associated with higher GDP per capita and presence of mass transit systems in the province; in contrast, population density and percentage of older adults display negative associations with incidence of COVID-19.
© 2020 The Ohio State University.
Figures


References
-
- Allaire, J. , Xie Y., R Foundation , Wickham H., Journal of Statistical Software , Vaidyanathan R., Association for Computing Machinery , et al. (2020). Rticles: Article Formats for R Markdown. Software Manual. https://CRAN.R-project.org/package=rticles
-
- Angulo, A. , Lopez F. A., Minguez R., and Mur J.. (2020). Spsur: Spatial seemingly unrelated regression models. Software Manual. http://github.com/rominsal/spsur
-
- Anselin, L. (1988). Spatial Econometrics: Methods and Models, Studies in Operational Regional Science. Dordrecht, the Netherlands: Kluwer Academic Publishers.
-
- Araujo, M. B. , and Naimi B.. (2020). Spread of sars‐cov‐2 coronavirus likely to be constrained by climate. medRxiv. https://www.medrxiv.org/content/10.1101/2020.03.12.20034728v3. - DOI
-
- Arnold, J. B. (2019). Ggthemes: Extra Themes, Scales and Geoms for ‘ggplot2’. Software Manual. https://CRAN.R-project.org/package=ggthemes
LinkOut - more resources
Full Text Sources
Miscellaneous