. 2020 Jun;41(2):259-289.
doi: 10.1111/1475-5890.12228. Epub 2020 Jun 26.

COVID-19 and Ethnic Inequalities in England and Wales

Affiliations

COVID-19 and Ethnic Inequalities in England and Wales

Lucinda Platt et al. Fisc Stud. 2020 Jun.

Abstract

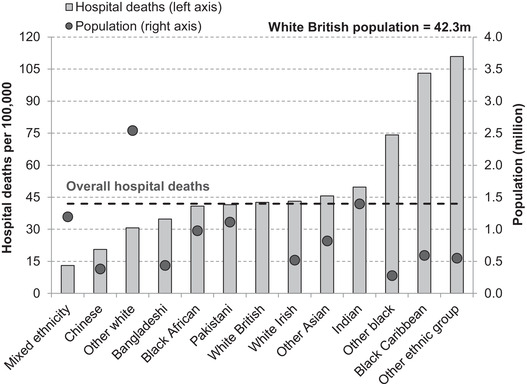
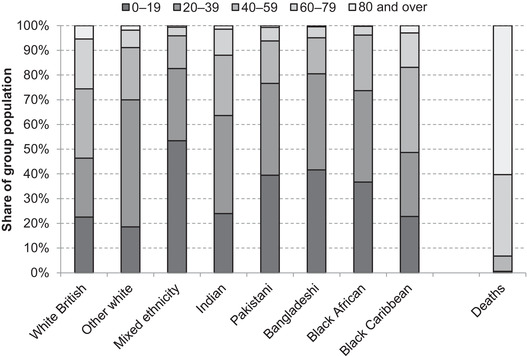
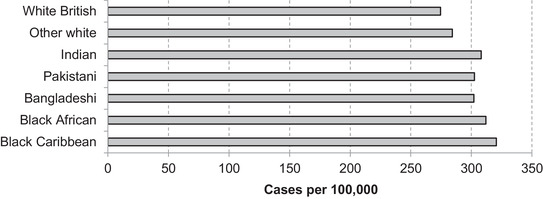
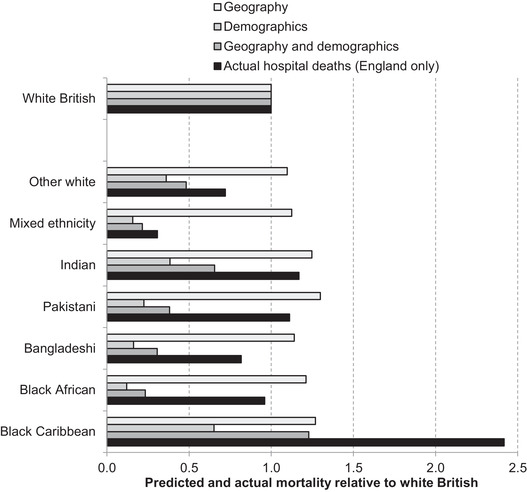
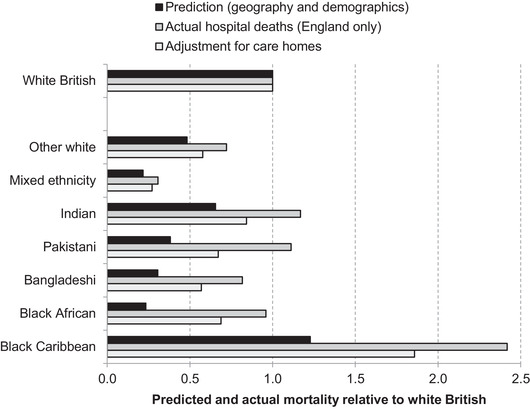
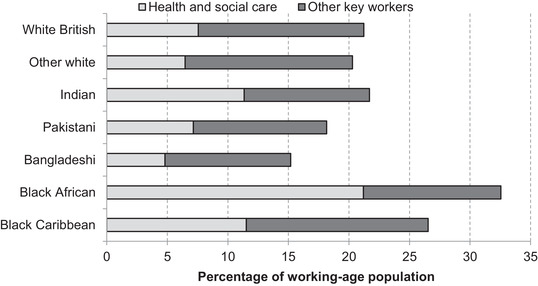
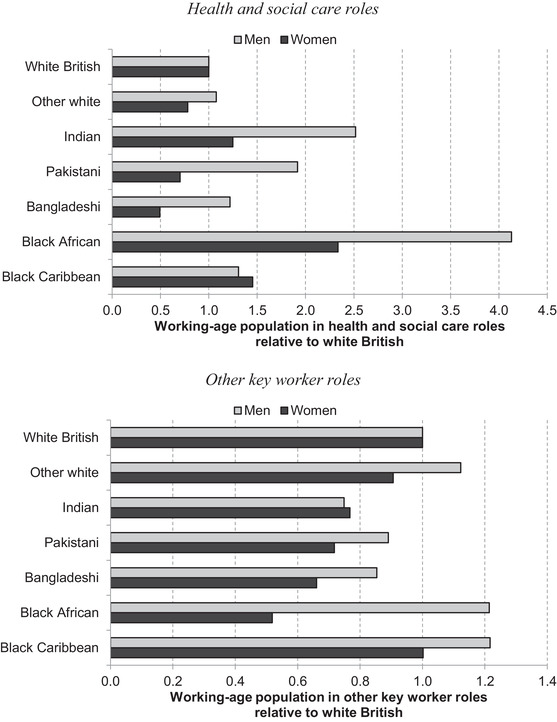
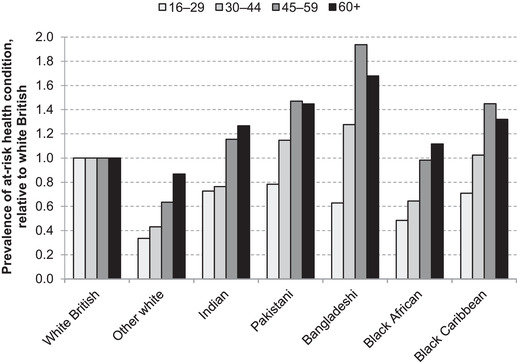
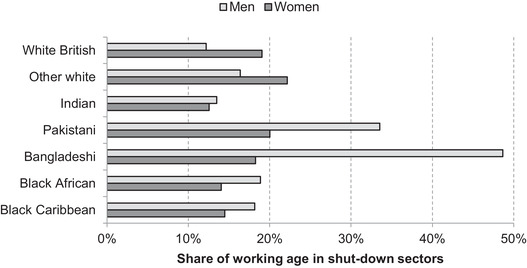
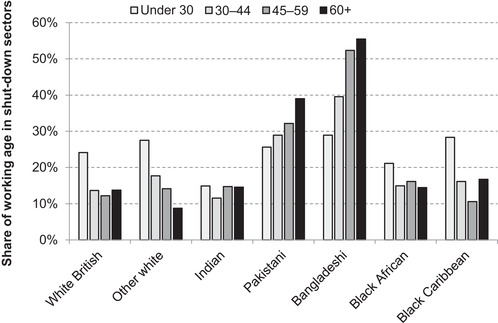
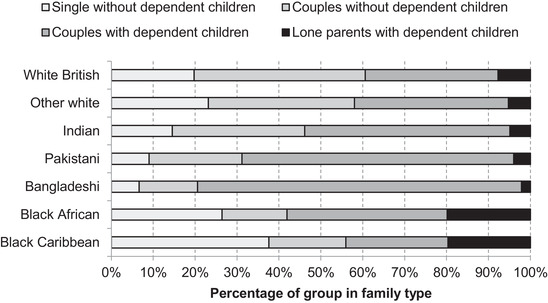
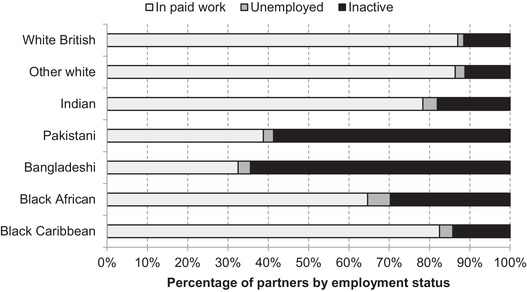
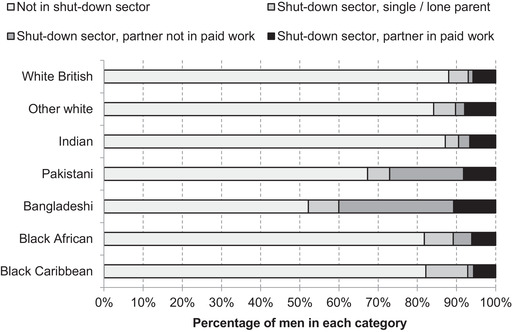
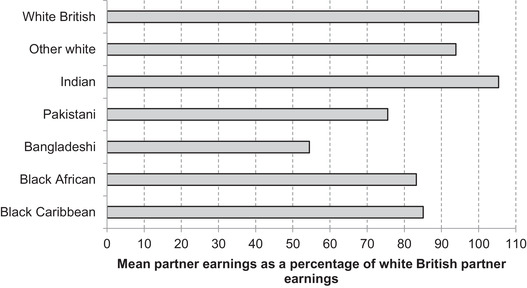
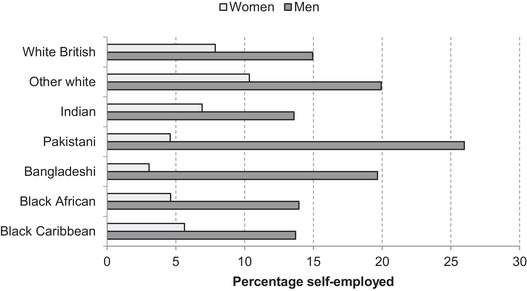
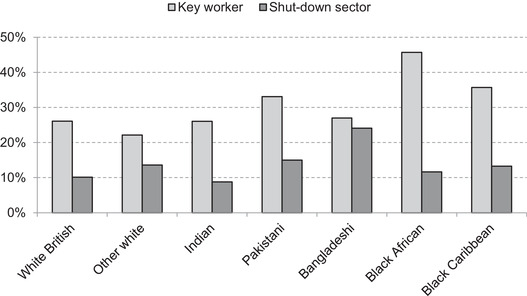
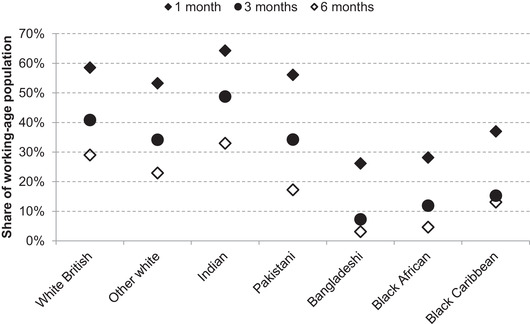
The economic and public health crisis created by the COVID-19 pandemic has exposed existing inequalities between ethnic groups in England and Wales, as well as creating new ones. We draw on current mortality and case data, alongside pre-crisis labour force data, to investigate the relative vulnerability of different ethnic groups to adverse health and economic impacts. After accounting for differences in population structure and regional concentration, we show that most minority groups suffered excess mortality compared with the white British majority group. Differences in underlying health conditions such as diabetes may play a role; so too may occupational exposure to the virus, given the very different labour market profiles of ethnic groups. Distinctive patterns of occupational concentration also highlight the vulnerability of some groups to the economic consequences of social distancing measures, with Bangladeshi and Pakistani men particularly likely to be employed in occupations directly affected by the UK's 'lockdown'. We show that differences in household structures and inequalities in access to savings mean that a number of minority groups are also less able to weather short-term shocks to their income. Documenting these immediate consequences of the crisis reveals the potential for inequalities to become entrenched in the longer term.

Keywords: COVID‐19; ethnicity; inequality; mortality; occupational segregation.


Figures

FIGURE 1
FIGURE 1
Total registered hospital deaths from COVID‐19 per 100,000 in England by ethnic group Note: In 9 per cent of cases, an ethnic group could not be identified; these are excluded. The ‘other white’ population includes the Gypsy and Irish Traveller group. The ‘other ethnic group’ includes the Arab group. Source: Authors’ calculations using population data from 2011 ONS Census of England & Wales and NHS England COVID‐19 hospital death figures by ethnicity as of 19 May 2020.
FIGURE 2
FIGURE 2
Age distributions of selected ethnic groups in England and Wales and share of overall COVID‐19 deaths by age band Note: COVID‐19 deaths are from all places of occurrence (hospital and non‐hospital) in England and Wales. Source: Population data from 2011 ONS Census of England & Wales and COVID‐19 death data from ONS weekly occurrences up to 15 May 2020.
FIGURE 3
FIGURE 3
Confirmed COVID‐19 cases per 100,000 population in England and Wales (London boroughs inset) Note: Includes only confirmed cases of COVID‐19 in hospitals where the residence of the infected patient has been identified. Source: Authors’ calculations based on ONS 2018 mid‐year population estimates and lab‐confirmed COVID‐19 case data from Public Health England and Public Health Wales up to 24 May 2020.
FIGURE 4
FIGURE 4
Predicted number of lab‐confirmed COVID‐19 cases per 100,000 of ethnic group, based on local authority of residence in England and Wales Note: Predicted number of lab‐confirmed COVID‐19 cases per 100,000 of group population based on geographic distribution of populations and confirmed cases at upper‐tier local authority level. Source: Authors’ calculations based on ONS Census of England & Wales and lab‐confirmed COVID‐19 case data from Public Health England and Public Health Wales up to 24 May 2020.
FIGURE 5
FIGURE 5
Predicted COVID‐19 fatalities based on geography and demographics, and actual hospital deaths, relative to white British, by ethnic group Note: Predictions based on demographics and geography are for COVID‐19 fatalities in England and Wales in all places of occurrence (hospital and non‐hospital deaths). Source: Authors’ calculations using COVID‐19 hospital death statistics from Public Health England as of 19 May 2020, COVID‐19 death data from ONS weekly occurrences up to 15 May 2020, and 2011 ONS Census of England & Wales.
FIGURE 6
FIGURE 6
Share of weekly registered COVID‐19 deaths occurring outside of hospitals in England and Wales Note: ‘Other non‐hospital’ includes all other places where deaths may occur, including hospices, prisons, hotels and other people's homes. Source: COVID‐19 death data from ONS weekly registrations up to 15 May 2020.
FIGURE 7
FIGURE 7
Accounting for care home deaths in relative mortality of ethnic groups Note: Adjustment assumes that all care home deaths in each ethnic group are proportionate to ethnic group populations in care homes in England and Wales, and that hospital deaths per capita in each group are the same in Wales as in England. Source: Authors’ calculations using COVID‐19 hospital death statistics from Public Health England as of 19 May 2020, COVID‐19 death data from ONS weekly occurrences up to 15 May 2020, and 2011 ONS Census of England & Wales.
FIGURE 8
FIGURE 8
Predicted deaths at home per 100,000 individuals according to local authority of residence in England and Wales, by ethnic group Note: Shows the number of deaths at home overall in the local authority of residence of a member of each of the ethnic groups on average – the ethnicity of those who have died at home is not currently available. Source: Authors’ calculations using COVID‐19 death data from ONS weekly occurrences up to 15 May 2020 and 2011 ONS Census of England & Wales.
FIGURE 9
FIGURE 9
Share of key workers among those of working age in each of seven ethnic groups Note: Key workers are identified based on government guidance from 19 March 2020 using four‐digit Standard Occupational Classification (SOC) codes to identify key worker jobs in health and social care, education, public services, food, public order and transport. For further details, see Farquharson, Rasul and Sibieta (2020). Shares represent the proportion of the working‐age population (aged 16–64) (excluding students) of each group that are in the identified occupations. Source: Quarterly Labour Force Survey, quarter 1 2016 to quarter 4 2019.
FIGURE 10
FIGURE 10
Share of key workers in each of seven ethnic groups relative to white British, by sex Note: See note for Figure 9. Source: Quarterly Labour Force Survey, quarter 1 2016 to quarter 4 2019.
FIGURE 11
FIGURE 11
Rates of long‐term health conditions comprising risks for COVID‐19, by ethnic group and age in England and Wales, relative to white British Note: Self‐reported long‐term health problems, where ‘at risk’ includes one or more of chest and breathing problems, heart, blood pressure or circulation problems, and diabetes. Source: Quarterly Labour Force Survey, quarter 1 2016 to quarter 4 2019.
FIGURE 12
FIGURE 12
Share of working‐age population in shut‐down sectors in England and Wales, by ethnic group and sex Note: Shares represent the percentage of the working‐age population (aged 16–64) (excluding students) of each group in shut‐down sectors. Source: Quarterly Labour Force Survey, quarter 1 2016 to quarter 4 2019.
FIGURE 13
FIGURE 13
Share of working‐age population in shut‐down sectors in England and Wales, by ethnic group and age Note: Shares represent the percentage of the working‐age population (aged 16–64) (excluding students) of each group in shut‐down sectors. Source: Quarterly Labour Force Survey, quarter 1 2016 to quarter 4 2019.
FIGURE 14
FIGURE 14
Family status of those employed in shut‐down sectors in England and Wales, by ethnic group Note: Family types as for Table 2. Source: Quarterly Labour Force Survey, quarter 1 2016 to quarter 4 2019.
FIGURE 15
FIGURE 15
Employment status of partners of those employed in shut‐down sectors in England and Wales, by ethnic group of shut‐down sector worker Note: Base is those of working age employed in shut‐down sectors and who are living in a couple. Ethnic group is that of the person working in the shut‐down sector. Source: Quarterly Labour Force Survey, quarter 1 2016 to quarter 4 2019.
FIGURE 16
FIGURE 16
Working in a shut‐down sector and partner's economic status, by ethnic group of shut‐down sector worker, men only Note: Sample is working‐age (16‐ to 64‐year‐old) men in each ethnic group. Source: Quarterly Labour Force Survey, quarter 1 2016 to quarter 4 2019.
FIGURE 17
FIGURE 17
Relative earnings of employed partners of those in shut‐down sectors in England and Wales, by ethnic group of shut‐down sector worker Note: Sample is those of working age (aged 16–64) employed in shut‐down sectors, who are living in a couple and whose partner is in work. Relative earnings based on gross weekly earnings. Source: Quarterly Labour Force Survey, quarter 1 2016 to quarter 4 2019, waves 1 and 5 only.
FIGURE 18
FIGURE 18
Share of working age in self‐employment in England and Wales, by ethnic group and sex Note: Share of those of working age (aged 16–64) in each group excluding students. Source: Quarterly Labour Force Survey, quarter 1 2016 to quarter 4 2019.
FIGURE 19
FIGURE 19
Share of employment earnings from key worker roles and shut‐down sectors in England and Wales, by ethnic group Note: Sum of earnings from employment (self‐employment earnings are not reported) by ethnic group at the individual level. In 3 per cent of cases, key workers and shut‐down sectors overlap. Source: Quarterly Labour Force Survey, quarter 1 2016 to quarter 4 2019, waves 1 and 5 only.
FIGURE 20
FIGURE 20
Months of household income that can be covered by liquid financial assets (savings accounts, current accounts, ISAs), by ethnic group Note: Working‐age individuals only (aged 20–64). Liquid financial assets are the sum of funds held in current accounts (net of overdraft), savings accounts and ISAs at the household level. Ethnic group is reported individually. Source: Authors’ calculations using the Wealth and Assets Survey wave 5 (2014–16).

References

    1. Aldridge, R. W. , Lewer, D. , Katikireddi, S. V . et al. (2020), ‘Black, Asian and minority ethnic groups in England are at increased risk of death from COVID‐19: indirect standardisation of NHS mortality data [version 1; peer review: 3 approved with reservations]’, Wellcome Open Research, 2020, 5:88 (10.12688/wellcomeopenres.15922.1). - DOI - PMC - PubMed
    1. Andrew, A. , Cattan, S. , Costa Dias, M. , Farquharson, C. , Kraftman, L. , Krutikova, S. , Phimister, A. and Sevilla, A. (2020), ‘How are mothers and fathers balancing work and family under lockdown?’, Institute for Fiscal Studies (IFS), Briefing Note no. BN290 (https://www.ifs.org.uk/publications/14860). - PMC - PubMed
    1. Blundell, J. and Machin, S. (2020), ‘Self‐employment in the Covid‐19 crisis’, Centre for Economic Performance (CEP), Covid‐19 Analysis Paper no. 003 (http://cep.lse.ac.uk/pubs/download/cepcovid-19-003.pdf).
    1. Cabinet Office (2020), ‘Ethnicity facts and figures: overweight adults’, accessed 27 May 2020 (https://www.ethnicity-facts-figures.service.gov.uk/health/diet-and-exerc...).
    1. Cook, T. , Kursumovic, E. and Lennane, S. (2020), ‘Exclusive: deaths of NHS staff from covid‐19 analysed’, Health Service Journal, accessed 24 April 2020, (https://www.hsj.co.uk/exclusive-deaths-of-nhs-staff-from-covid-19-analys...).

LinkOut - more resources