. 2020;66(4):1035-1050.
doi: 10.1007/s00466-020-01880-8. Epub 2020 Jul 28.

The reproduction number of COVID-19 and its correlation with public health interventions

Affiliations

The reproduction number of COVID-19 and its correlation with public health interventions

Kevin Linka et al. Comput Mech. 2020.

Abstract

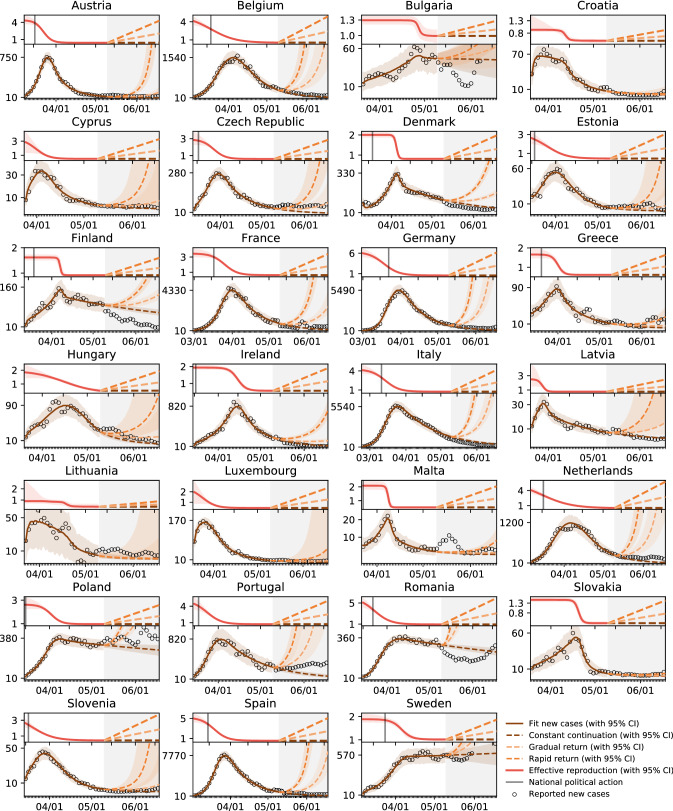
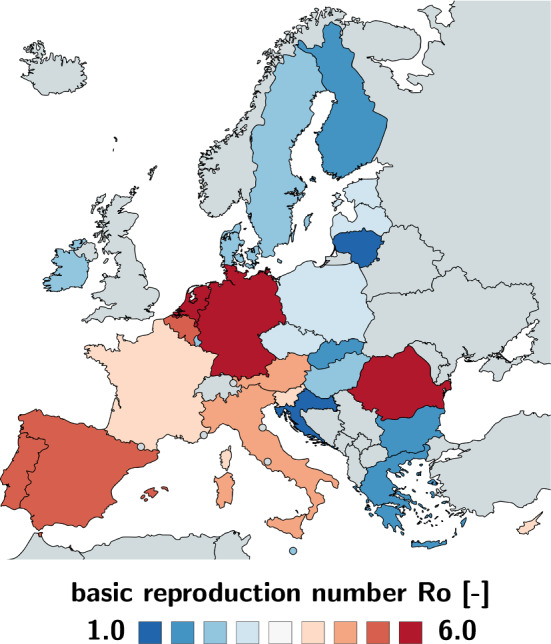
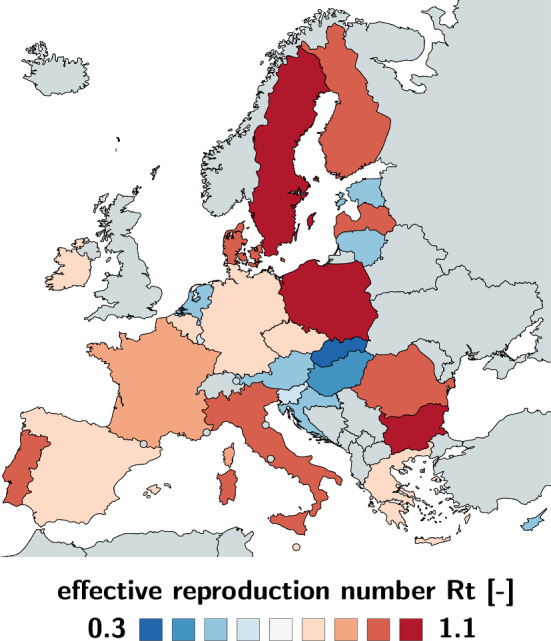
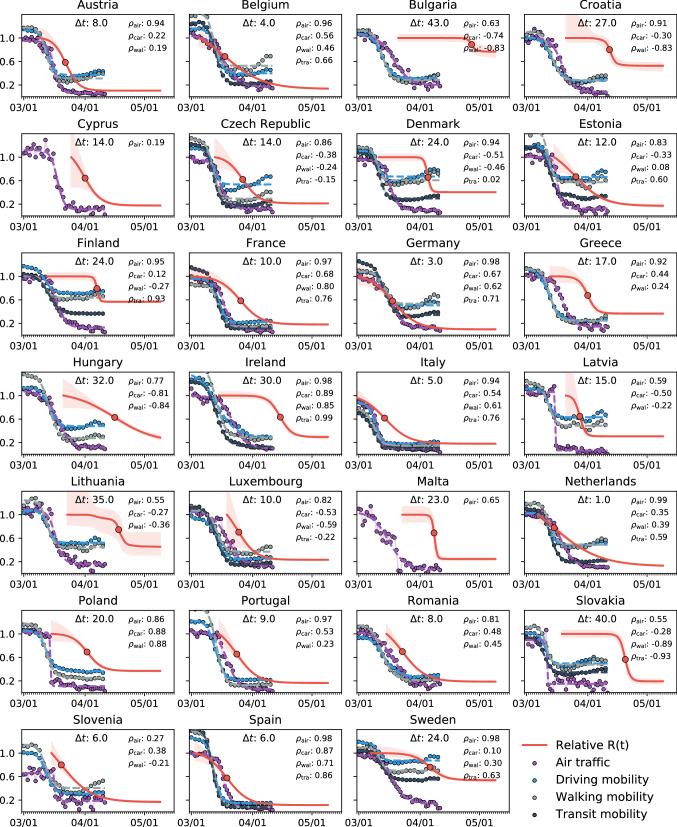
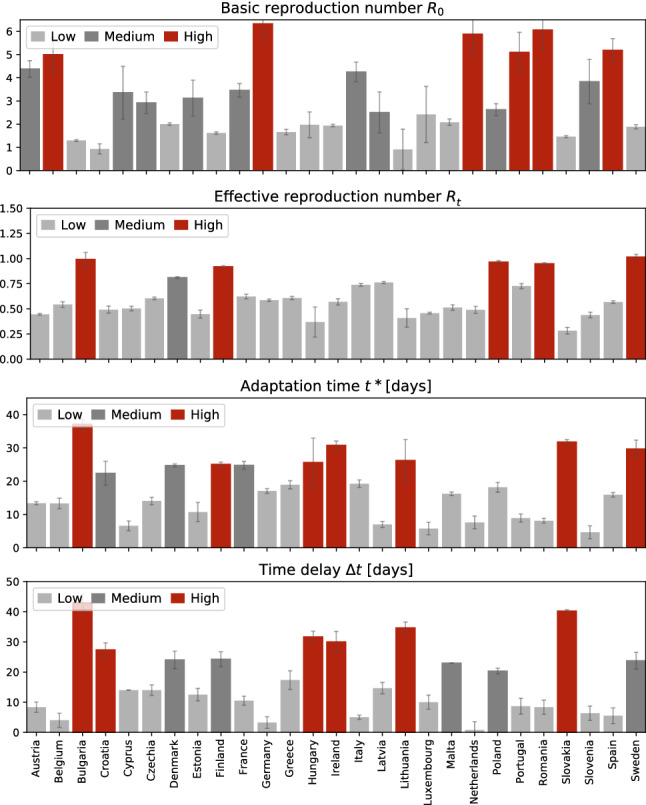
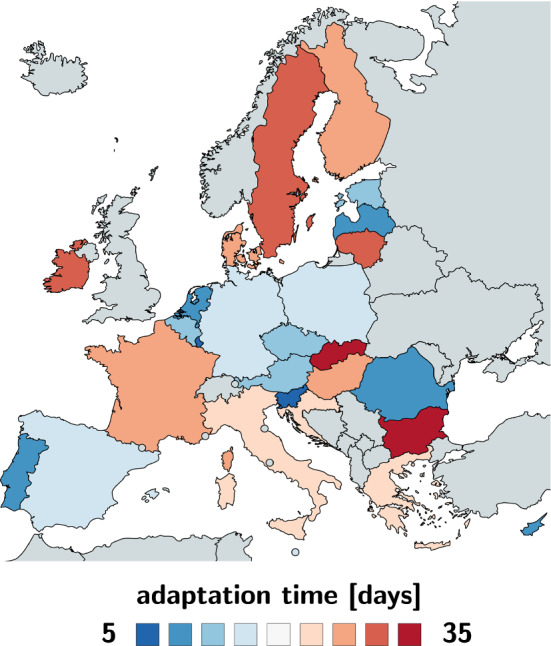
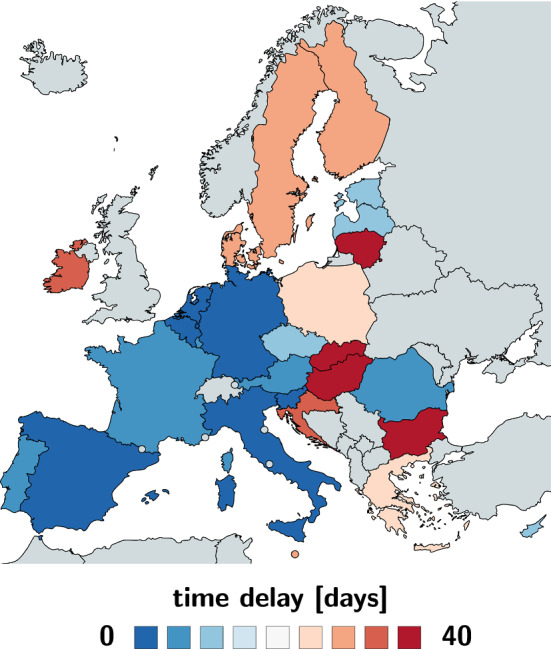
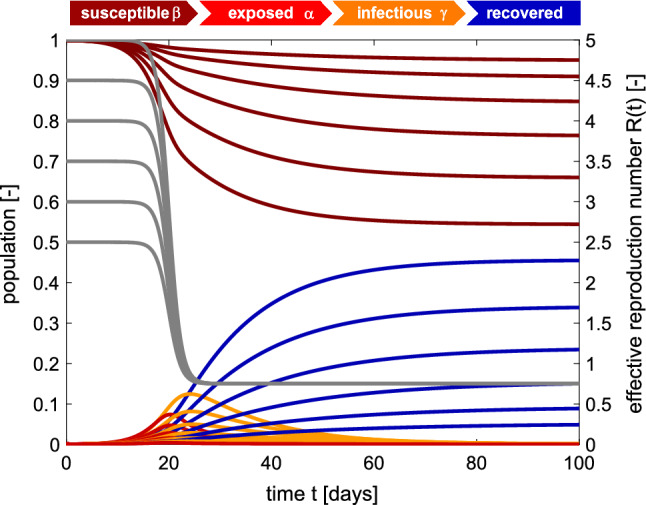
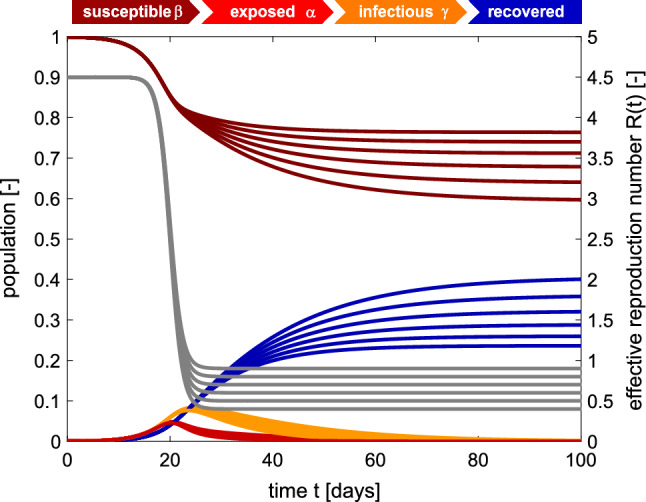
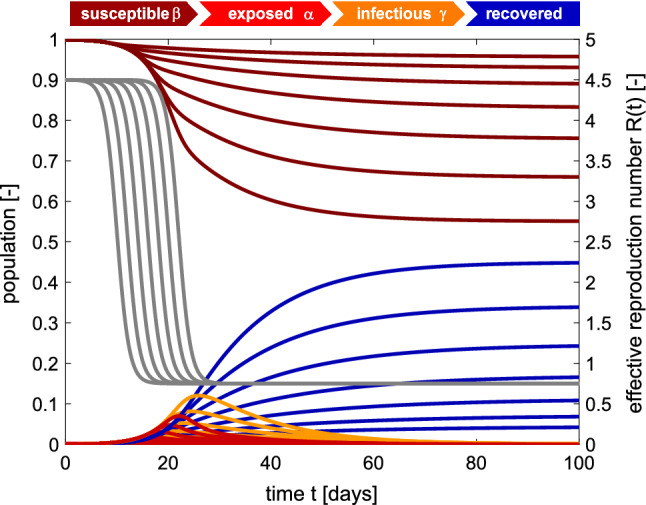
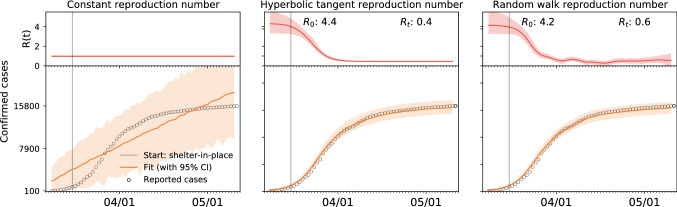
Throughout the past six months, no number has dominated the public media more persistently than the reproduction number of COVID-19. This powerful but simple concept is widely used by the public media, scientists, and political decision makers to explain and justify political strategies to control the COVID-19 pandemic. Here we explore the effectiveness of political interventions using the reproduction number of COVID-19 across Europe. We propose a dynamic SEIR epidemiology model with a time-varying reproduction number, which we identify using machine learning. During the early outbreak, the basic reproduction number was 4.22 ± 1.69, with maximum values of 6.33 and 5.88 in Germany and the Netherlands. By May 10, 2020, it dropped to 0.67 ± 0.18, with minimum values of 0.37 and 0.28 in Hungary and Slovakia. We found a strong correlation between passenger air travel, driving, walking, and transit mobility and the effective reproduction number with a time delay of 17.24 ± 2.00 days. Our new dynamic SEIR model provides the flexibility to simulate various outbreak control and exit strategies to inform political decision making and identify safe solutions in the benefit of global health.

Keywords: COVID-19; Epidemiology; Machine learning; Reproduction number; SEIR model.


Figures

Fig. 1
Fig. 1
Outbreak dynamics of COVID-19 across Europe and prediction of different exit strategies. The dots represent daily new cases. The brown and red curves illustrate the fit of the SEIR model and the effective reproduction number for the time period until May 10, 2020. The gray shaded area highlights the model predictions from May 10 until June 20, 2020. The dashed brown, orange, and red curves illustrate the projections for three possible exit strategies: a constant continuation at the effective reproduction number Rt from May 10, 2020, a gradual return to the basic reproduction number R0 within three months, and a rapid to R0 within one months
Fig. 2
Fig. 2
Basic reproduction number R0 of the COVID-19 outbreak across Europe. The basic reproduction number characterizes the initial number of new infectious created by one infectious individual. It has maximum values in Germany, the Netherlands, and Spain, with 6.33, 5.88, and 5.19 and minimum values in Bulgaria, Croatia, and Lithuania with 1.29, 0.93, and 0.91
Fig. 3
Fig. 3
Effective reproduction number Rt of the COVID-19 outbreak across Europe. The effective reproduction number characterizes the current number of new infectious created by one infectious individual. It has maximum values in Sweden, Bulgaria, and Poland all with 1.01, 0.99, and 0.96 and minimum values in Lithuania, Hungary, and Slovakia with 0.41, 0.37, and 0.28 as of May 10, 2020
Fig. 4
Fig. 4
Correlation between reduction in mobility and effective reproduction number of the COVID-19 outbreak across Europe. Purple, blue, grey, and black dots represent reduction in air traffic, driving, walking, and transit mobility; red curves show effective reproduction number R(t) with 95% confidence interval. The mean time delay Δt highlights the temporal delay between reduction in mobility and effective reproduction number. Spearman’s rank correlation ρ, measures of the statistical dependency between mobility and reproduction, and reveals the strongest correlation in the Netherlands, Germany, Ireland, Spain, and Sweden with 0.99 and 0.98
Fig. 5
Fig. 5
Parameters of the COVID-19 outbreak across Europe. Basic reproduction number R0, effective reproduction number Rt, adaptation time t and time delay Δt. The adaptation time t characterizes the time between the beginning of the outbreak and the reduction in the effective reproduction number; the time delay Δt characterizes the mean time between the reduction in air travel, driving, walking, and transit mobility and the reduction in the effective reproduction number
Fig. 6
Fig. 6
Adaptation time t between beginning of the outbreak and reduction of the effective reproduction number across Europe. The adaptation time characterizes the time between the beginning of the outbreak at 100 confirmed cases and the reduction in the effective reproduction number. It has maximum values in Bulgaria and Slovakia with 37.04 and 31.80 days and minimum values in Luxembourg and Slovenia with 5.77 and 5.64 days
Fig. 7
Fig. 7
Time delay Δt between reduction of air travel and reduction of the effective reproduction number across Europe. The time delay characterizes the mean time between the reduction in air travel, driving, walking, and transit mobility and the reduction in the effective reproduction number. It has maximum values in Bulgaria and Slovakia with 43.00 and 40.25 days and minimum values in Germany and the Netherlands both with 3.25 and 0.75 days
Fig. 8
Fig. 8
SEIR model with time-varying effective reproduction number. Increasing the basic reproduction number R0 increases the initial growth, and with it the number of cases. The temporary equilibrium for the smaller basic reproduction number of R0=2.5 is s=0.948 and r=0.052 and for the larger basic reproduction number of R0=5.0 is s=0.544 and r=0.456. Latent period A=2.5 days, infectious period C=6.5 days, basic reproduction number R0=[5.0,4.5,4.0,3.5,3.0,2.5], effective reproduction number Rt=0.75, adaptation time t=20 days, and transition time T=15 days
Fig. 9
Fig. 9
SEIR model with time-varying effective reproduction number. Increasing the reproduction number Rt decreases the effect of interventions and increases the number of cases. The temporary equilibrium for the smaller effective reproduction number of Rt=0.4 is s=0.764 and r=0.236 and for the larger effective reproduction number of R0=0.9 is s=0.594 and r=0.406. Latent period A=2.5 days, infectious period C=6.5 days, basic reproduction number R0=4.5, effective reproduction number Rt=[0.4,0.5,0.6,0.7,0.8,0.9], adaptation time t=20 days, and transition time T=15 days
Fig. 10
Fig. 10
SEIR model with time-varying effective reproduction number. Increasing the adaptation time t to interventions increases the time spent at a high reproduction number, and with it the number of cases. The temporary equilibrium for the faster adaptation of t=10 days is s=0.956 and r=0.044 and for the slower adaptation of t=22 days is s=0.550 and r=0.450. Latent period A=2.5 days, infectious period C=6.5 days, basic reproduction number R0=4.5, effective reproduction number Rt=R0/6=0.75, adaptation time t=[10,12,14,16,18,20,22] days, and transition time T=15 days
Fig. 11
Fig. 11
Time-varying effective reproduction number R(t). Comparison of constant, hyperbolic tangent, and random walk type ansatz. The constant effective reproduction number predicts an exponential increase in the number of cases that fits the initial but not for the later stages of the COVID-19 outbreak, left. The hyperbolic tangent type reproduction number predicts a smooth early increase and later saturation of the number of cases, middle. The random walk type reproduction number predicts a daily varying, non-smooth early increase and later saturation of the number of cases, right. Dots represent reported cases; orange curves illustrate fit with 95% confidence interval; red curves shows effective reproduction number with 95% confidence interval; here illustrated for the case of Austria

Update of

References

    1. Ambrosi D, BenAmar M, Cyron CJ, DeSimone A, Goriely A, Humphrey JD, Kuhl E (2019) Growth and remodelling of living tissues: perspectives, challenges, and opportunities. J R S Interface 16:20190233. 10.1098/rsif.2019.0233 - PMC - PubMed
    1. Alber M, Buganza TA, Cannon W, De S, Dura-Bernal S, Garikipati K, Karniadakis G, Lytton WW, Perdikaris P, Petzold L, Kuhl E. Integrating machine learning and multiscale modeling: perspectives, challenges, and opportunities in the biological, biomedical, and behavioral sciences. NPJ Dig Med. 2019;2:115. doi: 10.1038/s41746-019-0193-y. - DOI - PMC - PubMed
    1. Anderson RM, May RM. Directly transmitted infectious diseases: control by vaccination. Science. 1982;215:1053–1060. doi: 10.1126/science.7063839. - DOI - PubMed
    1. Apple Mobility Trends. https://www.apple.com/covid19/mobility. Accessed on 25 June 2020
    1. Arenas A, Cota W, Gomez-Gardenes J, Gomez S, Granell C, Matamalas JT, Soriano-Panos D, Steinegger B (2020) Derivation of the effective reproduction number R for COVID-19 in relation to mobility restrictions and confinement. medRxiv 10.1101/2020.04.06.20054320.

LinkOut - more resources