. 2020;66(5):1055-1068.
doi: 10.1007/s00466-020-01889-z. Epub 2020 Jul 31.

Bayesian-based predictions of COVID-19 evolution in Texas using multispecies mixture-theoretic continuum models

Affiliations

Bayesian-based predictions of COVID-19 evolution in Texas using multispecies mixture-theoretic continuum models

Prashant K Jha et al. Comput Mech. 2020.

Abstract

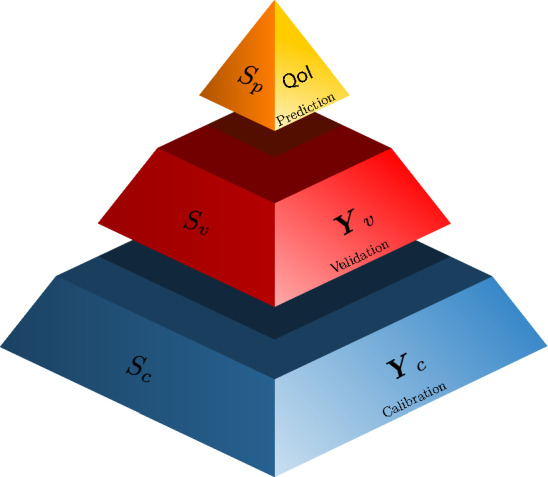
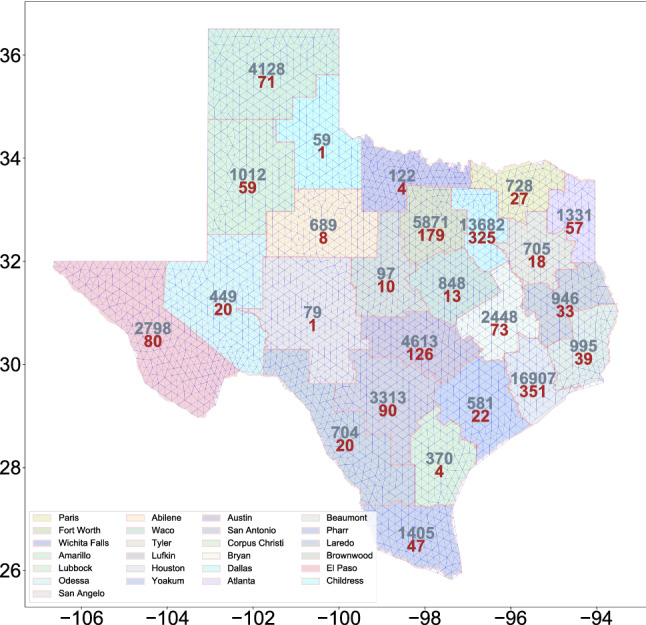
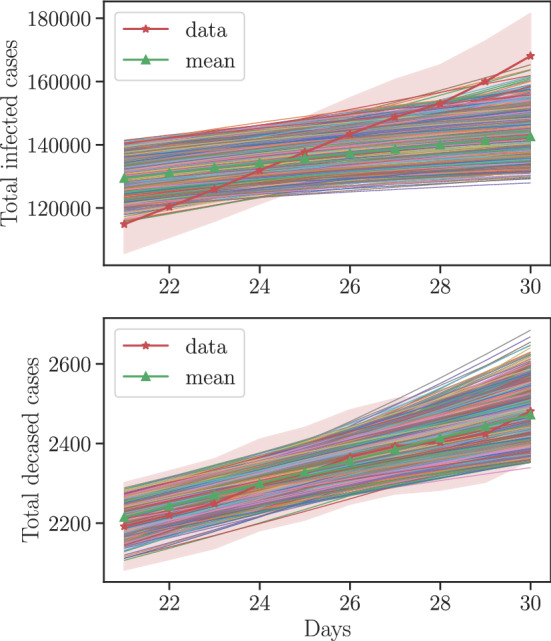
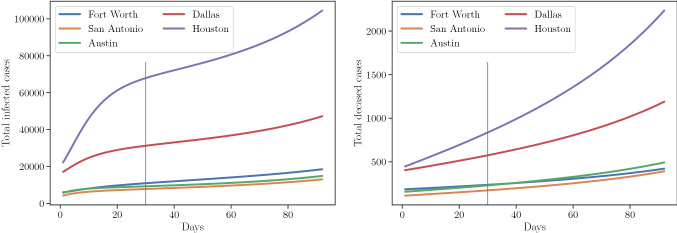
We consider a mixture-theoretic continuum model of the spread of COVID-19 in Texas. The model consists of multiple coupled partial differential reaction-diffusion equations governing the evolution of susceptible, exposed, infectious, recovered, and deceased fractions of the total population in a given region. We consider the problem of model calibration, validation, and prediction following a Bayesian learning approach implemented in OPAL (the Occam Plausibility Algorithm). Our goal is to incorporate COVID-19 data to calibrate the model in real-time and make meaningful predictions and specify the confidence level in the prediction by quantifying the uncertainty in key quantities of interests. Our results show smaller mortality rates in Texas than what is reported in the literature. We predict 7003 deceased cases by September 1, 2020 in Texas with 95 % CI 6802-7204. The model is validated for the total deceased cases, however, is found to be invalid for the total infected cases. We discuss possible improvements of the model.

Keywords: Bayesian statistics; COVID-19; Disease dynamics; Mixture theory; Model inference; SARS-CoV-2 virus.


Figures

Fig. 1
Fig. 1
Schematics of SEIRD model with 5 compartments
Fig. 2
Fig. 2
Bayesian prediction pyramid showing three levels; calibration, validation, and prediction. Model is calibrated using the data Yc obtained under the scenario Sc. Calibration scenarios are designed to test the sub-components of the model. Model is then validated using the data Yv obtained under scenario Sv. Validation scenarios are more complex as compared to calibration scenarios. Finally, the calibrated-validated model is employed to predict quantities of interest under the scenario Sp. Scenario Sp represents the conditions under which obtaining the data is either expensive or very difficult [11, 23, 24]
Fig. 3
Fig. 3
Map of the state of Texas state partitioned into 25 internal districts. The number of cases (grey) and deceased cases (red) in various districts as of 1st June 2020 is also shown. In the background, the triangulation of the map is shown
Fig. 4
Fig. 4
Sensitivity results for case when θ=(A,βe,νs,νi,R) (on left) and θ=(A,βe,νs,νi,γe,γr,γd,σ,R) (on right). Top figures show parameters with higher μ, the mean of the Morris elementary effects, for the two QoIs. Bottom figures show the QoI values at different samples. Note that the variation in total deceased cases is extremely small in setting 1
Fig. 5
Fig. 5
Results for the Bayesian calibration step. The left figure is a typical evolution of the model outputs at day 1, 10, and 20 along a MCMC chain that shows rapid mixing starting 200 samples. The red line and the red shaded region corresponds to the data and the region within one standard deviation according to the likelihood model. The right figure shows the marginalized calibration posterior densities (orange) and the marginalized calibration prior densities (blue) for each parameters of interest
Fig. 6
Fig. 6
The model outputs at the calibration posterior samples. The red line and the red shaded region corresponds to the data and the region within one standard deviation according the likelihood model. The green line corresponds to the model output at the mean of the calibration posterior samples
Fig. 7
Fig. 7
The marginalized validation posterior densities (orange) and the marginalized validation prior densities (blue) for each parameters of interest
Fig. 8
Fig. 8
The model outputs at the validation posterior samples. The red line and the red shaded region corresponds to the data and the region within one standard deviation according the likelihood model. The green line corresponds to the model output at the mean of the validation posterior samples
Fig. 9
Fig. 9
Prediction of the total infected cases and deceased cases in whole of Texas from July 1 to September 1 2020
Fig. 10
Fig. 10
Prediction of the total infected cases and deceased cases in top five districts from June 1 to September 1 2020. Left side of the vertical line correspond to the calibration plus validation days. Right side of vertical line correspond to the prediction days
Fig. 11
Fig. 11
Projection of total cases in 25 districts on August 15 (left) and September 1 (right). Red corresponds to the deceased cases and grey corresponds to the infected cases

References

    1. Alnæs MS, Blechta J, Hake J, Johansson A, Kehlet B, Logg A, Richardson C, Ring J, Rognes ME, Wells GN (2015) The fenics project version 1.5. Archive of Numerical Software 3:
    1. Anastassopoulou C, Russo L, Tsakris A, Siettos C. Data-based analysis, modelling and forecasting of the covid-19 outbreak. PloS One. 2020;15:e0230405. doi: 10.1371/journal.pone.0230405. - DOI - PMC - PubMed
    1. Backer JA, Klinkenberg D, Wallinga J. Incubation period of 2019 novel coronavirus (2019-ncov) infections among travellers from Wuhan, China, 20–28 January 2020. Eurosurveillance. 2020;25:2000062. doi: 10.2807/1560-7917.ES.2020.25.5.2000062. - DOI - PMC - PubMed
    1. Beskos A, Pinski FJ, Sanz-Serna JM, Stuart AM. Hybrid Monte Carlo on Hilbert spaces. Stoch Process Appl. 2011;121:2201–2230. doi: 10.1016/j.spa.2011.06.003. - DOI
    1. Brooks S, Gelman A, Jones G, Meng X-L. Handbook of Markov Chain Monte Carlo. Boca Raton: CRC Press; 2011.

LinkOut - more resources