. 2021 Jan;220(1):63-85.
doi: 10.1016/j.jeconom.2020.07.038. Epub 2020 Jul 30.

Identification and estimation of the SEIRD epidemic model for COVID-19

Affiliations

Identification and estimation of the SEIRD epidemic model for COVID-19

Ivan Korolev. J Econom. 2021 Jan.

Abstract

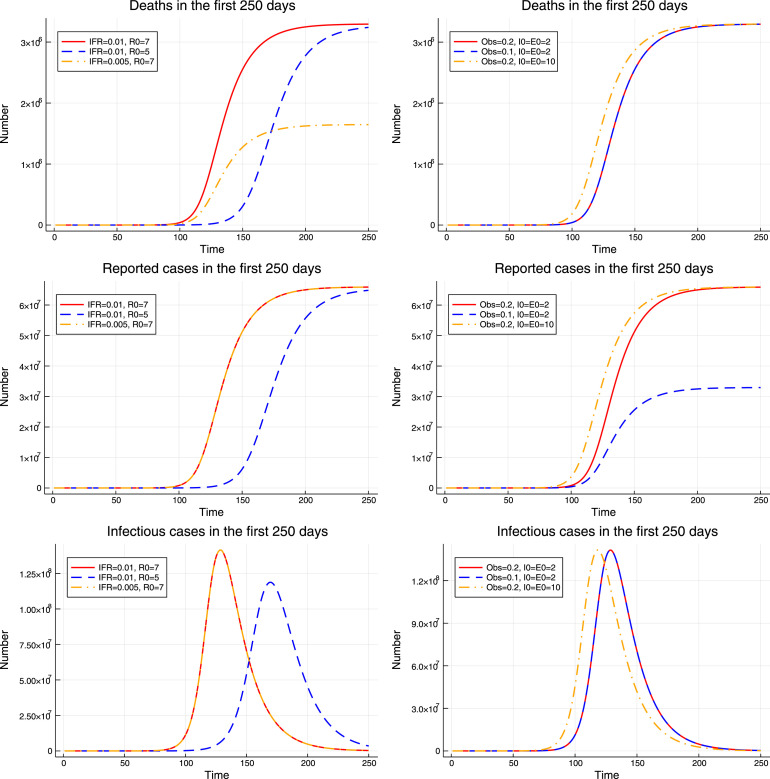
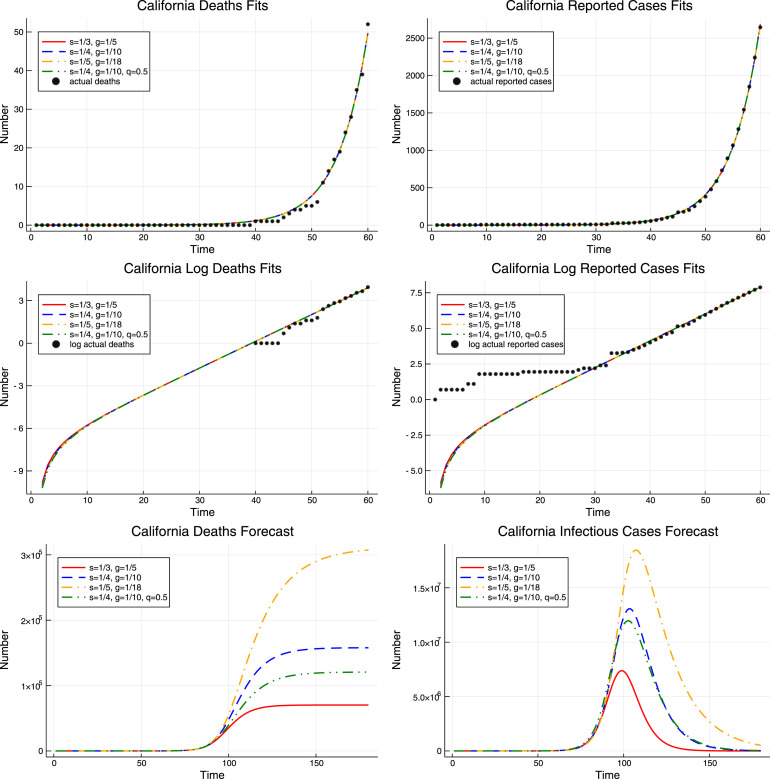
This paper studies the SEIRD epidemic model for COVID-19. First, I show that the model is poorly identified from the observed number of deaths and confirmed cases. There are many sets of parameters that are observationally equivalent in the short run but lead to markedly different long run forecasts. Second, I show that the basic reproduction number R 0 can be identified from the data, conditional on epidemiologic parameters, and propose several nonlinear SUR approaches to estimate R 0 . I examine the performance of these methods using Monte Carlo studies and demonstrate that they yield fairly accurate estimates of R 0 . Next, I apply these methods to estimate R 0 for the US, California, and Japan, and document heterogeneity in the value of R 0 across regions. My estimation approach accounts for possible underreporting of the number of cases. I demonstrate that if one fails to take underreporting into account and estimates R 0 from the reported cases data, the resulting estimate of R 0 may be biased downward and the resulting forecasts may exaggerate the long run number of deaths. Finally, I discuss how auxiliary information from random tests can be used to calibrate the initial parameters of the model and narrow down the range of possible forecasts of the future number of deaths.

Keywords: COVID-19; Parameter identification; SEIR model; Seemingly unrelated equations.


Figures

Fig. 1
Fig. 1
Parameter identification. The upper panel shows the short run number of deaths and reported cases for three sets of parameters θ1=(5,0.01,0.2,2,2,2), θ2=(5,0.005,0.1,4,4,2), and θ3=(5,0.004,0.08,2,2,10), where θ=(R0,α,λ,E0,I0,T0). The middle panel shows the long run forecasts from these models. The lower panel fixes the initial conditions and shows the short run number of deaths and reported cases for (R0,α,λ)=(5,0.01,0.2), (3,0.01,0.2), and (3,0.05,0.8).
Fig. 2
Fig. 2
Parameter identification in logarithms. The upper panel shows the logarithms of the short run number of deaths and reported cases for three sets of parameters θ1=(5,0.01,0.2,2,2,2), θ2=(5,0.005,0.1,4,4,2), and θ3=(5,0.004,0.08,2,2,10), where θ=(R0,α,λ,E0,I0,T0). The lower panel fixes the initial conditions and shows the logarithms of the short run number of deaths and reported cases for (R0,α,λ)=(5,0.01,0.2), (3,0.01,0.2), and (3,0.05,0.8).
Fig. 3
Fig. 3
Role of different parameters. The upper panel shows the evolution of the number of deaths. The middle panel shows the evolution of the number of reported cases. The lower panel shows the evolution of the (unobserved) number of infectious cases. Left: (R0,α)=(7,0.01), (5,0.01), and (7,0.005). Right: (λ,E0)=(0.2,2), (0.1,2), and (0.2,10).
Fig. 4
Fig. 4
Results for California. The upper panel shows the fit of the actual cumulative deaths and reported cases by models with four different values of epidemiologic parameters σ and γ. The middle panel shows the fit of the logarithms of the actual cumulative deaths and reported cases for the same four models. The lower panel shows the forecasts from the same four models.
Fig. 5
Fig. 5
Pessimistic and optimistic scenarios for California. The upper panel shows the fit of the actual cumulative deaths and reported cases by models with different initial conditions. The middle panel shows the fit of the logarithms of the actual cumulative deaths and reported cases by these models. The lower panel shows the forecasts from these models. The values of epidemiologic parameters are σ=14, γ=110.
Fig. 6
Fig. 6
Results for California for different values of R0. The upper panel shows the fit of the actual cumulative deaths and reported cases by models with and without underreporting and different initial conditions. The middle panel shows the fit of the logarithms of the actual cumulative deaths and reported cases by these models. The lower panel shows the forecasts from these models. The values of epidemiologic parameters are σ=14, γ=110.
Fig. 7
Fig. 7
Results for Iceland. The figure presents the results for Iceland. The left panel does not use any additional information. The right panel matches the number of active COVID-19 cases on March 21 to the one estimated based on testing a random sample of population. The upper panel shows the cumulative deaths fit by models with different initial values E0. The middle panel shows the cumulative reported cases fit by these models. The lower panel shows the deaths forecasts from these models.

References

    1. Acemoglu D., Chernozhukov V., Werning I., Whinston M.D. National Bureau of Economic Research; 2020. Optimal targeted lockdowns in a multi-group SIR model. (Working Paper Series).
    1. Atkeson A. National Bureau of Economic Research; 2020. How deadly is COVID-19? Understanding the difficulties with estimation of its fatality rate. (Working Paper Series).
    1. Atkeson A. UCLA; 2020. Lockdowns and GDP: Is there a tradeoff?
    1. Atkeson A. National Bureau of Economic Research; 2020. What will be the economic impact of COVID-19 in the US? Rough estimates of disease scenarios. (Working Paper Series).
    1. Avery C., Bossert W., Clark A., Ellison G., Ellison S.F. Policy implications of models of the spread of coronavirus: perspectives and opportunities for economists. COVID Econ. 2020;12:21–68.

LinkOut - more resources