

Forecasting and planning during a pandemic: COVID-19 growth rates, supply chain disruptions, and governmental decisions
- PMID: 32836717
- PMCID: PMC7413852
- DOI: 10.1016/j.ejor.2020.08.001
Forecasting and planning during a pandemic: COVID-19 growth rates, supply chain disruptions, and governmental decisions
Abstract
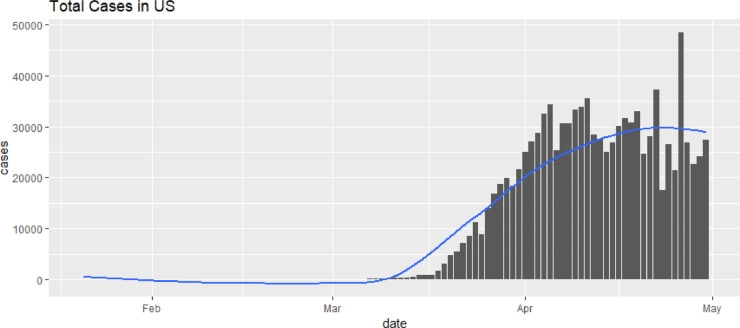
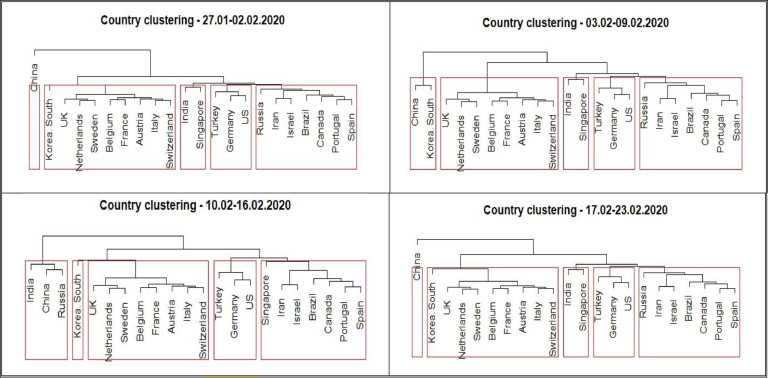
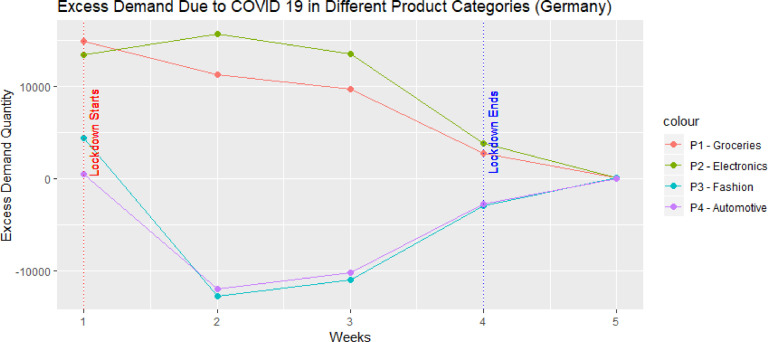
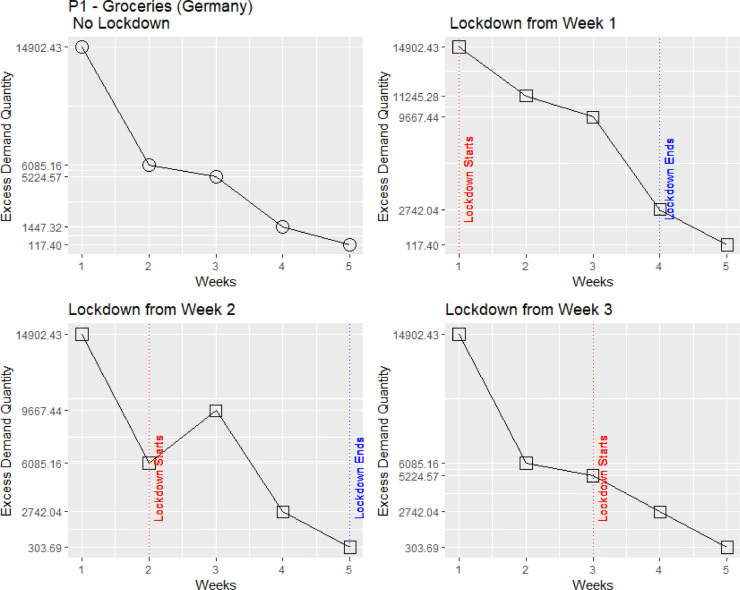
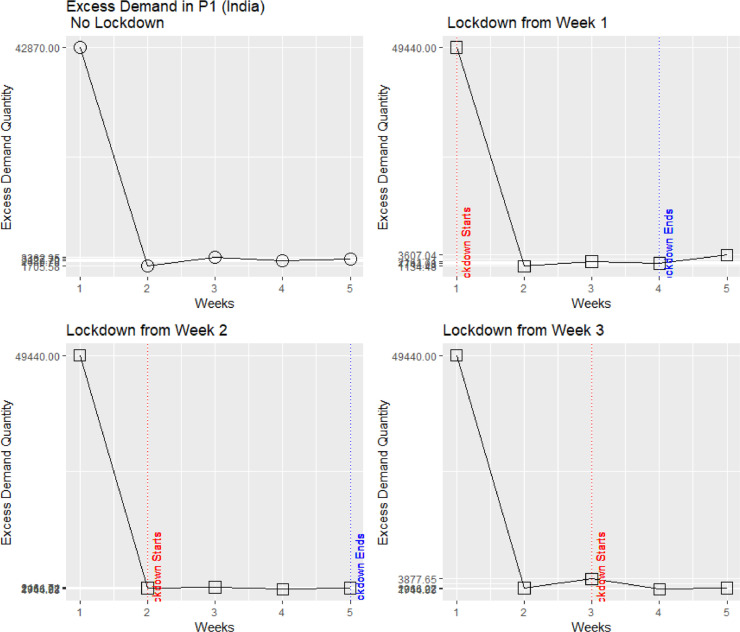
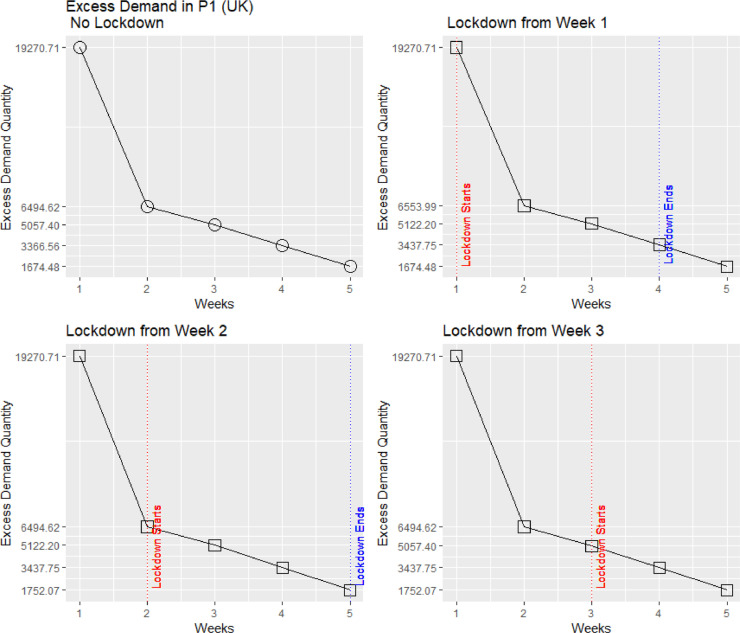
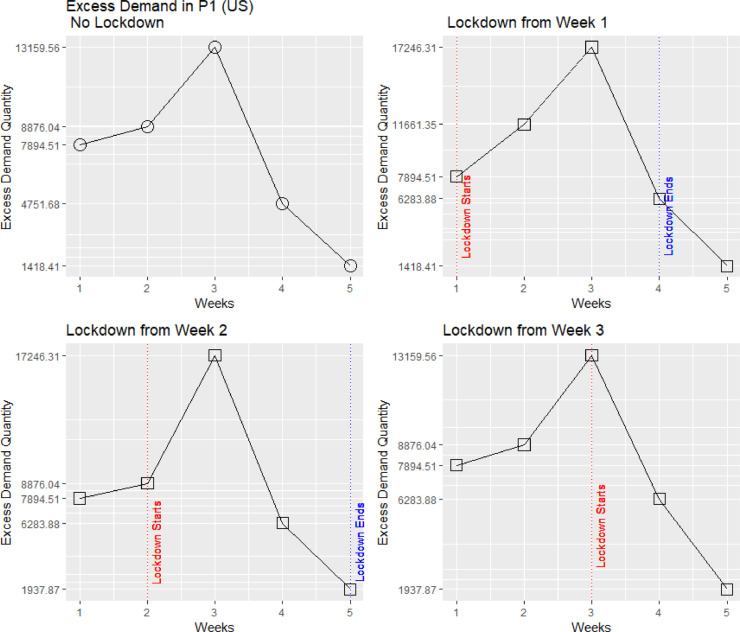
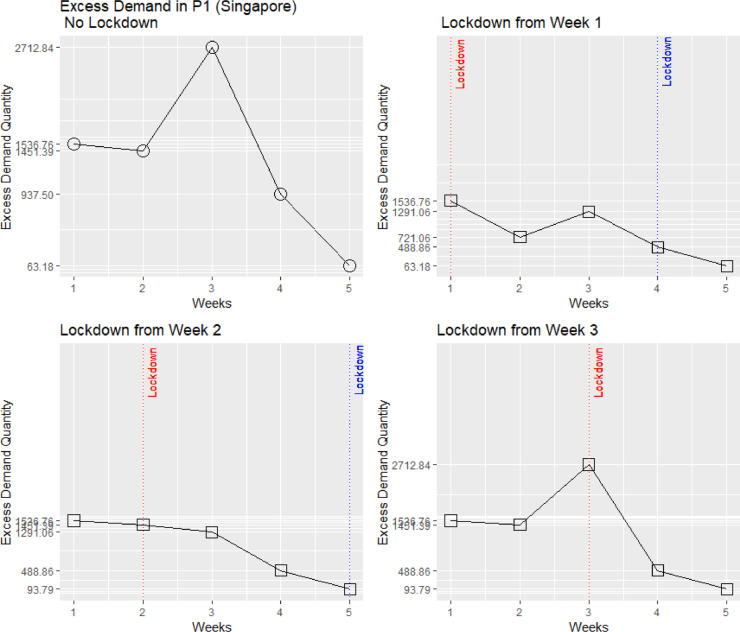
Policymakers during COVID-19 operate in uncharted territory and must make tough decisions. Operational Research - the ubiquitous 'science of better' - plays a vital role in supporting this decision-making process. To that end, using data from the USA, India, UK, Germany, and Singapore up to mid-April 2020, we provide predictive analytics tools for forecasting and planning during a pandemic. We forecast COVID-19 growth rates with statistical, epidemiological, machine- and deep-learning models, and a new hybrid forecasting method based on nearest neighbors and clustering. We further model and forecast the excess demand for products and services during the pandemic using auxiliary data (google trends) and simulating governmental decisions (lockdown). Our empirical results can immediately help policymakers and planners make better decisions during the ongoing and future pandemics.
Keywords: COVID-19; Excess demand; Forecasting; Lockdown; Pandemic.
© 2020 Elsevier B.V. All rights reserved.
Figures
Similar articles
-
A COVID-19 Pandemic Artificial Intelligence-Based System With Deep Learning Forecasting and Automatic Statistical Data Acquisition: Development and Implementation Study.J Med Internet Res. 2021 May 20;23(5):e27806. doi: 10.2196/27806. J Med Internet Res. 2021. PMID: 33900932 Free PMC article.
-
COVID-19: Short-term forecast of ICU beds in times of crisis.PLoS One. 2021 Jan 13;16(1):e0245272. doi: 10.1371/journal.pone.0245272. eCollection 2021. PLoS One. 2021. PMID: 33439917 Free PMC article.
-
Machine learning techniques to detect and forecast the daily total COVID-19 infected and deaths cases under different lockdown types.Microsc Res Tech. 2021 Jul;84(7):1462-1474. doi: 10.1002/jemt.23702. Epub 2021 Feb 1. Microsc Res Tech. 2021. PMID: 33522669 Free PMC article.
-
Forecasting ward-level bed requirements to aid pandemic resource planning: Lessons learned and future directions.Health Care Manag Sci. 2023 Sep;26(3):477-500. doi: 10.1007/s10729-023-09639-2. Epub 2023 May 18. Health Care Manag Sci. 2023. PMID: 37199873 Free PMC article.
-
Uncertainty quantification in epidemiological models for the COVID-19 pandemic.Comput Biol Med. 2020 Oct;125:104011. doi: 10.1016/j.compbiomed.2020.104011. Epub 2020 Sep 25. Comput Biol Med. 2020. PMID: 33091766 Free PMC article.
Cited by
-
A Novel Approach for the Early Detection of Medical Resource Demand Surges During Health Care Emergencies: Infodemiology Study of Tweets.JMIR Form Res. 2024 Jan 29;8:e46087. doi: 10.2196/46087. JMIR Form Res. 2024. PMID: 38285495 Free PMC article.
-
Price overreactions in the commodity futures market: An intraday analysis of the Covid-19 pandemic impact.Resour Policy. 2021 Jun;71:101966. doi: 10.1016/j.resourpol.2020.101966. Epub 2021 Jan 15. Resour Policy. 2021. PMID: 36569184 Free PMC article.
-
The Allocation Method for Personal Protective Equipment in the Emerging Infectious Disease Environment.Front Public Health. 2022 May 27;10:904569. doi: 10.3389/fpubh.2022.904569. eCollection 2022. Front Public Health. 2022. PMID: 35712292 Free PMC article.
-
Novel spatiotemporal feature extraction parallel deep neural network for forecasting confirmed cases of coronavirus disease 2019.Socioecon Plann Sci. 2022 Mar;80:100976. doi: 10.1016/j.seps.2020.100976. Epub 2020 Nov 25. Socioecon Plann Sci. 2022. PMID: 33250530 Free PMC article.
-
Understanding systemic disruption from the Covid-19-induced semiconductor shortage for the auto industry.Omega. 2022 Dec;113:102720. doi: 10.1016/j.omega.2022.102720. Epub 2022 Jun 29. Omega. 2022. PMID: 35966134 Free PMC article.
References
-
- Al-Shammari A.A.A., Ali H., Al-Ahmad B., Al-Refaei F.H., Al-Sabah S., Jamal M.H. Real-time tracking and forecasting of the COVID-19 outbreak in Kuwait: A mathematical modeling study. MedRxiv. 2020 doi: 10.1101/2020.05.03.20089771. 05.03.20089771. - DOI
-
- Andersson E., Schiöler L., Frisén M., Kühlmann-Berenzon S., Linde A., Rubinova S. Predictions by early indicators of the time and height of the peaks of yearly influenza outbreaks in Sweden. Scandinavian Journal of Public Health. 2008;36(5):475–482. - PubMed
-
- Araz O.M., Choi T.-.M., Olson D., Salman F.S. Data analytics for operational risk management. Decision Sciences. 2020 In press https://onlinelibrary.wiley.com/doi/abs/10.1111/deci.12443< https://nam03.safelinks.protection.outlook.com/?url=https%3A%2F%2Fonline...>. - DOI
-
- Beliën J., Forcé H. Supply chain management of blood products: A literature review. European Journal of Operational Research. 2012;217(1):1–16.
LinkOut - more resources
Full Text Sources
Other Literature Sources
Miscellaneous