. 2020;101(3):2003-2012.
doi: 10.1007/s11071-020-05736-x. Epub 2020 Jun 14.

The impact of asymptomatic individuals on the strength of public health interventions to prevent the second outbreak of COVID-19

Affiliations

The impact of asymptomatic individuals on the strength of public health interventions to prevent the second outbreak of COVID-19

Xiaochen Wang et al. Nonlinear Dyn. 2020.

Abstract

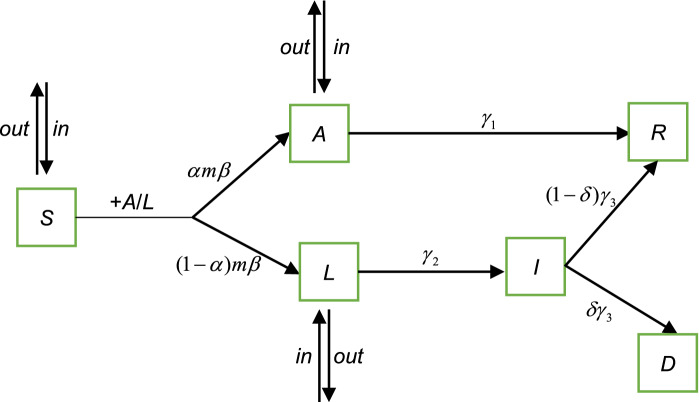
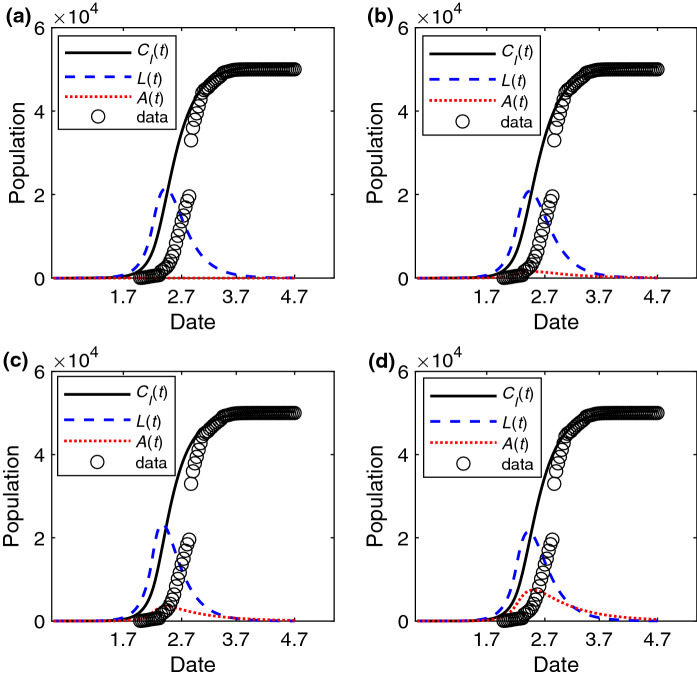
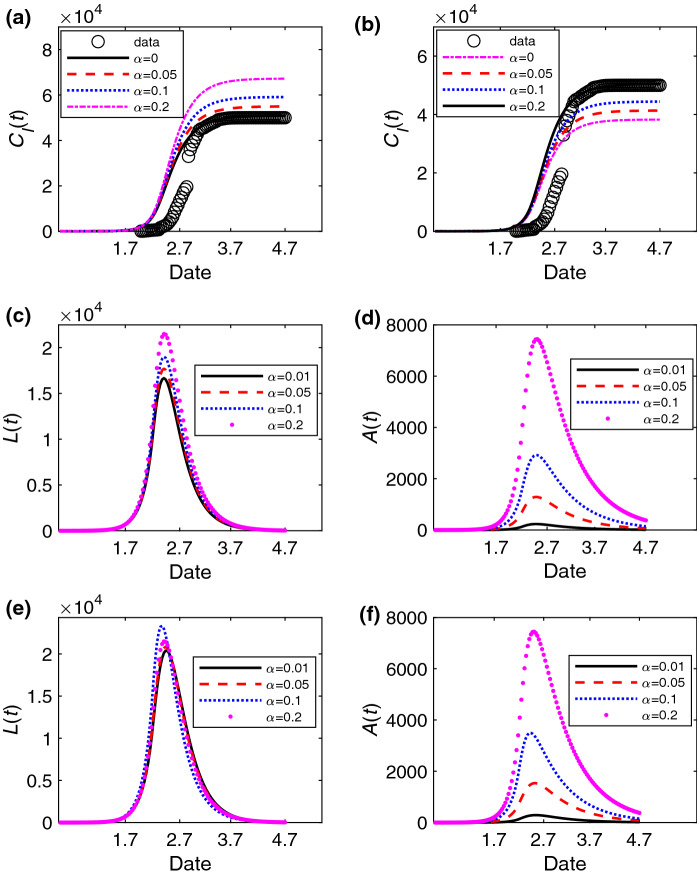
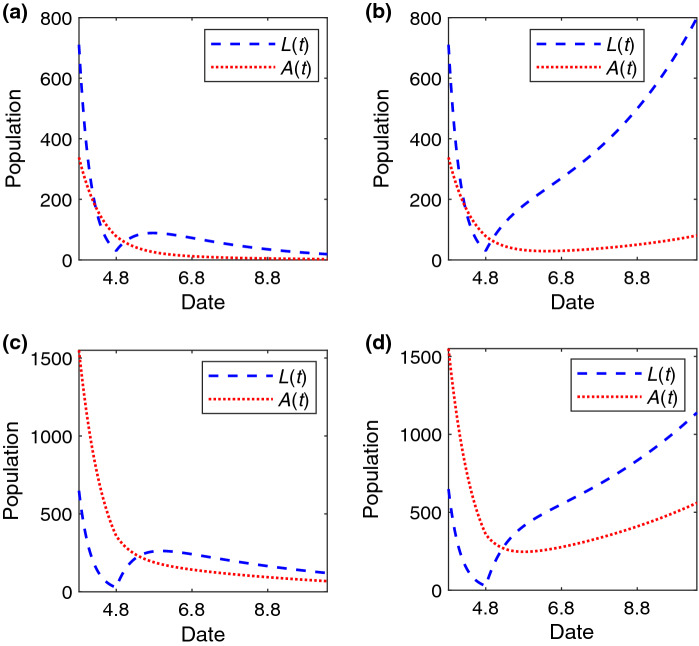
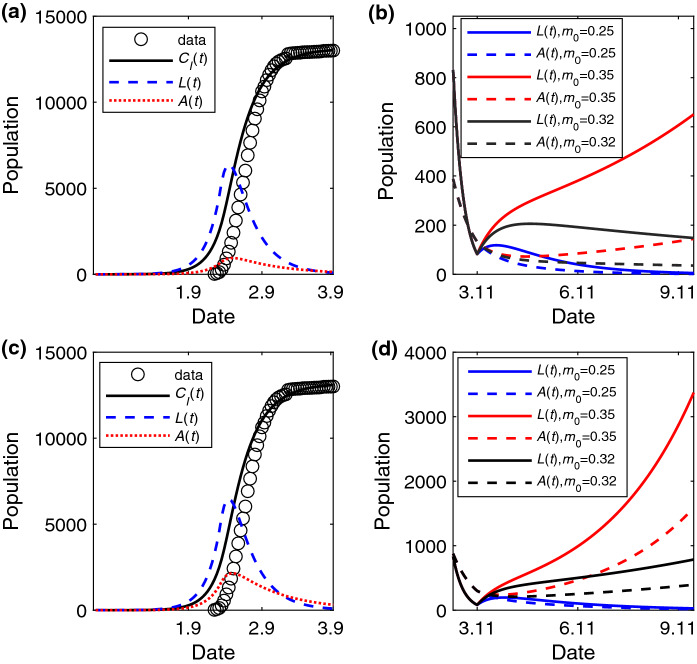
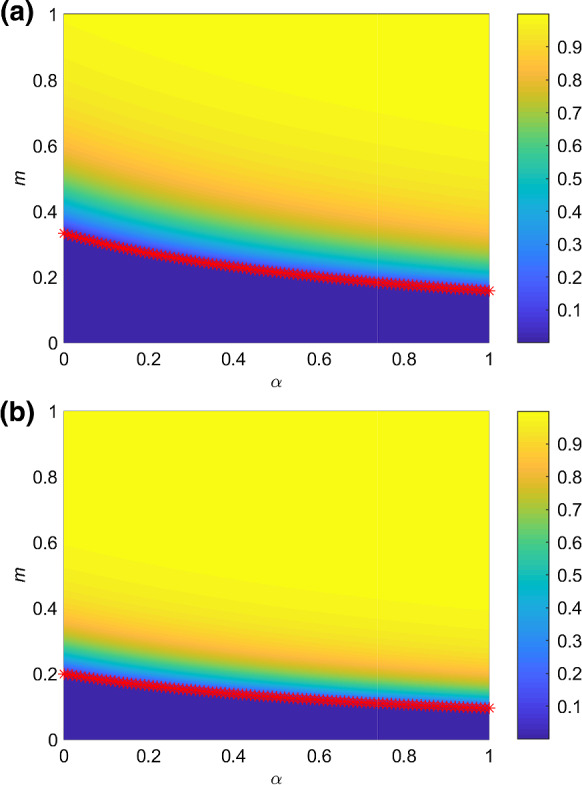
The pandemic of coronavirus disease 2019 (COVID-19) has threatened the social and economic structure all around the world. Generally, COVID-19 has three possible transmission routes, including pre-symptomatic, symptomatic and asymptomatic transmission, among which the last one has brought a severe challenge for the containment of the disease. One core scientific question is to understand the influence of asymptomatic individuals and of the strength of control measures on the evolution of the disease, particularly on a second outbreak of the disease. To explore these issues, we proposed a novel compartmental model that takes the infection of asymptomatic individuals into account. We get the relationship between asymptomatic individuals and critical strength of control measures theoretically. Furthermore, we verify the reliability of our model and the accuracy of the theoretical analysis by using the real confirmed cases of COVID-19 contamination. Our results, showing the importance of the asymptomatic population on the control measures, would provide useful theoretical reference to the policymakers and fuel future studies of COVID-19.

Keywords: Asymptomatic individuals; COVID-19; Control measures; SIR-typed model; Second outbreak.


Conflict of interest statement

Conflict of interestThe authors declare that they have no conflict of interests.

Figures

Fig. 1
Fig. 1
The sketch of the SALIR model. Individuals are divided into five states in the SALIR model at each time step: S, A, L, I and R. S represents the susceptible state, A represents the asymptomatic state, L represents the latent state before symptoms appear or symptomatic state before quarantine or hospitalization, I indicates the infected state, but the individuals in the state have been quarantined or hospitalized, and R is the recovered state. D represents that individuals die of COVID-19. The transition between different states is explained in the main text: (E1)–(E7)
Fig. 2
Fig. 2
The change of epidemic features with time for different αs. The fitting epidemic curve CI(t), the number of individuals in the L state L(t) and in the A state A(t) versus time (unit: day) with the estimated parameters a β=0.305, λ=0.16 when α=0, b β=0.302, λ=0.15 when α=0.05, c β=0.307, λ=0.22 when α=0.1, d β=0.3, λ=0.17 when α=0.2. The data is the cumulative number of confirmed cases of Wuhan. The values of other parameters are set to: γ1=121, γ2=110, γ3=115, δ=0.03, l=0.0083 before January 23, 2020, and l=0 later
Fig. 3
Fig. 3
The change of the number of infected individuals in different states versus time (unit: day) with different αs. The change of the cumulative number CI(t) of individuals in the I state for different αs with the estimated parameters a β=0.305, λ=0.16, b β=0.3, λ=0.17. The change of the number of individuals in the L state and A state with different αs at β=0.3, λ=0.17 in (c) and (d), and with the estimated parameters β=0.302, λ=0.14 when α=0.01; β=0.302, λ=0.15 when α=0.05; β=0.307, λ=0.22 when α=0.1; β=0.3, λ=0.17 when α=0.2 in (e) and (f). The data is the cumulative number of confirmed cases of Wuhan in (a) and (b). The values of other parameters are set as: γ1=121, γ2=110, γ3=115, δ=0.03, l=0.0083 before January 23, 2020, and l=0 later
Fig. 4
Fig. 4
The change of A(t) and L(t) versus time (unit: day) under different m0 after lifting the lockdown of the Wuhan. The temporal trend of the number of individuals in the A and L state when a α=0.05, m0=0.27, b α=0.05, m0=0.35, c α=0.2, m0=0.25 and d α=0.2, m0=0.3. The values of other parameters are set to: γ1=121, γ2=110, γ3=115, δ=0.03, l=0.0083 before January 23, 2020, and l=0 later
Fig. 5
Fig. 5
The change of epidemic features with time for different α and m0. The fitting epidemic curve CI(t), the number of individuals in the L state L(t) and in the A state A(t) versus time (unit: day) with the estimated parameters β=0.273, λ=0.29 when α=0.1 in (a) and (b), and β=0.271, λ=0.3 when α=0.2 in (c) and (d). The change of A(t) and L(t) with different m0 in (b) and (d). The data is the cumulative number of confirmed cases of China except for Hubei province in (a) and (c). The values of other parameters are set as: γ1=121, γ2=110, γ3=115, δ=0.03, l=0
Fig. 6
Fig. 6
The color-coded values of total proportion of infected individuals who are recovered or dead at the end of the epidemic spreading in the parameter plane (α,m). m is the strength of control measures and is unchanged with time. The red asterisks indicate the value of mc with different α according to Eq. (3). The spreading probability is a β=0.3 and b β=0.5. The values of other parameters are set as: γ1=121, γ2=110, γ3=115, δ=0.03, l=0

References

    1. Coronavirus disease 2019 (COVID-19) Situation Report - 124 (World Health Organization). https://www.who.int/docs/default-source/coronaviruse/situation-reports/2... - PubMed
    1. Hellewell J, Abbott S, Gimma A, Bosse NI, Jarvis CI, Russell TW, Munday JD, Kucharski AJ, Edmunds WJ, Sun F, et al. Feasibility of controlling COVID-19 outbreaks by isolation of cases and contacts. Lancet Glob. Health. 2020 doi: 10.1016/S2214-109X(20)30074-7. - DOI - PMC - PubMed
    1. Tian H, Liu Y, Li Y, Wu CH, Chen B, Kraemer MU, Li B, Cai J, Xu B, Yang Q, et al. An investigation of transmission control measures during the first 50 days of the COVID-19 epidemic in China. Science. 2020;368(6491):638. doi: 10.1126/science.abb6105. - DOI - PMC - PubMed
    1. Van Bavel JJ, Baicker K, Boggio PS, Capraro V, Cichocka A, Cikara M, Crockett MJ, Crum AJ, Douglas KM, Druckman JN, et al. Using social and behavioural science to support COVID-19 pandemic response. Nat. Hum. Behav. 2020 doi: 10.1038/s41562-020-0884-z. - DOI - PubMed
    1. Johnson NF, Velásquez N, Restrepo NJ, Leahy R, Gabriel N, El Oud S, Zheng M, Manrique P, Wuchty S, Lupu Y. The online competition between pro-and anti-vaccination views. Nature. 2020 doi: 10.1038/s41586-020-2281-1. - DOI - PubMed

LinkOut - more resources