

The Impact of the Wuhan Covid-19 Lockdown on Air Pollution and Health: A Machine Learning and Augmented Synthetic Control Approach
- PMID: 32836865
- PMCID: PMC7416596
- DOI: 10.1007/s10640-020-00483-4
The Impact of the Wuhan Covid-19 Lockdown on Air Pollution and Health: A Machine Learning and Augmented Synthetic Control Approach
Abstract
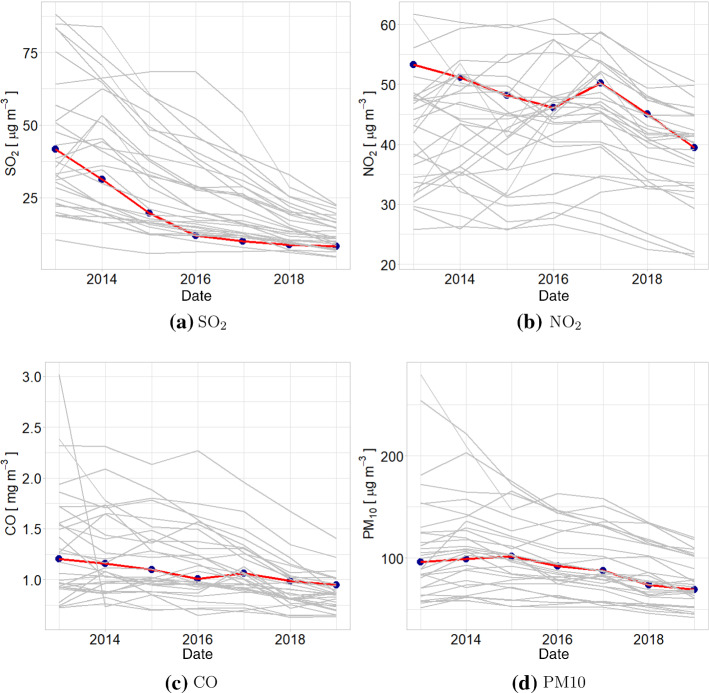
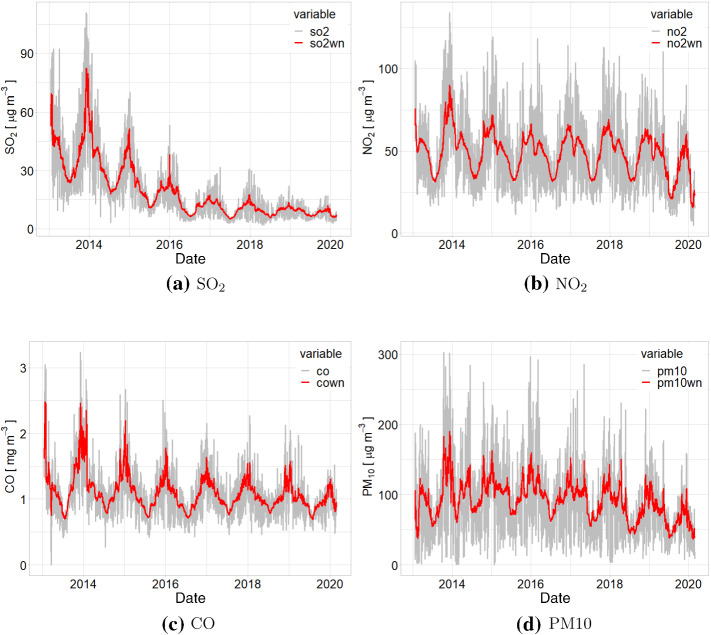
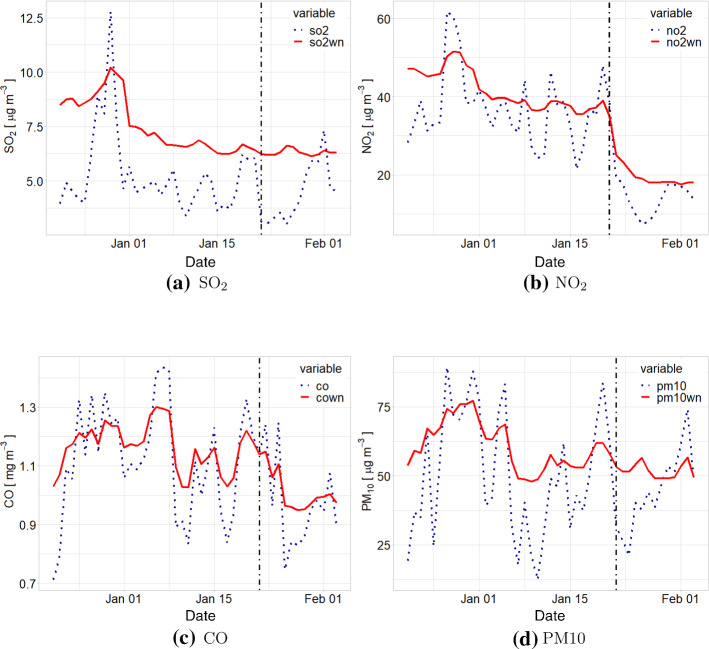
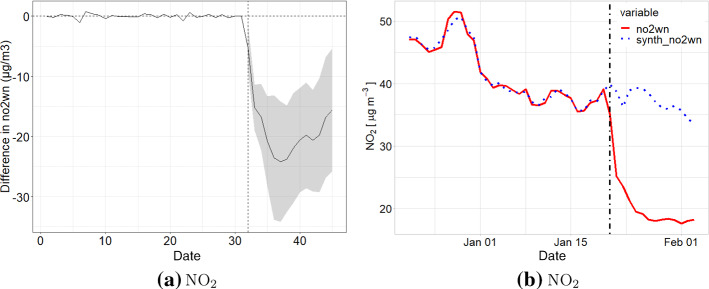
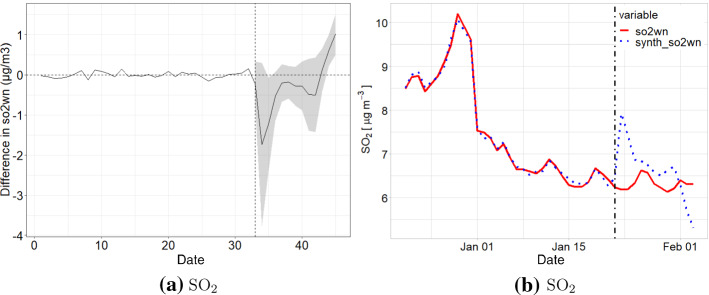
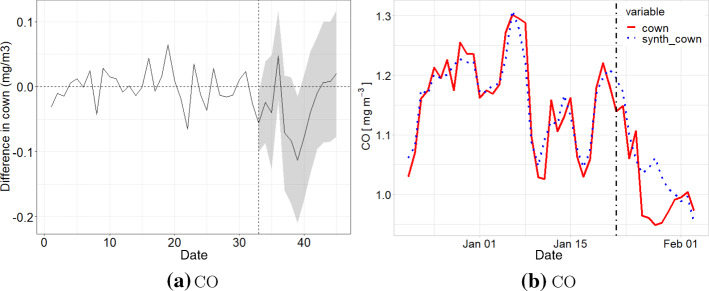
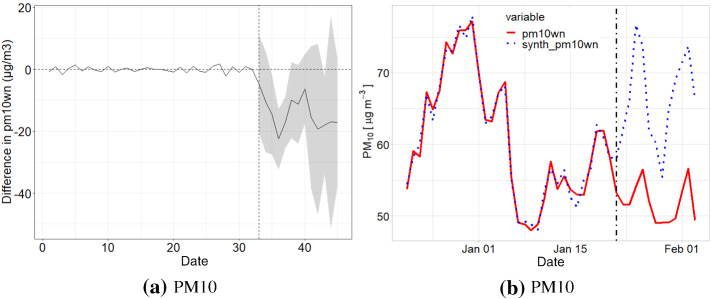
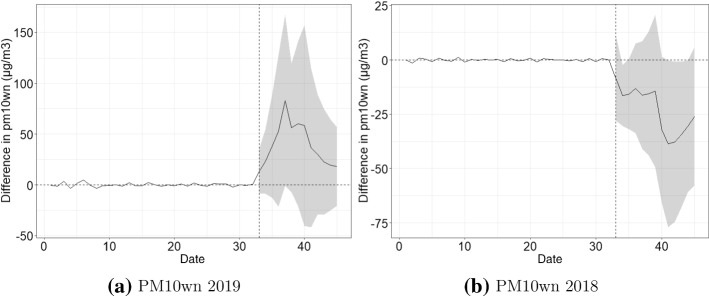
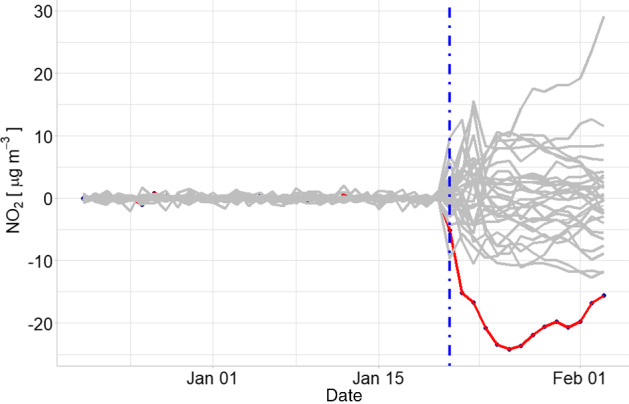
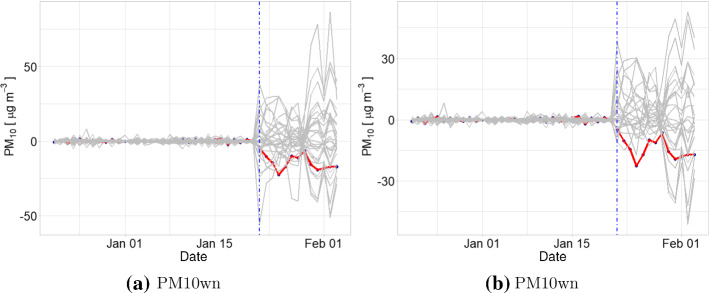
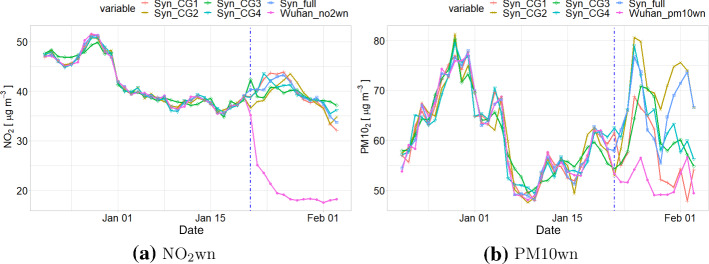
We quantify the impact of the Wuhan Covid-19 lockdown on concentrations of four air pollutants using a two-step approach. First, we use machine learning to remove the confounding effects of weather conditions on pollution concentrations. Second, we use a new augmented synthetic control method (Ben-Michael et al. in The augmented synthetic control method. University of California Berkeley, Mimeo, 2019. https://arxiv.org/pdf/1811.04170.pdf) to estimate the impact of the lockdown on weather normalised pollution relative to a control group of cities that were not in lockdown. We find NO concentrations fell by as much as 24 g/m during the lockdown (a reduction of 63% from the pre-lockdown level), while PM10 concentrations fell by a similar amount but for a shorter period. The lockdown had no discernible impact on concentrations of SO or CO. We calculate that the reduction of NO concentrations could have prevented as many as 496 deaths in Wuhan city, 3368 deaths in Hubei province and 10,822 deaths in China as a whole.
Keywords: Air pollution; Covid-19; Health; Machine learning; Synthetic control.
© Springer Nature B.V. 2020.
Conflict of interest statement
Conflict of interestThe authors declare that they have no known competing financial interests or personal relationships that could have appeared to influence the work reported in this paper.
Figures

References
-
- Abadie A. Using synthetic controls: feasibility, data requirements, and methodological aspects. MIT: Technical report; 2019.
-
- Abadie A, Gardeazabal J. The economic costs of conflict: a case study of the Basque Country. Am Econ Rev. 2003;93(1):113–132. doi: 10.1257/000282803321455188. - DOI
-
- Abadie A, Diamond A, Hainmueller J. Comparative politics and the synthetic control method. Am J Political Science. 2015;59(2):495–510. doi: 10.1111/ajps.12116. - DOI
-
- Anh V, Duc H, Azzi M. Modeling anthropogenic trends in air quality data. J Air Waste Manag Assoc. 1997;47:66–71. doi: 10.1080/10473289.1997.10464406. - DOI
LinkOut - more resources
Full Text Sources
Research Materials