

Co-variance nexus between COVID-19 mortality, humidity, and air quality index in Wuhan, China: New insights from partial and multiple wavelet coherence
- PMID: 32837610
- PMCID: PMC7279636
- DOI: 10.1007/s11869-020-00847-1
Co-variance nexus between COVID-19 mortality, humidity, and air quality index in Wuhan, China: New insights from partial and multiple wavelet coherence
Abstract
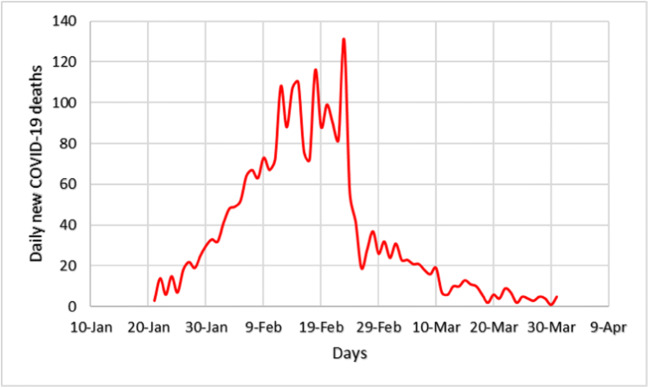
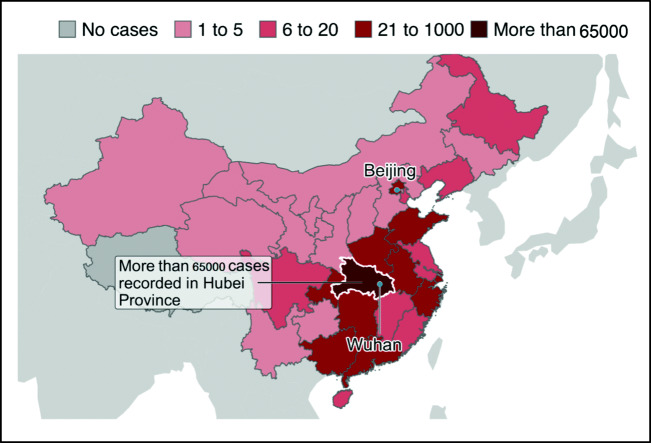
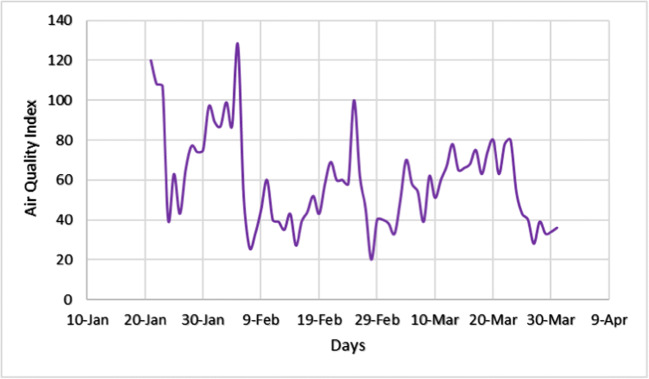
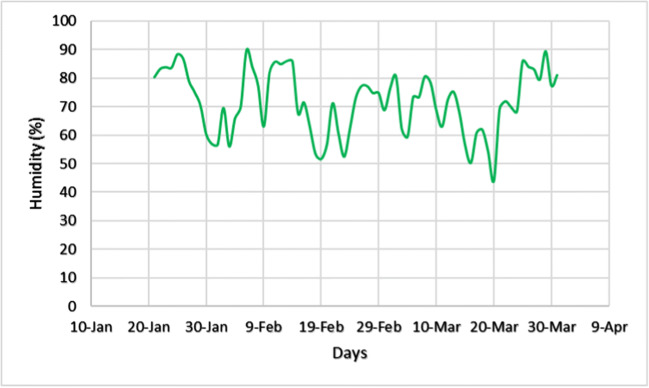
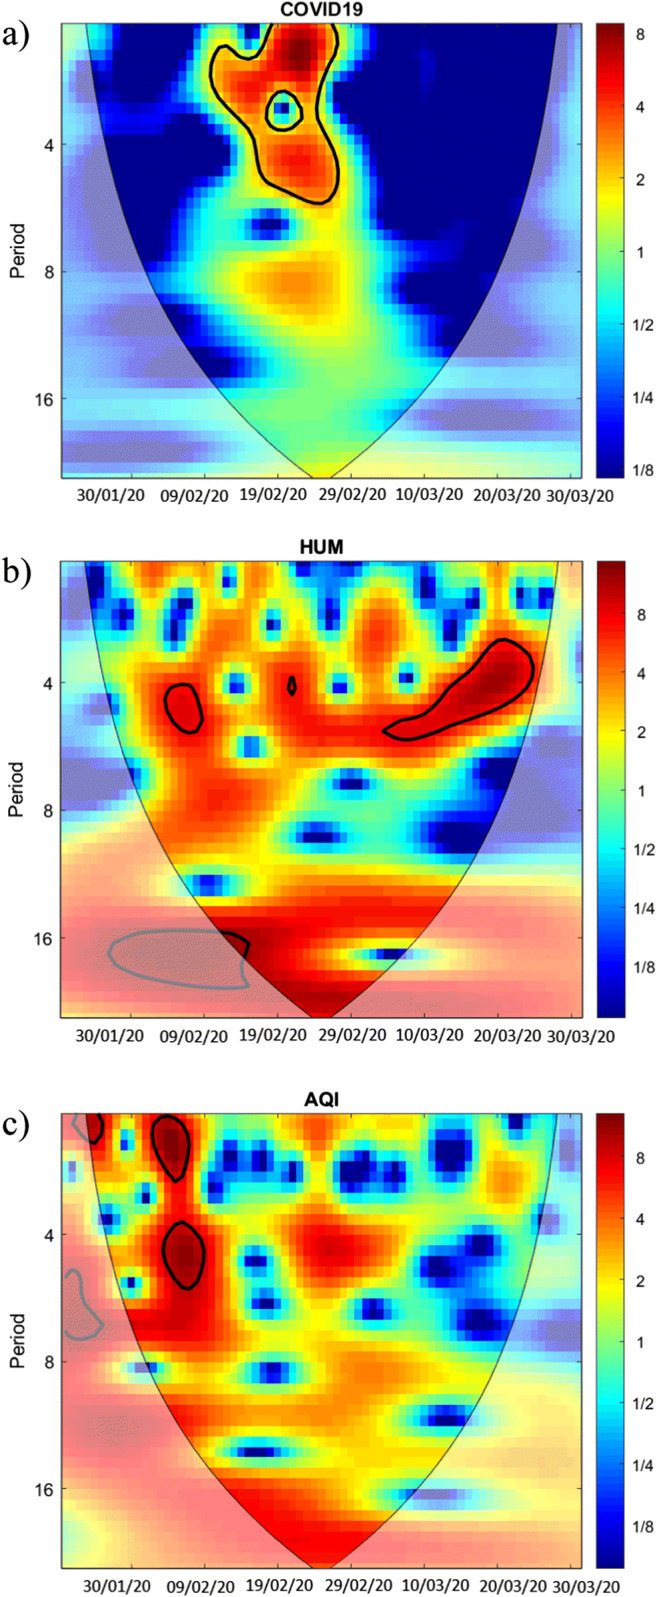
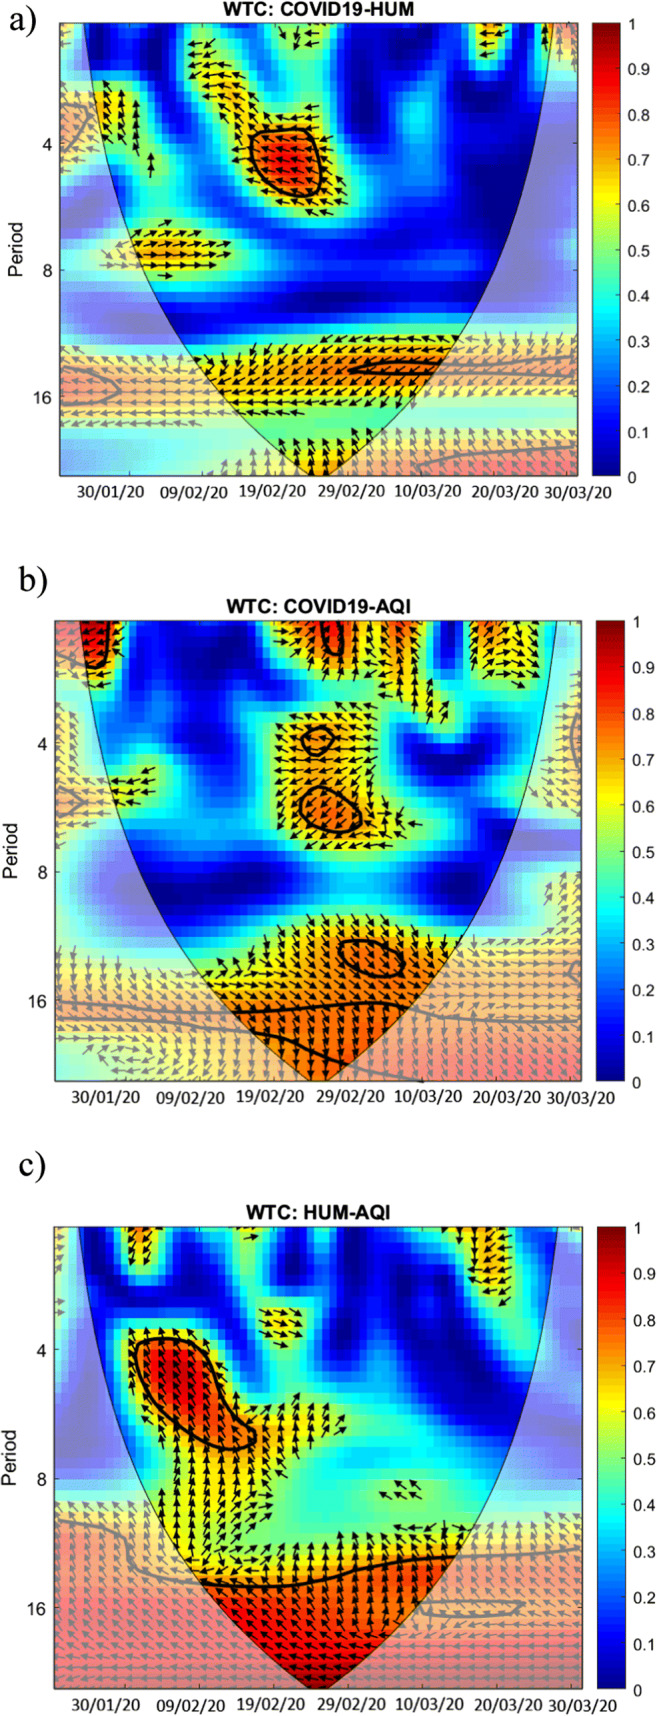
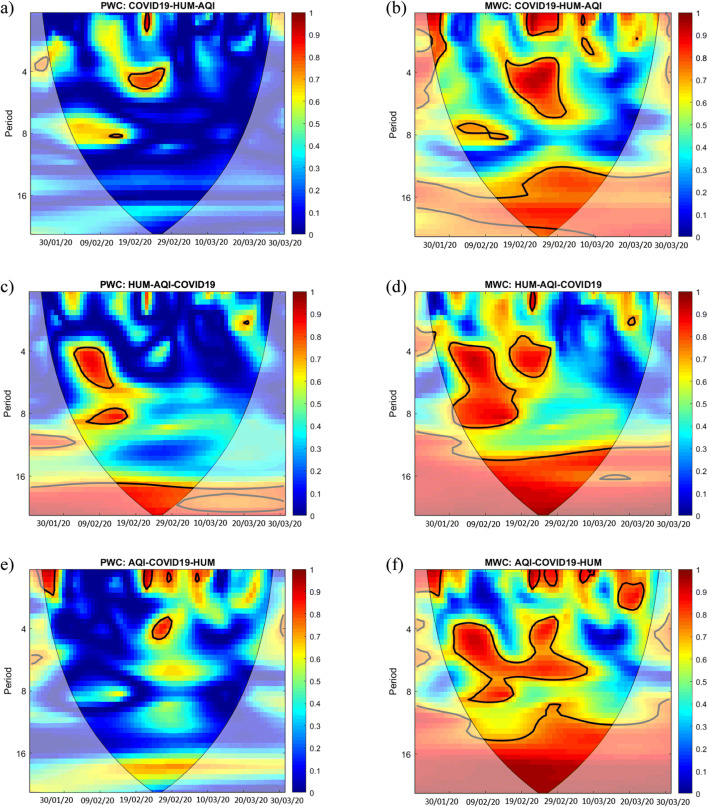
The worldwide outbreak of COVID-19 disease has caused immense damage to our health and economic and social life. This research article helps to determine the impact of climate on the lethality of this disease. Air quality index and average humidity are selected from the family of climate variables, to determine its impact on the daily new cases of COVID-19-related deaths in Wuhan, China. We have used wavelet analysis (wavelet transform coherence (WTC), partial (PWC), and multiple wavelet coherence (MWC), due to its advantages over traditional time series methods, to study the co-movement nexus between our selected data series. Findings suggest a notable coherence between air quality index, humidity, and mortality in Wuhan during a recent outbreak. Humidity is negatively related to the COVID-19-related deaths, and bad air quality leads to an increase in this mortality. These findings are important for policymakers to save precious human lives by better understanding the interaction of the environment with the COVID-19 disease.
Keywords: Air quality index; COVID-19 mortality; Humidity; Partial and multiple wavelet coherence; Wuhan.
© Springer Nature B.V. 2020.
Figures
Similar articles
-
The nexus between COVID-19, temperature and exchange rate in Wuhan city: New findings from partial and multiple wavelet coherence.Sci Total Environ. 2020 Aug 10;729:138916. doi: 10.1016/j.scitotenv.2020.138916. Epub 2020 Apr 22. Sci Total Environ. 2020. PMID: 32388129 Free PMC article.
-
Investigating the Co-movement Nexus Between Air Quality, Temperature, and COVID-19 in California: Implications for Public Health.Front Public Health. 2021 Dec 23;9:815248. doi: 10.3389/fpubh.2021.815248. eCollection 2021. Front Public Health. 2021. PMID: 35004602 Free PMC article.
-
Correlations between COVID-19 cases and temperature, air humidity, and social isolating rate with cross wavelet transform and wavelet coherence: Case study of New York and São Paulo cities.Chaos. 2023 Aug 1;33(8):083104. doi: 10.1063/5.0160009. Chaos. 2023. PMID: 38060787
-
A review of the impact of environmental factors and pollutants on covid-19 transmission.Aerobiologia (Bologna). 2022;38(3):277-286. doi: 10.1007/s10453-022-09748-5. Epub 2022 Jun 23. Aerobiologia (Bologna). 2022. PMID: 35761858 Free PMC article. Review.
-
Air quality during the COVID-19: PM2.5 analysis in the 50 most polluted capital cities in the world.Environ Pollut. 2020 Nov;266(Pt 1):115042. doi: 10.1016/j.envpol.2020.115042. Epub 2020 Jul 3. Environ Pollut. 2020. PMID: 32650158 Free PMC article. Review.
Cited by
-
Geographically weighted regression model for physical, social, and economic factors affecting the COVID-19 pandemic spreading.Environ Sci Pollut Res Int. 2022 Jul;29(34):51507-51520. doi: 10.1007/s11356-022-18564-w. Epub 2022 Mar 4. Environ Sci Pollut Res Int. 2022. PMID: 35246792 Free PMC article.
-
Climate indicators and COVID-19 recovery: A case of Wuhan during the lockdown.Environ Dev Sustain. 2022;24(6):8464-8484. doi: 10.1007/s10668-021-01794-2. Epub 2021 Sep 23. Environ Dev Sustain. 2022. PMID: 34580574 Free PMC article.
-
COVID-19 vaccine reluctance and possible driving factors: A comparative assessment among pregnant and non-pregnant women.Front Public Health. 2023 Jan 9;10:1100130. doi: 10.3389/fpubh.2022.1100130. eCollection 2022. Front Public Health. 2023. PMID: 36699898 Free PMC article.
-
Exploring the co-movements between COVID-19 pandemic and international air traffic: A global perspective based on wavelet analysis.Int Migr. 2022 Jun 9:10.1111/imig.13026. doi: 10.1111/imig.13026. Online ahead of print. Int Migr. 2022. PMID: 35935684 Free PMC article.
-
Silent cries behind closed doors: An online empirical assessment of fear of COVID-19, situational depression, and quality of life among Pakistani citizens.J Public Aff. 2021 Nov;21(4):e2716. doi: 10.1002/pa.2716. Epub 2021 Jul 4. J Public Aff. 2021. PMID: 34512182 Free PMC article.
References
-
- Aloui C, Hkiri B, Hammoudeh S, Shahbaz M (2018) A multiple and partial wavelet analysis of the oil price, inflation, exchange rate, and economic growth nexus in Saudi Arabia. Emerg Mark Financ Trade 54(4):935–956
-
- Anderson HR, Favarato G, Atkinson RW. Long-term exposure to air pollution and the incidence of asthma: meta-analysis of cohort studies. Air Qual Atmos Heal. 2013;6:47–56. doi: 10.1007/s11869-011-0144-5. - DOI
-
- Contini D (2020) Does air pollution influence COVID-19 outbreaks?. 1:19–23
Publication types
LinkOut - more resources
Full Text Sources
Research Materials