Review
. 2020;6(3):95-119.
doi: 10.1007/s40641-020-00160-0. Epub 2020 Aug 18.

Tracking Improvement in Simulated Marine Biogeochemistry Between CMIP5 and CMIP6

Affiliations
Review

Tracking Improvement in Simulated Marine Biogeochemistry Between CMIP5 and CMIP6

Roland Séférian et al. Curr Clim Change Rep. 2020.

Abstract

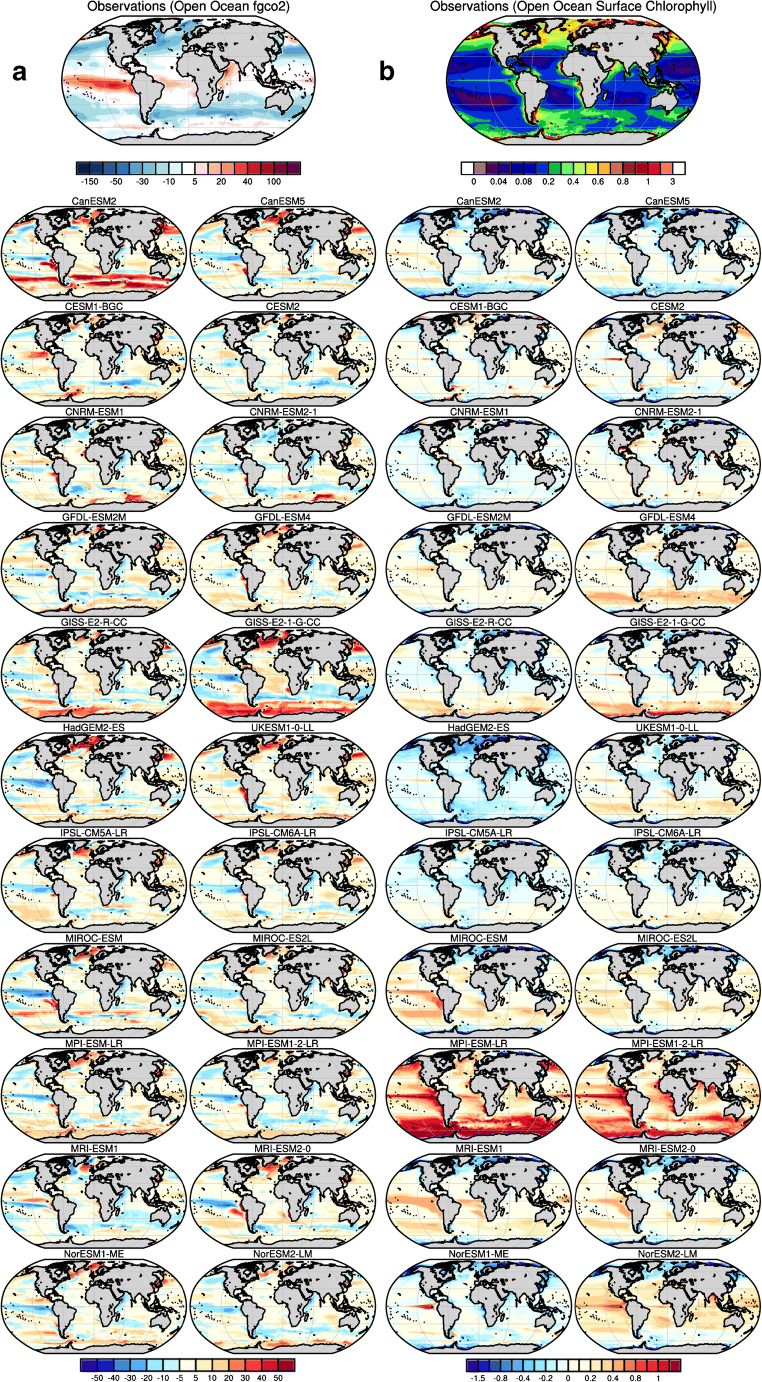
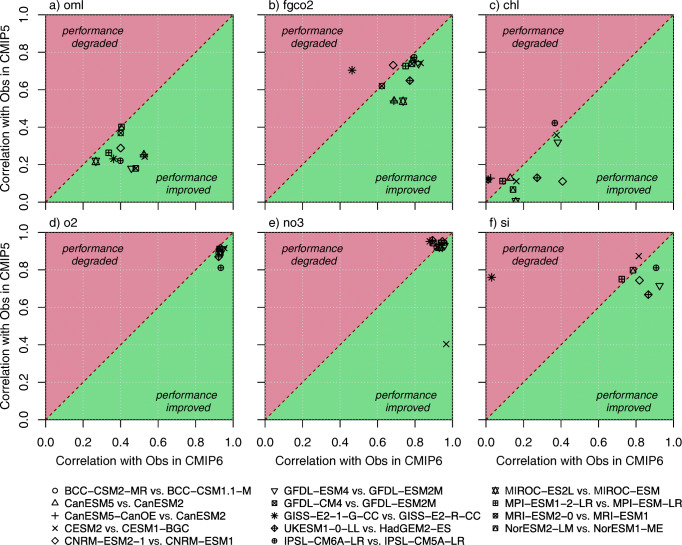
Purpose of review: The changes or updates in ocean biogeochemistry component have been mapped between CMIP5 and CMIP6 model versions, and an assessment made of how far these have led to improvements in the simulated mean state of marine biogeochemical models within the current generation of Earth system models (ESMs).

Recent findings: The representation of marine biogeochemistry has progressed within the current generation of Earth system models. However, it remains difficult to identify which model updates are responsible for a given improvement. In addition, the full potential of marine biogeochemistry in terms of Earth system interactions and climate feedback remains poorly examined in the current generation of Earth system models.

Summary: Increasing availability of ocean biogeochemical data, as well as an improved understanding of the underlying processes, allows advances in the marine biogeochemical components of the current generation of ESMs. The present study scrutinizes the extent to which marine biogeochemistry components of ESMs have progressed between the 5th and the 6th phases of the Coupled Model Intercomparison Project (CMIP).

Keywords: Biogeochemistry-Climate Feedbacks; CMIP5; CMIP6; Marine Biogeochemistry; Model Performance.


Conflict of interest statement

Conflict of InterestOn behalf of all authors, the corresponding author states that there is no conflict of interest.

Figures

Fig. 1
Fig. 1
Schematic representation of Earth system interactions and feedbacks between the ocean biogeochemistry and climate. F1 represents the well-established climate-carbon cycle feedbacks; F2 and F3 sketch the dominant pathways for the biogenic aerosol-cloud feedbacks and the non-CO2 biogeochemical cycle feedbacks; F4 depicts the phytoplankton-light feedbacks (that is a biophysical interactions)
Fig. 2
Fig. 2
Model-data intercomparison of a open ocean-sea-air carbon fluxes (fgco2, g C m−2 year−1) and b open ocean surface chlorophyll (chl, mg Chl m−3) as simulated by ocean biogeochemical models embedded within CMIP6 Earth system models (the right column) and their former version as used for CMIP5 (the left column). a The first top panel shows observation-based estimates from Landschützer et al. [143] averaged for the period 1995–2014 (see Methods in Supplementary materials). The other panels show model-data biases averaged for the same period. Coloured areas are indicative of the model-data absolute difference in magnitude of sea-air fluxes. Red regions indicate areas in models where the magnitude of the sea-air flux is greater than that observed, whereas blue regions indicate the reverse. b The first top panel shows satellite-based ocean chlorophyll estimates from ESA-CCI-OC [144] averaged over 1998–2014. The other panels show model-data departure averaged over the period 1998–2014
Fig. 3
Fig. 3
Model-data intercomparison of a surface nitrate concentrations (no3, μmol L−1) and b surface silicic acid concentrations (si, μmol L−1) as simulated by ocean biogeochemical models embedded within CMIP6 Earth system models (right columns) and their former version as used for CMIP5 (left columns). a and b The first top panel shows the optimal interpolation of nitrate (no3) and silicate (si) measurements as provided in the World Ocean Atlas Database 2013 (Garcia et al. [145]). The other panels show model-data departure averaged over the period 1995–2014 (see Methods in Supplementary materials)
Fig. 4
Fig. 4
Model-data intercomparison of oxygen concentrations at 150 m (o2, μmol L−1) as a proxy for oxygen minimum zones (OMZs) and as simulated by ocean biogeochemical models embedded within CMIP6 Earth system models (on the right column) and within their former version used for CMIP5 (on the left column). The first top panels in a and b show the observed oxygen concentrations at 150 m from the World Ocean Atlas 2013 (Garcia et al. [145]). The other panels in a show oxygen concentrations at 150 m as simulated by CMIP5 and CMIP6 models averaged over the period 1995–2014, while panels in b show model-data departure averaged over the period 1995–2014 (see Methods in Supplementary materials)
Fig. 5
Fig. 5
Model-data scatterplots for surface dissolved iron concentrations (log-log scale). Observational data are derived from the average of the 0–10 m of the measurement compilation used in Tagliabue et al. [117]. Model concentrations are taken from the first ocean layer. Red dots and blue triangles indicate CMIP6 and CMIP5 models respectively. The red dashed line shows the 1:1 line; the red and blue solid lines highlight the model-data mismatch in terms of global mean concentrations for CMIP5 and CMIP6 models (see Methods in Supplementary materials). The global mean for observations and models are given in brackets. Model-data fit (squared correlation, R2) is given in parenthesis with squared correlation coefficients for CMIP5 and CMIP6 models
Fig. 6
Fig. 6
Scatter plot confronting the performance of CMIP6 models to replicate the geographical structure of observed fields with respect to that of their CMIP5 predecessors. The performance metrics are the model-data spatial correlation computed from yearly averaged data and model outputs. The variables of interest are mixed-layer depth (oml), air-sea CO2 flux (fgco2), surface chlorophyll (chl), oxygen concentration at 150 m (o2) and surface concentrations of nitrate (no3) and silicic acid (si). The green (red) shading flags an improvement (degradation) of the model performance to replicate the observed geographical structure for a given field. The ocean mixed-layer depth is computed similarly in all models; it is based on a density criterion of 0.03 kg m−3. The ocean mixed-layer depth simulated by the various Earth system models is evaluated against the observational dataset of de Boyer Montégut et al. [162]
Fig. 7
Fig. 7
Portrait diagram highlighting the performance of CMIP6 models (one representative per modelling groups) with respect to their CMIP5 predecessors. The variables of interest are mixed-layer depth (oml), air-sea CO2 flux (fgco2), surface chlorophyll (chl), oxygen concentration at 150 m (o2) and surface concentrations of nitrate (no3) and silicic acid (si). The skill score metric, Z-score, is computed for a given model and for a given field as follows: Z-score=RMSECMIP6MRMSECMIP5PRMSECMIP5P×100, where RMSECMIP6(M) is the global area-weighted average model-data root-mean-squared error (RMSE) of the model of the current generation contributing to CMIP6 and RMSECMIP5(P) is the RMSE of its predecessor that has contributed to CMIP5. Greenish (reddish) colours and negative (positive) Z-scores indicate improved (degraded) field representations in CMIP6 model versions; darker colours indicate a greater change from CMIP5 to CMIP6. Grey indicates missing data for one or both generations of models. Air-sea CO2 flux (fgco2) was adjusted for riverine-induced outgassing as in Table 4. The ocean mixed-layer depth is computed similarly in all models; it is based on a density criterion of 0.03 kg m−3. The ocean mixed-layer depth simulated by the various Earth system models is evaluated against the observational dataset of de Boyer Montégut et al. [162]

References

    1. Sarmiento JL, Gruber N. Ocean biogeochemical dynamics: Princeton University Press; 2006. p. 67. http://www.mendeley.com/research/chapter-10-carbon-cycle-co2-climate/.
    1. Ciais P, et al. Carbon and other biogeochemical cycles. Clim Chang 2013 - Phys Sci Basis. 2013:465–570. 10.1017/CBO9781107415324.015.
    1. Lengaigne M, Madec G, Bopp L, Menkes C, Aumont O, Cadule P. Bio-physical feedbacks in the Arctic Ocean using an Earth system model. Geophys Res Lett. 2009;36:L21602. doi: 10.1029/2009GL040145. - DOI
    1. Roy T, et al. Regional impacts of climate change and atmospheric CO2 on future ocean carbon uptake: a multimodel linear feedback analysis. J Clim. 2011;24:2300–2318. doi: 10.1175/2010JCLI3787.1. - DOI
    1. Schwinger J, et al. Nonlinearity of ocean carbon cycle feedbacks in CMIP5 earth system models. J Clim. 2014;27:3869–3888. doi: 10.1175/JCLI-D-13-00452.1. - DOI

LinkOut - more resources