. 2020;4(3):453-479.
doi: 10.1007/s41885-020-00070-3. Epub 2020 Jul 23.

Socio-Economic Impacts of COVID-19 on Household Consumption and Poverty

Affiliations

Socio-Economic Impacts of COVID-19 on Household Consumption and Poverty

Amory Martin et al. Econ Disaster Clim Chang. 2020.

Abstract

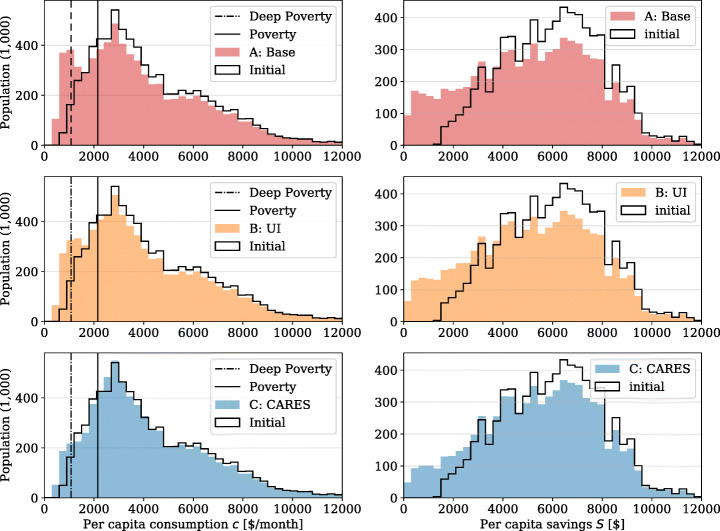
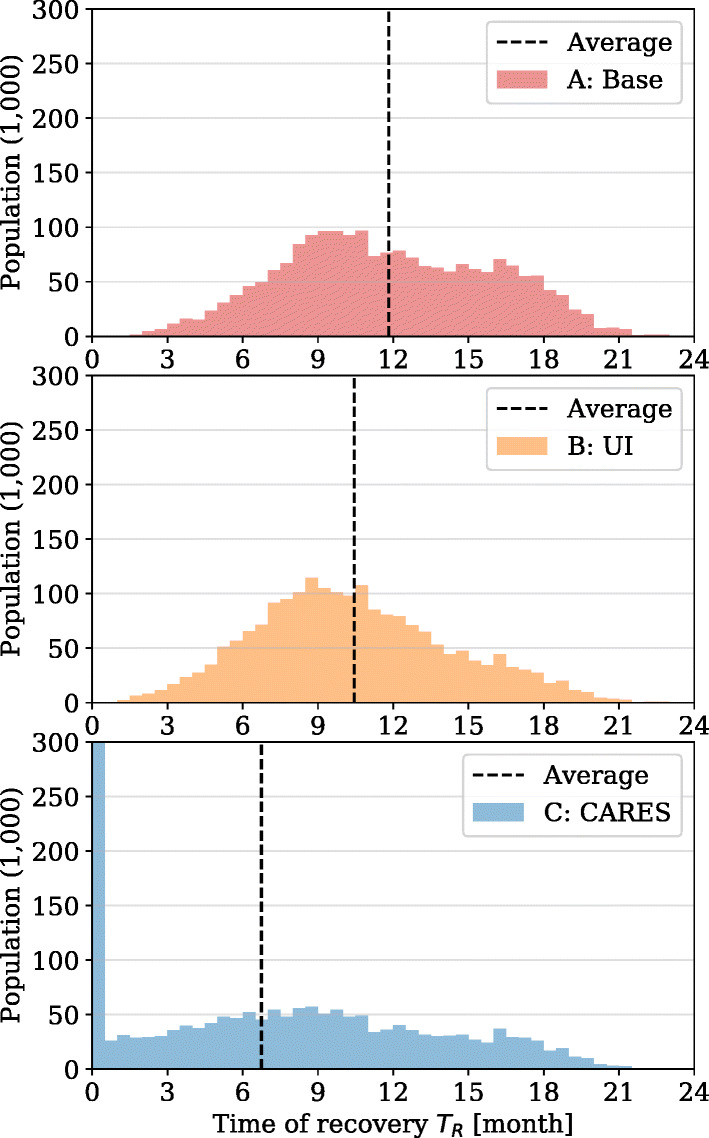
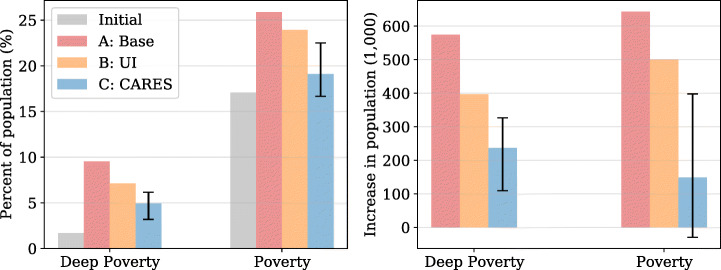
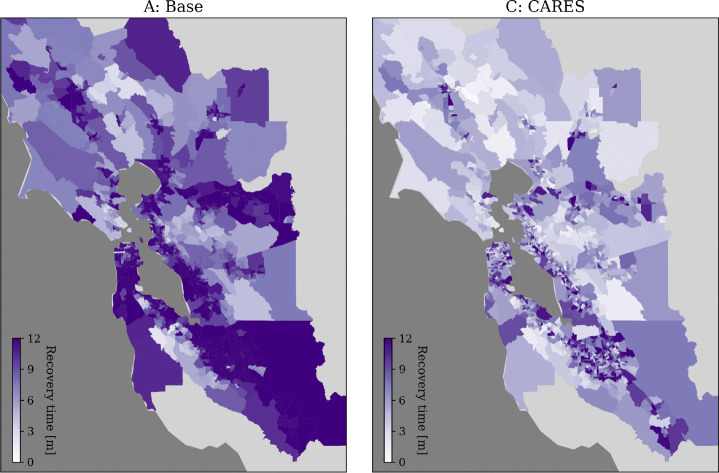
The COVID-19 pandemic has caused a massive economic shock across the world due to business interruptions and shutdowns from social-distancing measures. To evaluate the socio-economic impact of COVID-19 on individuals, a micro-economic model is developed to estimate the direct impact of distancing on household income, savings, consumption, and poverty. The model assumes two periods: a crisis period during which some individuals experience a drop in income and can use their savings to maintain consumption; and a recovery period, when households save to replenish their depleted savings to pre-crisis level. The San Francisco Bay Area is used as a case study, and the impacts of a lockdown are quantified, accounting for the effects of unemployment insurance (UI) and the CARES Act federal stimulus. Assuming a shelter-in-place period of three months, the poverty rate would temporarily increase from 17.1% to 25.9% in the Bay Area in the absence of social protection, and the lowest income earners would suffer the most in relative terms. If fully implemented, the combination of UI and CARES could keep the increase in poverty close to zero, and reduce the average recovery time, for individuals who suffer an income loss, from 11.8 to 6.7 months. However, the severity of the economic impact is spatially heterogeneous, and certain communities are more affected than the average and could take more than a year to recover. Overall, this model is a first step in quantifying the household-level impacts of COVID-19 at a regional scale. This study can be extended to explore the impact of indirect macroeconomic effects, the role of uncertainty in households' decision-making and the potential effect of simultaneous exogenous shocks (e.g., natural disasters).

Keywords: COVID-19; Household consumption; Poverty rate; Socio-economic impact.


Conflict of interest statement

Conflict of interestsThe authors declare no conflicts of interest nor competing interests regarding the publication of this article.

Figures

Fig. 1
Fig. 1
Household consumption and savings model with crisis and recovery periods. Highlighted zones indicate federal assistance and state unemployment insurance
Fig. 2
Fig. 2
Bay Area COVID-19 crisis timeline: total reported cases by county (top left) and daily reported cases from The New York Times publicly available Coronavirus (COVID-19) Data in the United States (The New York Times 2020) (bottom left) and Bay Area counties (Rissman and Merenlender 2008) (right)
Fig. 3
Fig. 3
Histograms of per capita consumption and savings, comparing initial pre-crisis and during the crisis period for a case A: base, b case B: unemployment insurance and c case C: unemployment insurance and CARES Act stimulus. The income thresholds for poverty and deep poverty are plotted for comparisons
Fig. 4
Fig. 4
Histograms of recovery time for affected populations considering a case A: base, b case B: unemployment insurance and c case C: unemployment insurance and CARES Act stimulus
Fig. 5
Fig. 5
Recovery curve for the Bay Area using total household savings as a function of time for cases A (base), B (UI) and C (CARES). For case C, a confidence interval is shown based on uncertainty in exclusion rate (55% to 10%)
Fig. 6
Fig. 6
Bay Area poverty and deep poverty rates, as well as increase in poverty populations considering initial, case A, case B and case C. For case C with CARES, uncertainty is given based on exclusion rate with a median of 40% and upper and lower bounds of 55% and 10% respectively
Fig. 7
Fig. 7
Impact of crisis time on deep poverty and poverty rates in the Bay Area for cases A, B and C. The shaded area for case C represents the uncertainty in the exclusion rate with a likely estimate of 40% and upper and lower bounds of 55% and 10% for worst-case and best-case implementation scenarios respectively
Fig. 8
Fig. 8
Household average consumption losses, total [$/month] and relative [%], saving losses and recovery time by income quintile for cases A (base) and C (CARES) assuming a crisis period of three months
Fig. 9
Fig. 9
Spatial distribution of average relative consumption change [%] per capita in the Bay Area for case A: no benefits (left) and case C: CARES (right). Red indicates an average consumption loss (negative values) and blue indicates an average consumption gain (positive values)
Fig. 10
Fig. 10
Spatial distribution of average recovery time [months] per capita for affected individuals in the Bay Area for case A: no benefits (left) and case C: CARES (right). Darker purple indicates a longer recovery time
Fig. 11
Fig. 11
Utility of per capita savings exponential calibration
Fig. 12
Fig. 12
Insured unemployment rate (IUR) using a 13-week average from 1999 to 2019 for California according to the Employment Development Department (EDD), State of California, https://www.edd.ca.gov/about_edd/quick_statistics.htm#UIStatistics
Fig. 13
Fig. 13
Map of annual average unemployment rate in California by county in 2018 according to the Employment Development Department (EDD), State of California, https://www.labormarketinfo.edd.ca.gov/file/Maps/County_UR_2018BM2018.pdf
Fig. 14
Fig. 14
Poverty rates for California counties according to the California Poverty Measure (CPM) courtesy of the Public Policy Institute of California (PPIC) and Stanford’s Center on Poverty and Inequality, https://www.ppic.org/publication/poverty-in-california/

References

    1. Avalos G. (2020) Coronavirus Unemploymentx: One out of six Californians out of Work during lockdowns. The Mercury News, April 23, 2020. https://www.mercurynews.com/2020/04/23/coronavirus-unemployment-3-4-mill...
    1. Badger E., Parlapiona A. (2020) States made it harder to get jobless benefits. now that’s hard to undo. the new york Times, April 30, 2020. https://www.nytimes.com/2020/04/30/upshot/unemployment-state-restriction...
    1. Baker S.R., Farrokhnia R., Meyer S., Pagel M., Yannelis C. (2020) How does household spending respond to an epidemic? consumption during the 2020 COVID-19 pandemic. NBER Working Paper Series, (26949). 10.2139/ssrn.3565521
    1. Bick A., Blandin A. (2020) Real time labor market estimates during the coronavirus outbreak, W. P. Carey School of Business, April, 2020
    1. Bohn S., Danielson C., Thorman T. (2019) Poverty in california public policy institute of california (PPIC) (july)

LinkOut - more resources