. 2020 Aug:25:100457.
doi: 10.1016/j.eclinm.2020.100457. Epub 2020 Jul 13.

Lockdown timing and efficacy in controlling COVID-19 using mobile phone tracking

Affiliations

Lockdown timing and efficacy in controlling COVID-19 using mobile phone tracking

Marco Vinceti et al. EClinicalMedicine. 2020 Aug.

Abstract

Background: Italy's severe COVID-19 outbreak was addressed by a lockdown that gradually increased in space, time and intensity. The effectiveness of the lockdown has not been precisely assessed with respect to the intensity of mobility restriction and the time until the outbreak receded.

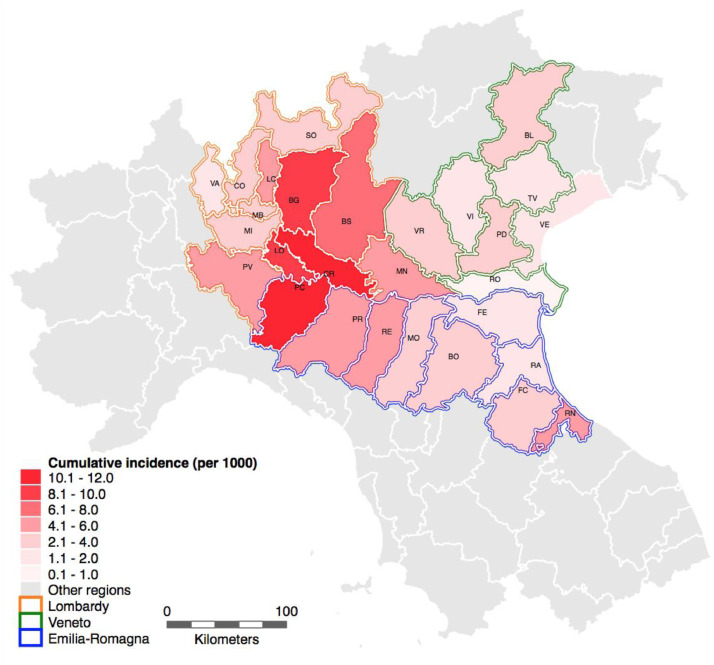
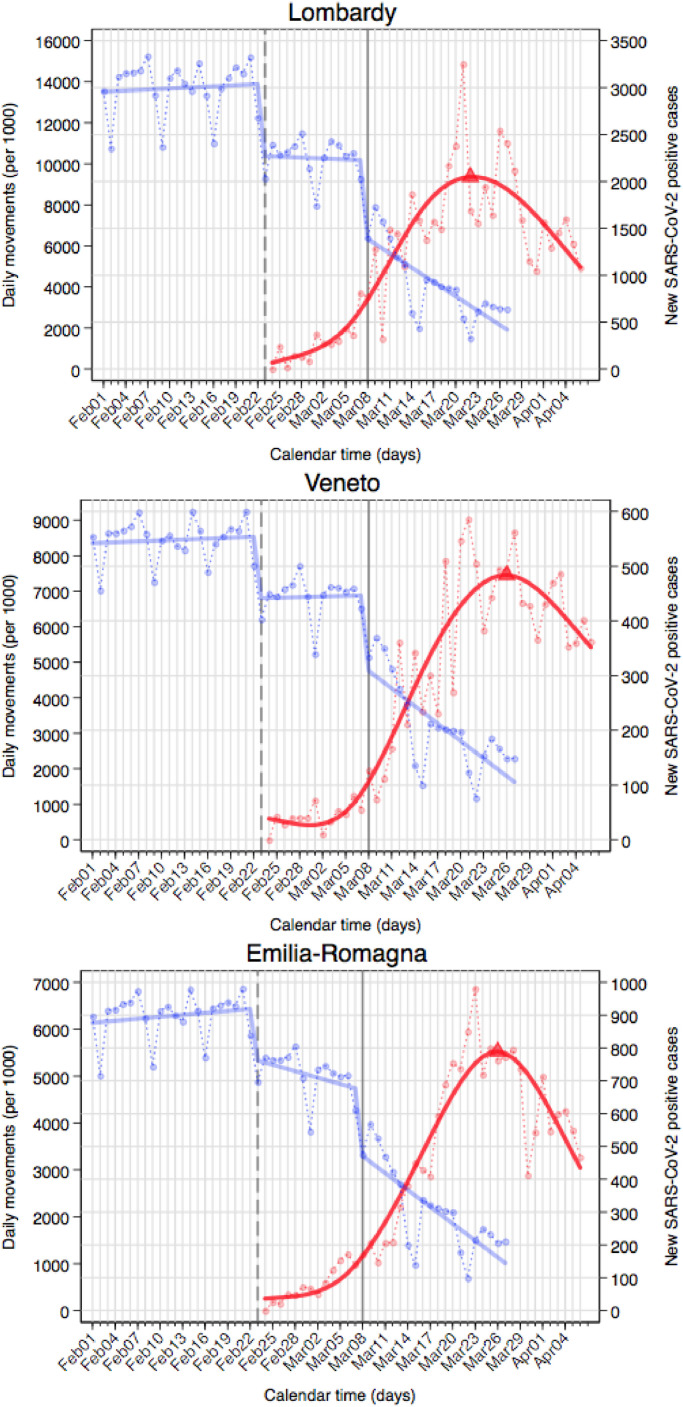
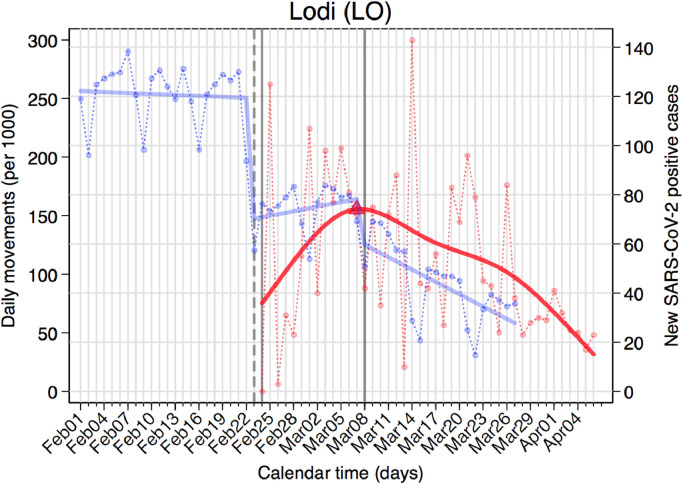
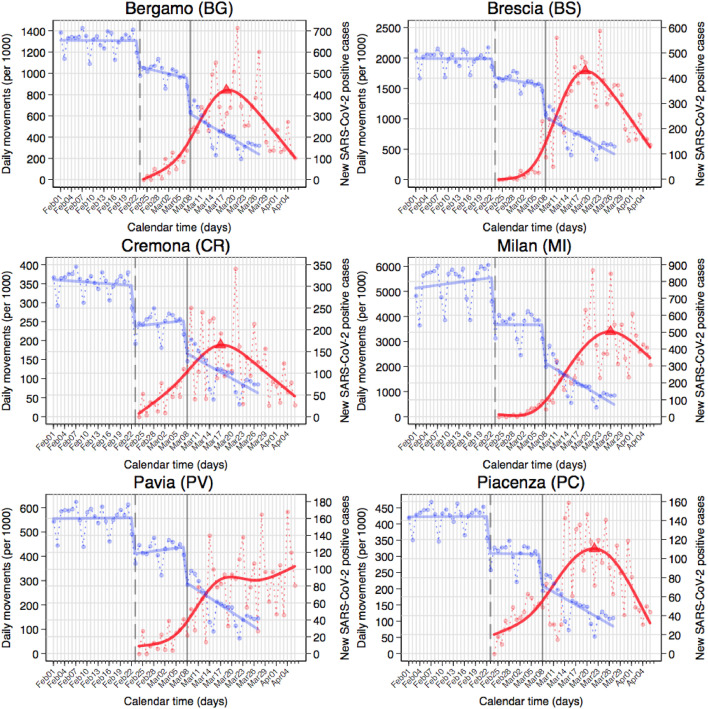
Methods: We used processed mobile phone tracking data to measure mobility restriction, and related those data to the number of new SARS-CoV-2 positive cases detected on a daily base in the three most affected Italian regions, Lombardy, Veneto and Emilia-Romagna, from February 1 through April 6, 2020, when two subsequent lockdowns with increasing intensity were implemented by the Italian government.

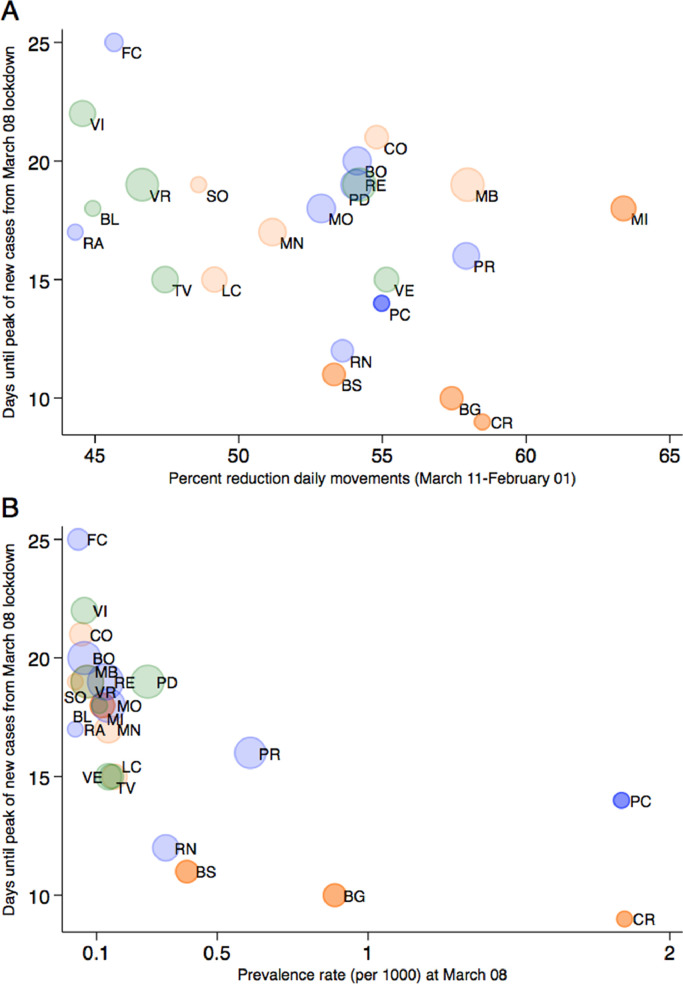
Findings: During the study period, mobility restriction was inversely related to the daily number of newly diagnosed SARS-CoV-2 positive cases only after the second, more effective lockdown, with a peak in the curve of diagnosed cases of infection occurring 14 to 18 days from lockdown in the three regions and 9 to 25 days in the included provinces. An effective reduction in transmission must have occurred nearly immediately after the tighter lockdown, given the lag time of around 10 days from asymptomatic infection to diagnosis. The period from lockdown to peak was shorter in the areas with the highest prevalence of the infection. This effect was seen within slightly more than one week in the most severely affected areas.

Interpretation: It appears that the less rigid lockdown led to an insufficient decrease in mobility to reverse an outbreak such as COVID-19. With a tighter lockdown, mobility decreased enough to bring down transmission promptly below the level needed to sustain the epidemic.

Funding: No funding sources have been used for this work.

Keywords: COVID-19; Cellphone; Epidemiology; Lockdown; Outbreak; Peak; SARS-CoV-2; Time trend.


Conflict of interest statement

The authors have no conflict of interests to disclose.

Figures

Fig 1
Fig. 1
Northern Italy study area with the cumulative incidence (per 1000) of SARS-CoV-2 infected cases diagnosed through April 6, 2020 in the provinces of the Lombardy, Veneto and Emilia-Romagna regions.
Fig 2
Fig. 2
Day-specific absolute numbers of people movements (blue dots) and SARS-CoV-2 positive cases (red dots) in the Lombardy, Veneto and Emilia-Romagna regions from February 1, 2020-April 6, 2020. Blue line shows the predicted mean number of movements obtained with a mix of constant and linear splines of calendar days with two knots at the major events of interest in determining lockdowns of different intensity (February 23, 2020 – dashed gray line, and March 8, 2020 – solid gray line). Red line shows the predicted mean number of new COVID-19 cases obtained with restricted cubic splines of calendar days with 5 knots to identify the maximum predicted value (i.e. day of peak occurrence – red triangle). The two series were modeled using the Newey–West estimator.
Fig 3
Fig. 3
Day-specific absolute numbers of people movements (blue dots) and SARS-CoV-2 positive cases (red dots) in Lodi province (Lombardy region) during February 1, 2020-April 6, 2020. Blue line shows the predicted mean number of movements obtained with a mix of constant and linear splines of calendar days with two knots at the major events of interest in determining lockdowns of different intensity (February 23, 2020 – dashed gray line for the light lockdown in most of the province, solid gray line for the tight lockdown in the ‘red zone’, around one quarter of the province; and March 8, 2020 – solid gray line extended to the entire province). Red line shows the predicted mean number of new COVID-19 cases obtained with restricted cubic splines of calendar days with 5 knots to identify the maximum predicted value (i.e. day of peak occurrence – red triangle). We fitted time-series data using Newey–West regression models.
Fig 4
Fig. 4
Day-specific absolute numbers of people movements (blue dots) and SARS-CoV-2 positive cases (red dots) in the provinces bordering Lodi – i.e. Bergamo, Brescia, Cremona, Milan, Pavia (Lombardy region) and Piacenza (Emilia-Romagna region) during February 1, 2020-April 6, 2020. Blue line shows the predicted mean number of movements obtained with a mix of constant and linear splines of calendar days with two knots at the major events of interest in determining lockdowns of different intensity (February 23, 2020 – dashed gray line, and March 8, 2020 – solid gray line). Red line shows the predicted mean number of new COVID-19 cases obtained with restricted cubic splines of calendar days with 5 knots to identify the maximum predicted value (i.e. day of peak occurrence – red triangle). We fitted time-series data using Newey–West regression models.
Fig 5
Fig. 5
Days until the peak of the SARS-CoV-2 positive cases and percent reduction of people movements for provinces within the three investigated regions (A); days until the peak of SARS-CoV-2 positive cases and SARS-CoV-2 infection prevalence on March 8, 2020 in the study provinces (B). Area of circles reflects total number of cases on April 6, 2020. Provinces without a peak within the study period (Pavia, Varese, Rovigo and Ferrara) and the province with a mixed lockdown (Lodi) were not included in the figure.

References

    1. WHO. Coronavirus disease (COVID-19) advice for the public, 2020. https://www.who.int/emergencies/diseases/novel-coronavirus-2019/advice-f... (accessed 12 June 2020).
    1. Kraemer M.U.G., Yang C.H., Gutierrez B. The effect of human mobility and control measures on the COVID-19 epidemic in China. Science. 2020;368:493–497. - PMC - PubMed
    1. Zhang J., Litvinova M., Liang Y. Changes in contact patterns shape the dynamics of the COVID-19 outbreak in China. Science. 2020;368:1481–1486. - PMC - PubMed
    1. Acuna-Zegarra M.A., Santana-Cibrian M., Velasco-Hernandez J.X. Modeling behavioral change and COVID-19 containment in Mexico: a trade-off between lockdown and compliance. Math Biosci. 2020;325 - PMC - PubMed
    1. Ji T, Chen HL, Xu J, et al. Lockdown contained the spread of 2019 novel coronavirus disease in Huangshi city, China: early epidemiological findings. Clin Infect Dis In press. doi: 10.1093/cid/ciaa390. - DOI - PMC - PubMed