

Using the COVID-19 to influenza ratio to estimate early pandemic spread in Wuhan, China and Seattle, US
- PMID: 32838239
- PMCID: PMC7422814
- DOI: 10.1016/j.eclinm.2020.100479
Using the COVID-19 to influenza ratio to estimate early pandemic spread in Wuhan, China and Seattle, US
Abstract
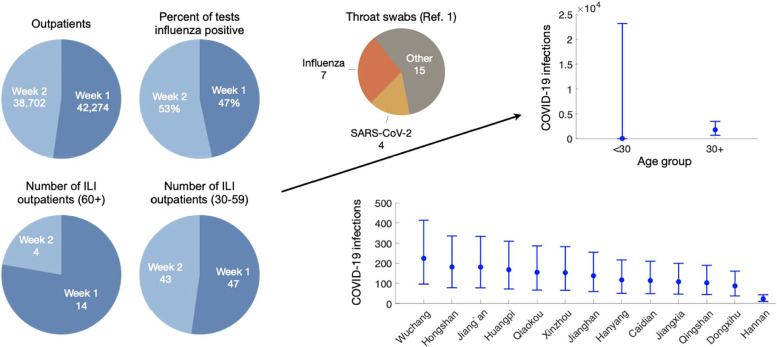
Background: Pandemic SARS-CoV-2 was first reported in Wuhan, China on December 31, 2019. Twenty-one days later, the US identified its first case--a man who had traveled from Wuhan to the state of Washington. Recent studies in the Wuhan and Seattle metropolitan areas retrospectively tested samples taken from patients with COVID-like symptoms. In the Wuhan study, there were 4 SARS-CoV-2 positives and 7 influenza positives out of 26 adults outpatients who sought care for influenza-like-illness at two central hospitals prior to January 12, 2020. The Seattle study reported 25 SARS-CoV-2 positives and 442 influenza positives out of 2353 children and adults who reported acute respiratory illness prior to March 9, 2020. Here, we use these findings to extrapolate the early prevalence of symptomatic COVID-19 in Wuhan and Seattle.
Methods: For each city, we estimate the ratio of COVID-19 to influenza infections from the retrospective testing data and estimate the age-specific prevalence of influenza from surveillance reports during the same time period. Combining these, we approximate the total number of symptomatic COVID-19 infections.
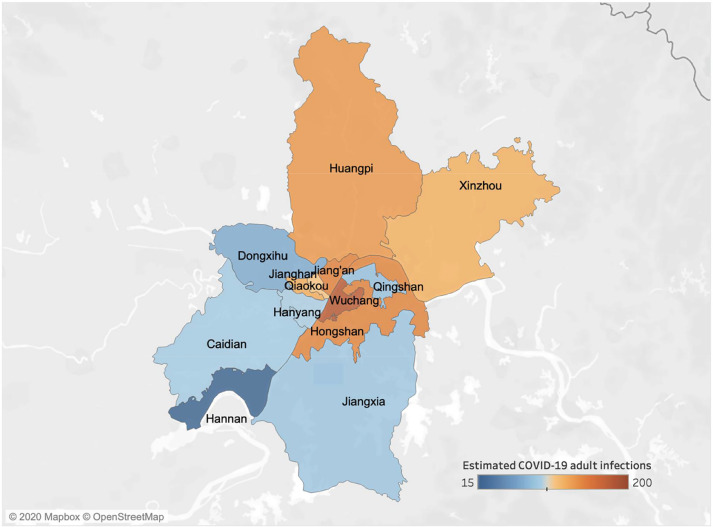
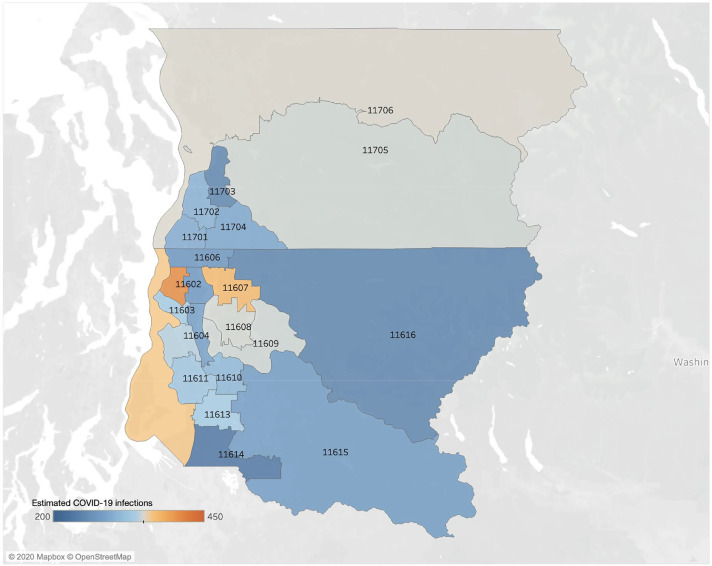
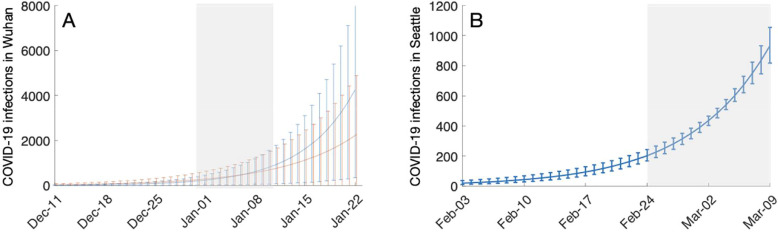
Findings: In Wuhan, there were an estimated 1386 [95% CrI: 420-3793] symptomatic cases over 30 of COVID-19 between December 30, 2019 and January 12, 2020. In Seattle, we estimate that 2268 [95% CrI: 498, 6069] children under 18 and 4367 [95% CrI: 2776, 6526] adults were symptomatically infected between February 24 and March 9, 2020. We also find that the initial pandemic wave in Wuhan likely originated with a single infected case who developed symptoms sometime between October 26 and December 13, 2019; in Seattle, the seeding likely occurred between December 25, 2019 and January 15, 2020.
Interpretation: The spread of COVID-19 in Wuhan and Seattle was far more extensive than initially reported. The virus likely spread for months in Wuhan before the lockdown. Given that COVID-19 appears to be overwhelmingly mild in children, our high estimate for symptomatic pediatric cases in Seattle suggests that there may have been thousands more mild cases at the time.
Keywords: Adult infections; COVID-19; Influenza; Pediatric infections; Seattle; Wuhan.
© 2020 Published by Elsevier Ltd.
Conflict of interest statement
We declare no competing interests.
Figures
Update of
-
Using the COVID-19 to influenza ratio to estimate the numbers of symptomatic COVID-19 cases in Wuhan prior to the lockdown.medRxiv [Preprint]. 2020 May 1:2020.04.26.20075937. doi: 10.1101/2020.04.26.20075937. medRxiv. 2020. Update in: EClinicalMedicine. 2020 Sep;26:100479. doi: 10.1016/j.eclinm.2020.100479. PMID: 32511598 Free PMC article. Updated. Preprint.
Similar articles
-
Using the COVID-19 to influenza ratio to estimate the numbers of symptomatic COVID-19 cases in Wuhan prior to the lockdown.medRxiv [Preprint]. 2020 May 1:2020.04.26.20075937. doi: 10.1101/2020.04.26.20075937. medRxiv. 2020. Update in: EClinicalMedicine. 2020 Sep;26:100479. doi: 10.1016/j.eclinm.2020.100479. PMID: 32511598 Free PMC article. Updated. Preprint.
-
Outbreak Investigation of COVID-19 Among Residents and Staff of an Independent and Assisted Living Community for Older Adults in Seattle, Washington.JAMA Intern Med. 2020 Aug 1;180(8):1101-1105. doi: 10.1001/jamainternmed.2020.2233. JAMA Intern Med. 2020. PMID: 32437547 Free PMC article.
-
The incidence of influenza in children was decreased in the first flu season after COVID-19 pandemic in Wuhan.J Infect Public Health. 2021 Sep;14(9):1279-1281. doi: 10.1016/j.jiph.2021.08.027. Epub 2021 Aug 27. J Infect Public Health. 2021. PMID: 34500253 Free PMC article.
-
Maternal and infant outcomes of full-term pregnancy combined with COVID-2019 in Wuhan, China: retrospective case series.Arch Gynecol Obstet. 2020 Sep;302(3):545-551. doi: 10.1007/s00404-020-05573-8. Epub 2020 Jul 21. Arch Gynecol Obstet. 2020. PMID: 32696241 Free PMC article. Review.
-
Intensive care management of patients with COVID-19.J Anaesthesiol Clin Pharmacol. 2020 Aug;36(Suppl 1):S29-S38. doi: 10.4103/joacp.JOACP_265_20. Epub 2020 Jul 25. J Anaesthesiol Clin Pharmacol. 2020. PMID: 33100643 Free PMC article. Review.
Cited by
-
Anticipating human resilience and vulnerability on the path to 2030: What can we learn from COVID-19?Futures. 2022 May;139:102936. doi: 10.1016/j.futures.2022.102936. Epub 2022 Apr 1. Futures. 2022. PMID: 35382386 Free PMC article.
-
Bioprospecting of microalgae metabolites against cytokine storm syndrome during COVID-19.Mol Biol Rep. 2022 Feb;49(2):1475-1490. doi: 10.1007/s11033-021-06903-y. Epub 2021 Nov 9. Mol Biol Rep. 2022. PMID: 34751914 Free PMC article. Review.
-
From apparent to true - from frequency to distributions (II).Croat Med J. 2020 Aug 31;61(4):381-385. doi: 10.3325/cmj.2020.61.381. Croat Med J. 2020. PMID: 32881438 Free PMC article. No abstract available.
-
Language and COVID-19: A discourse analysis of resistance to lockdown in Indonesia.Heliyon. 2023 Mar;9(3):e13551. doi: 10.1016/j.heliyon.2023.e13551. Epub 2023 Feb 10. Heliyon. 2023. PMID: 36789390 Free PMC article.
-
A spatial epidemic model with a moving boundary.Infect Dis Model. 2021 Sep 3;6:1046-1060. doi: 10.1016/j.idm.2021.08.005. eCollection 2021. Infect Dis Model. 2021. PMID: 34541423 Free PMC article.
References
-
- Center for Disease Control and Prevention; January 2020. First travel-related case of 2019 novel coronavirus detected in United States; p. 21. Published on.
Grants and funding
LinkOut - more resources
Full Text Sources
Miscellaneous
