. 2020 Oct 30;295(44):15112-15133.
doi: 10.1074/jbc.RA120.012618. Epub 2020 Aug 23.

Differential processing and localization of human Nocturnin controls metabolism of mRNA and nicotinamide adenine dinucleotide cofactors

Affiliations

Differential processing and localization of human Nocturnin controls metabolism of mRNA and nicotinamide adenine dinucleotide cofactors

Elizabeth T Abshire et al. J Biol Chem. .

Abstract

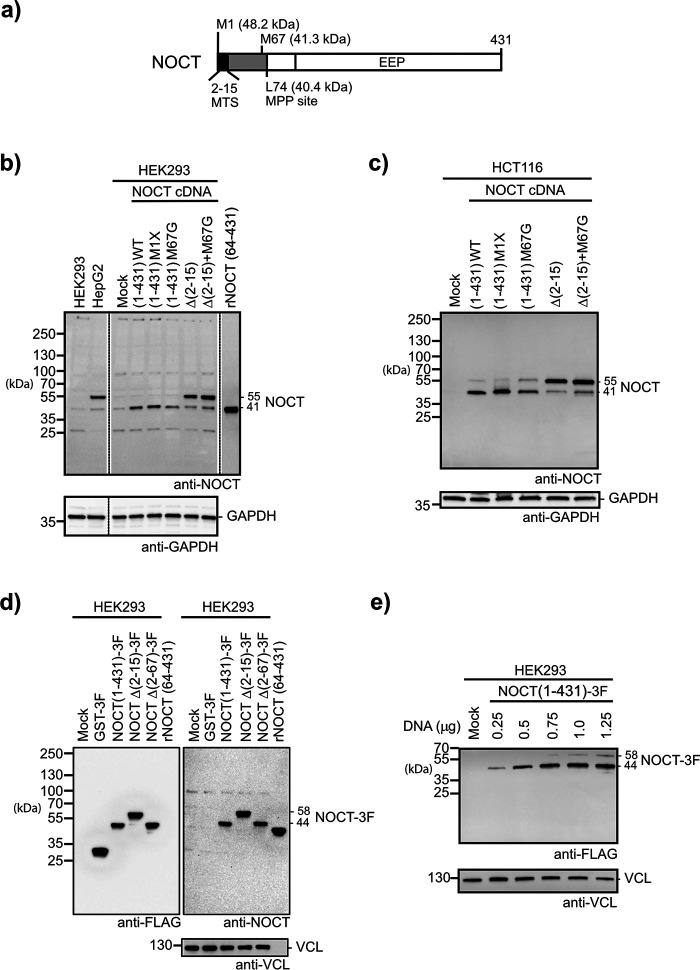
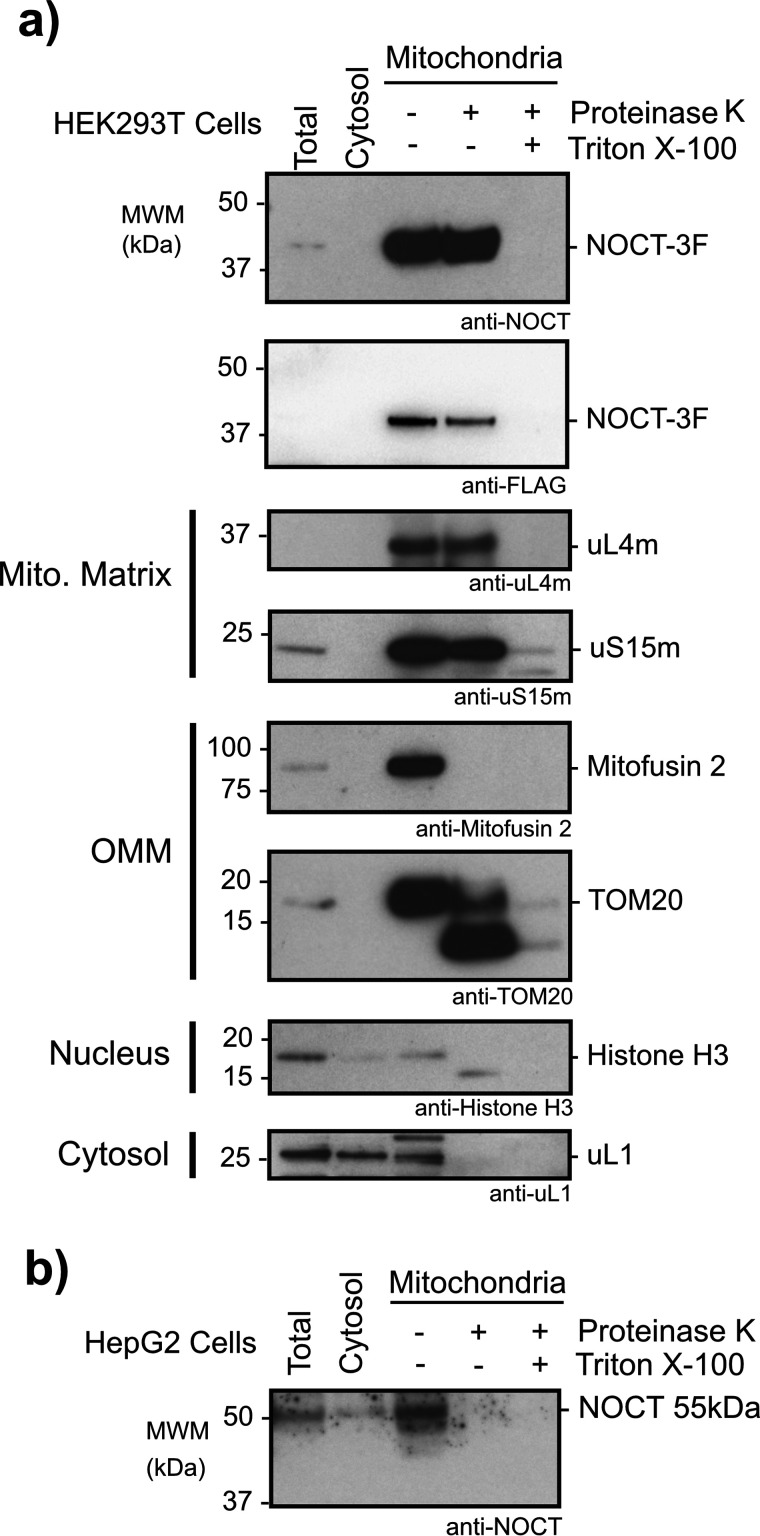
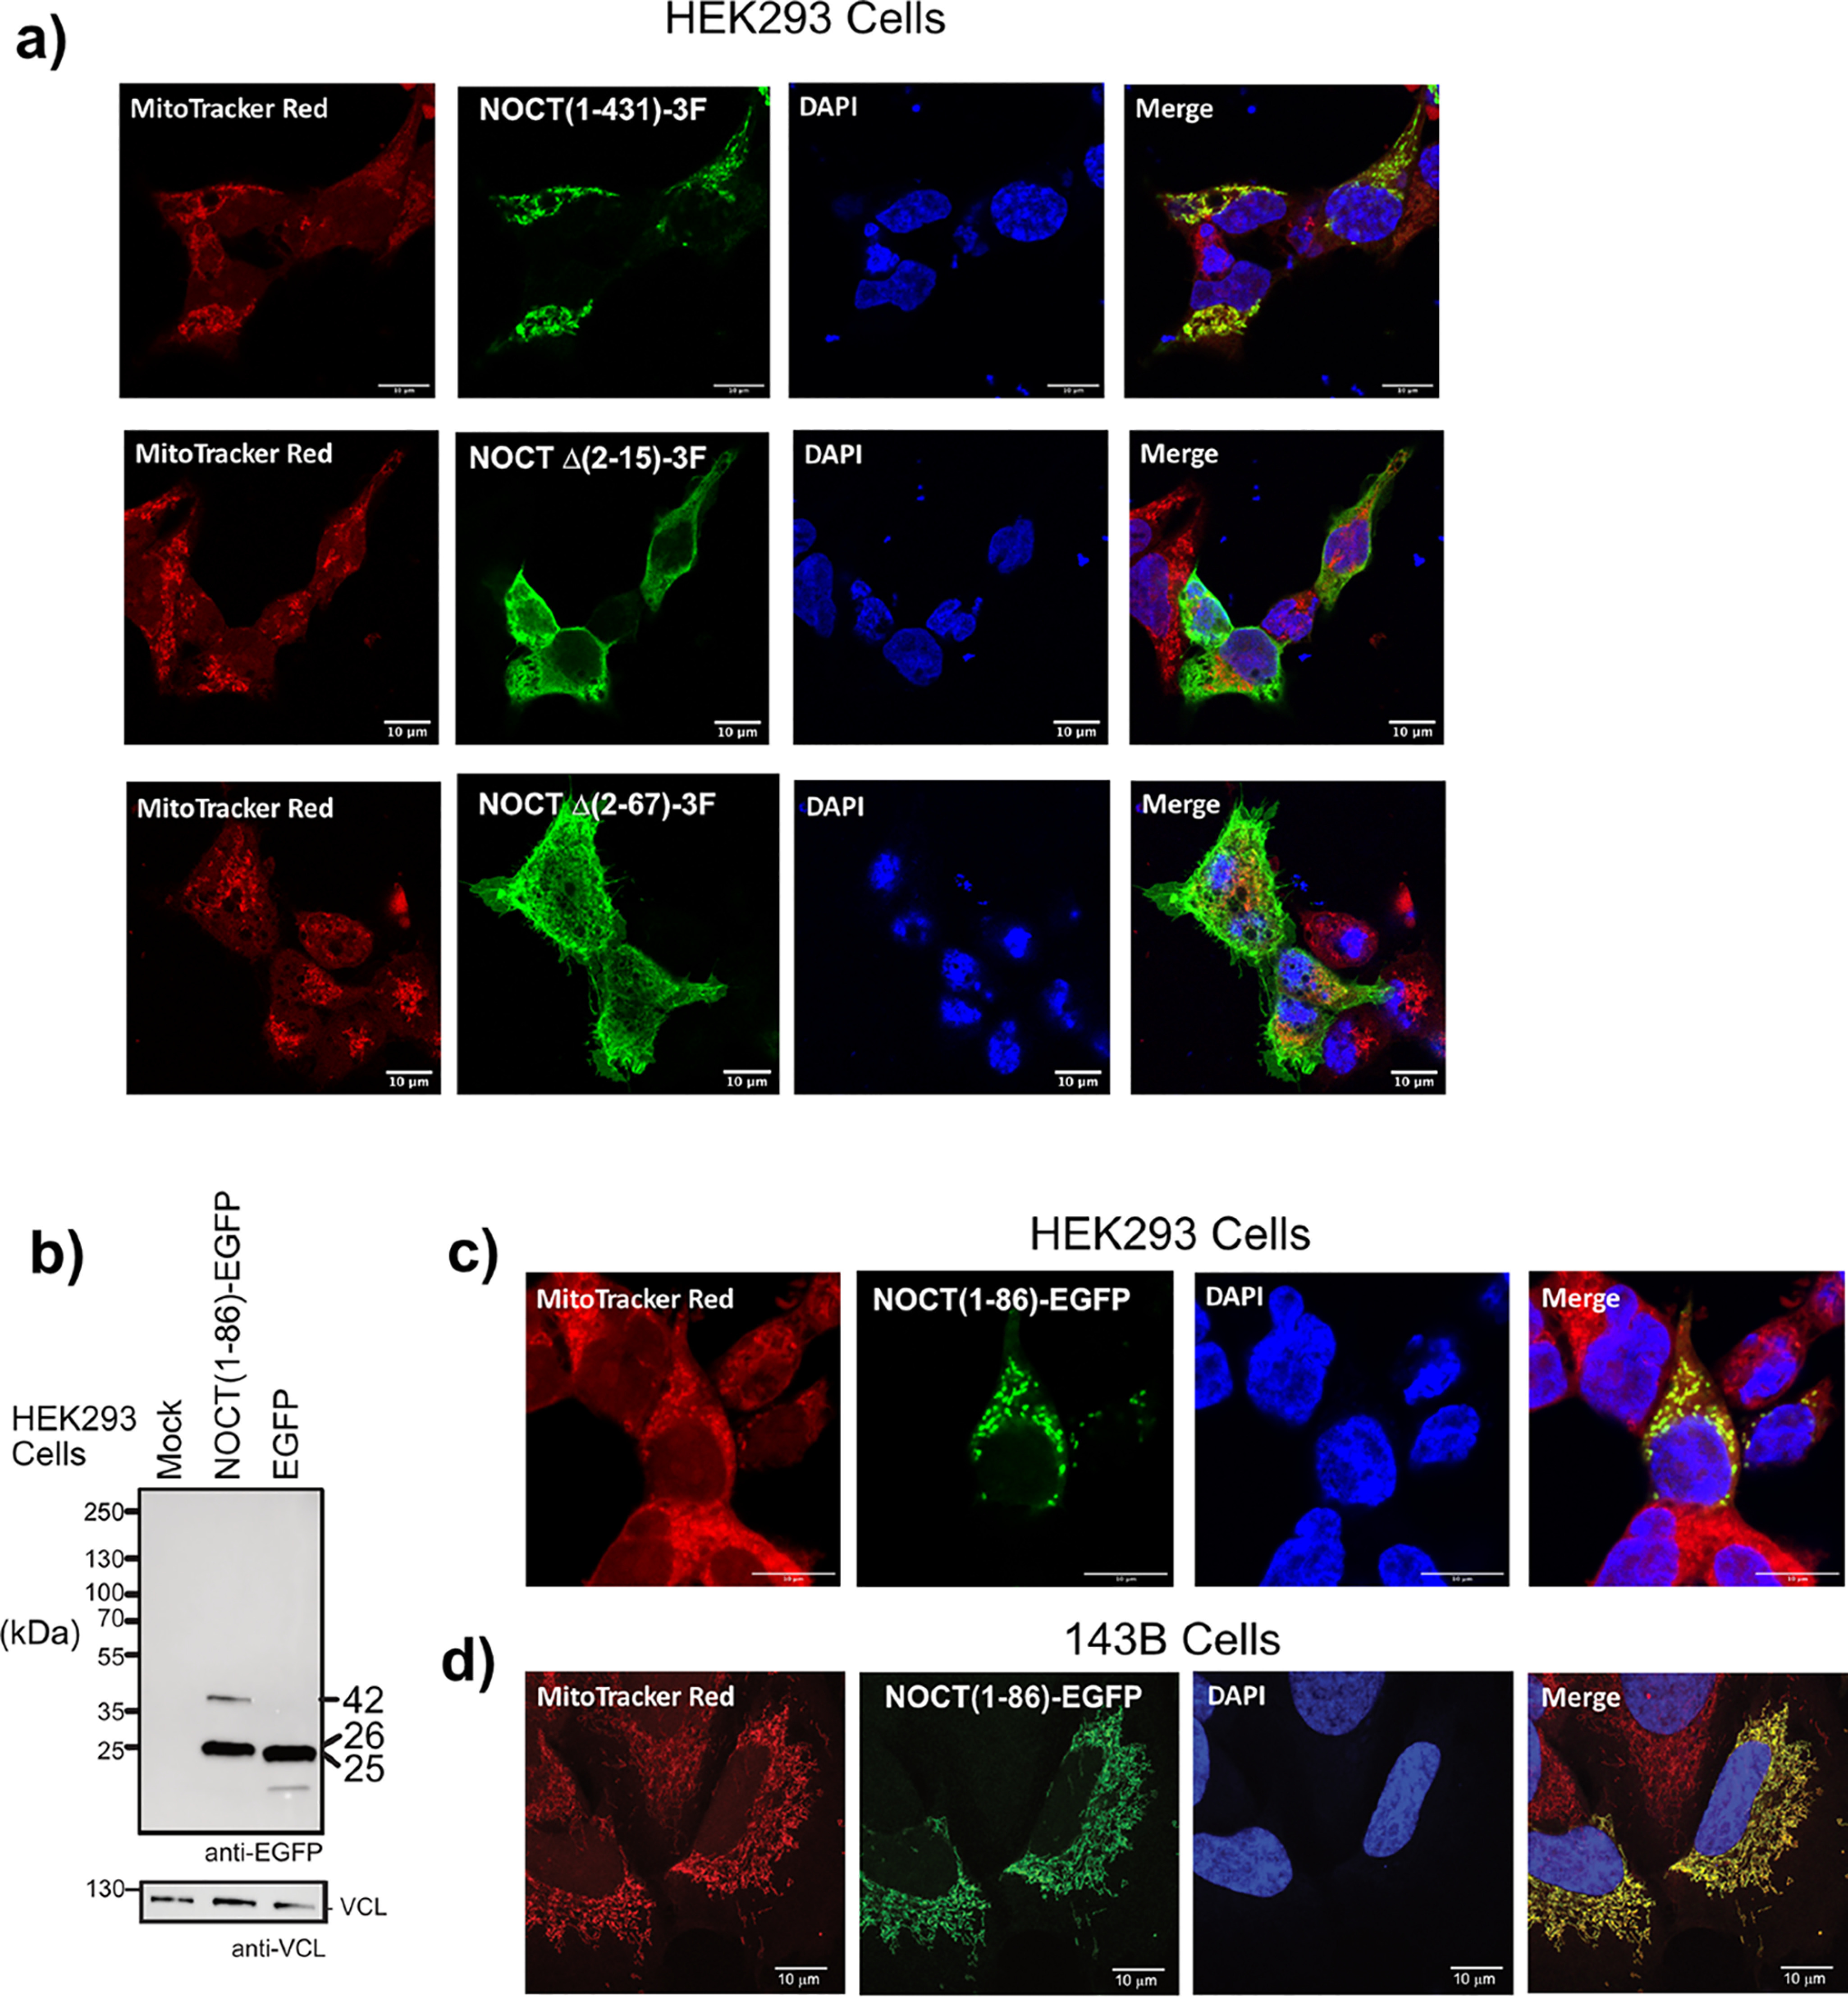
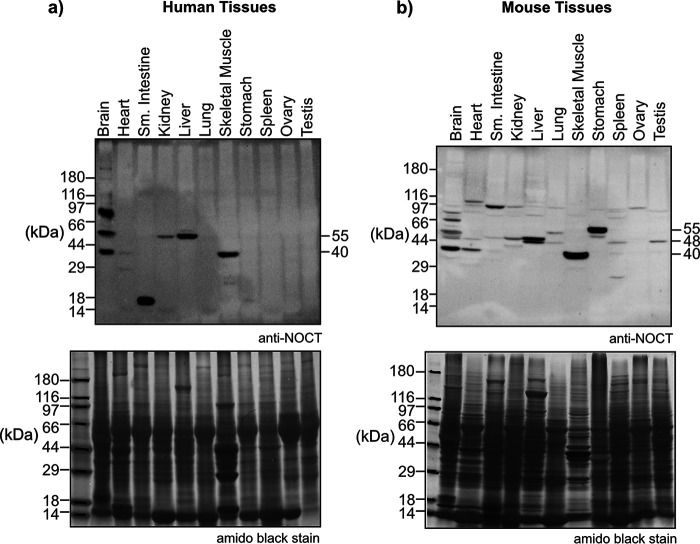
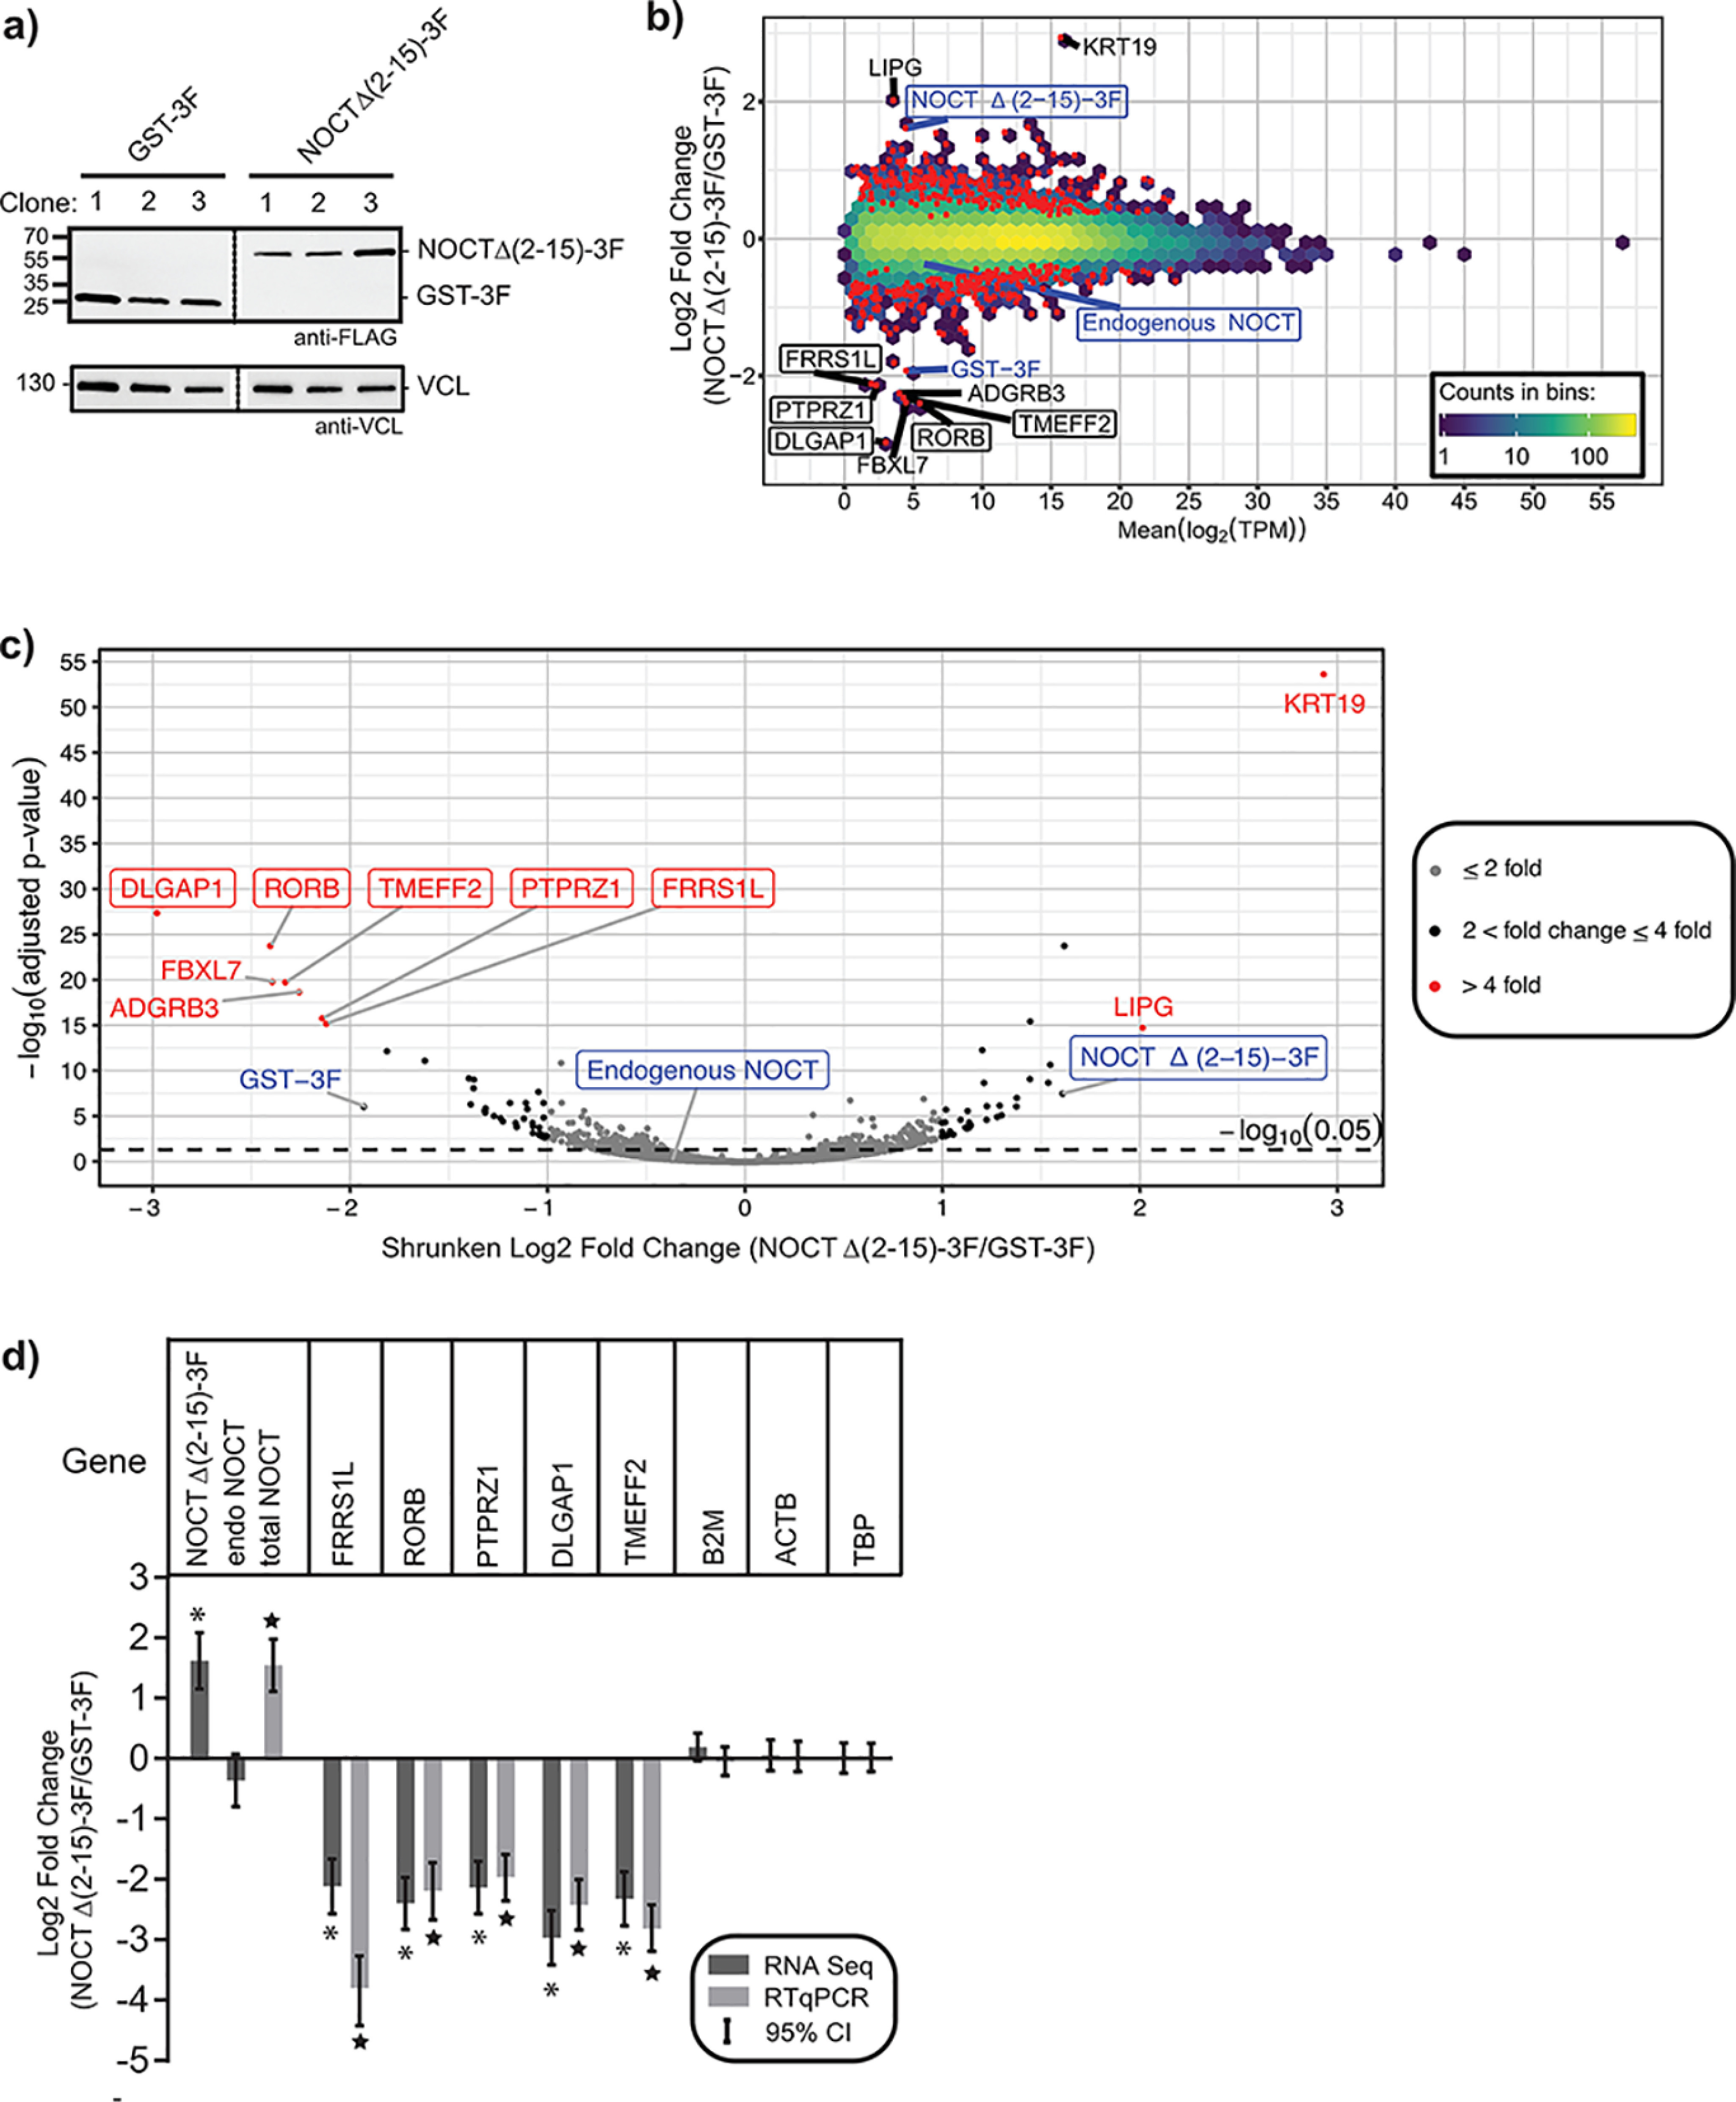
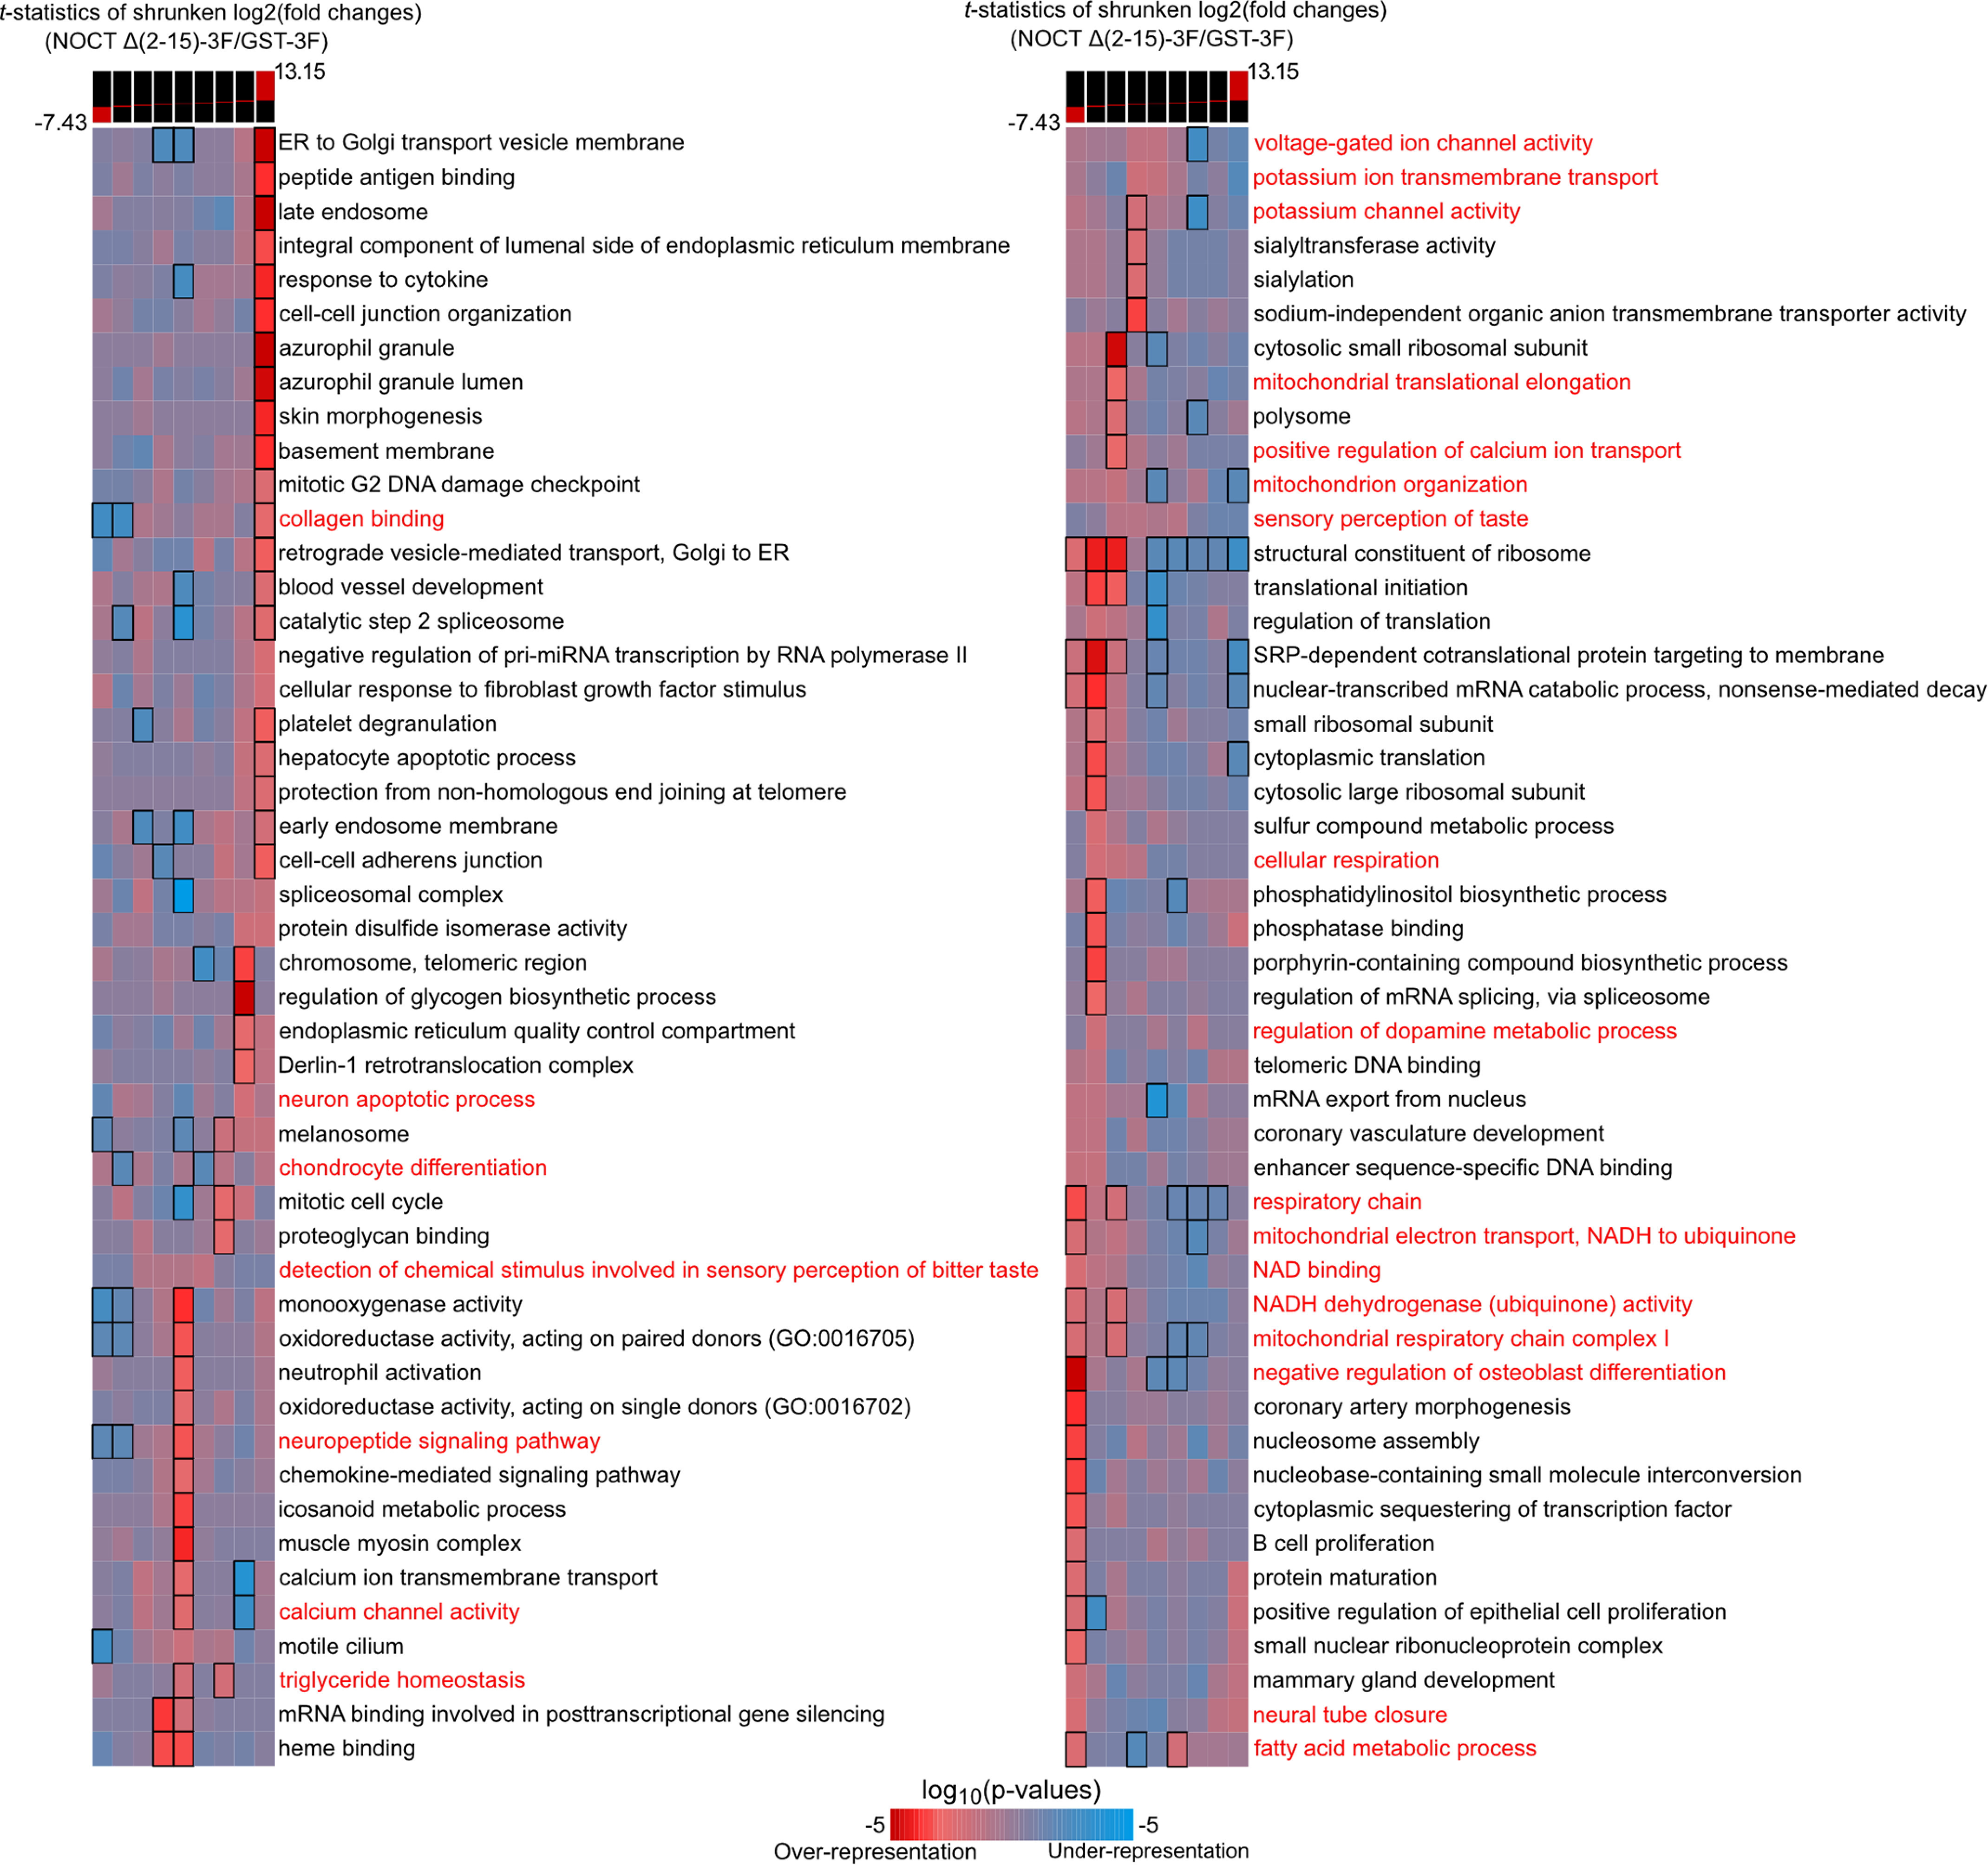
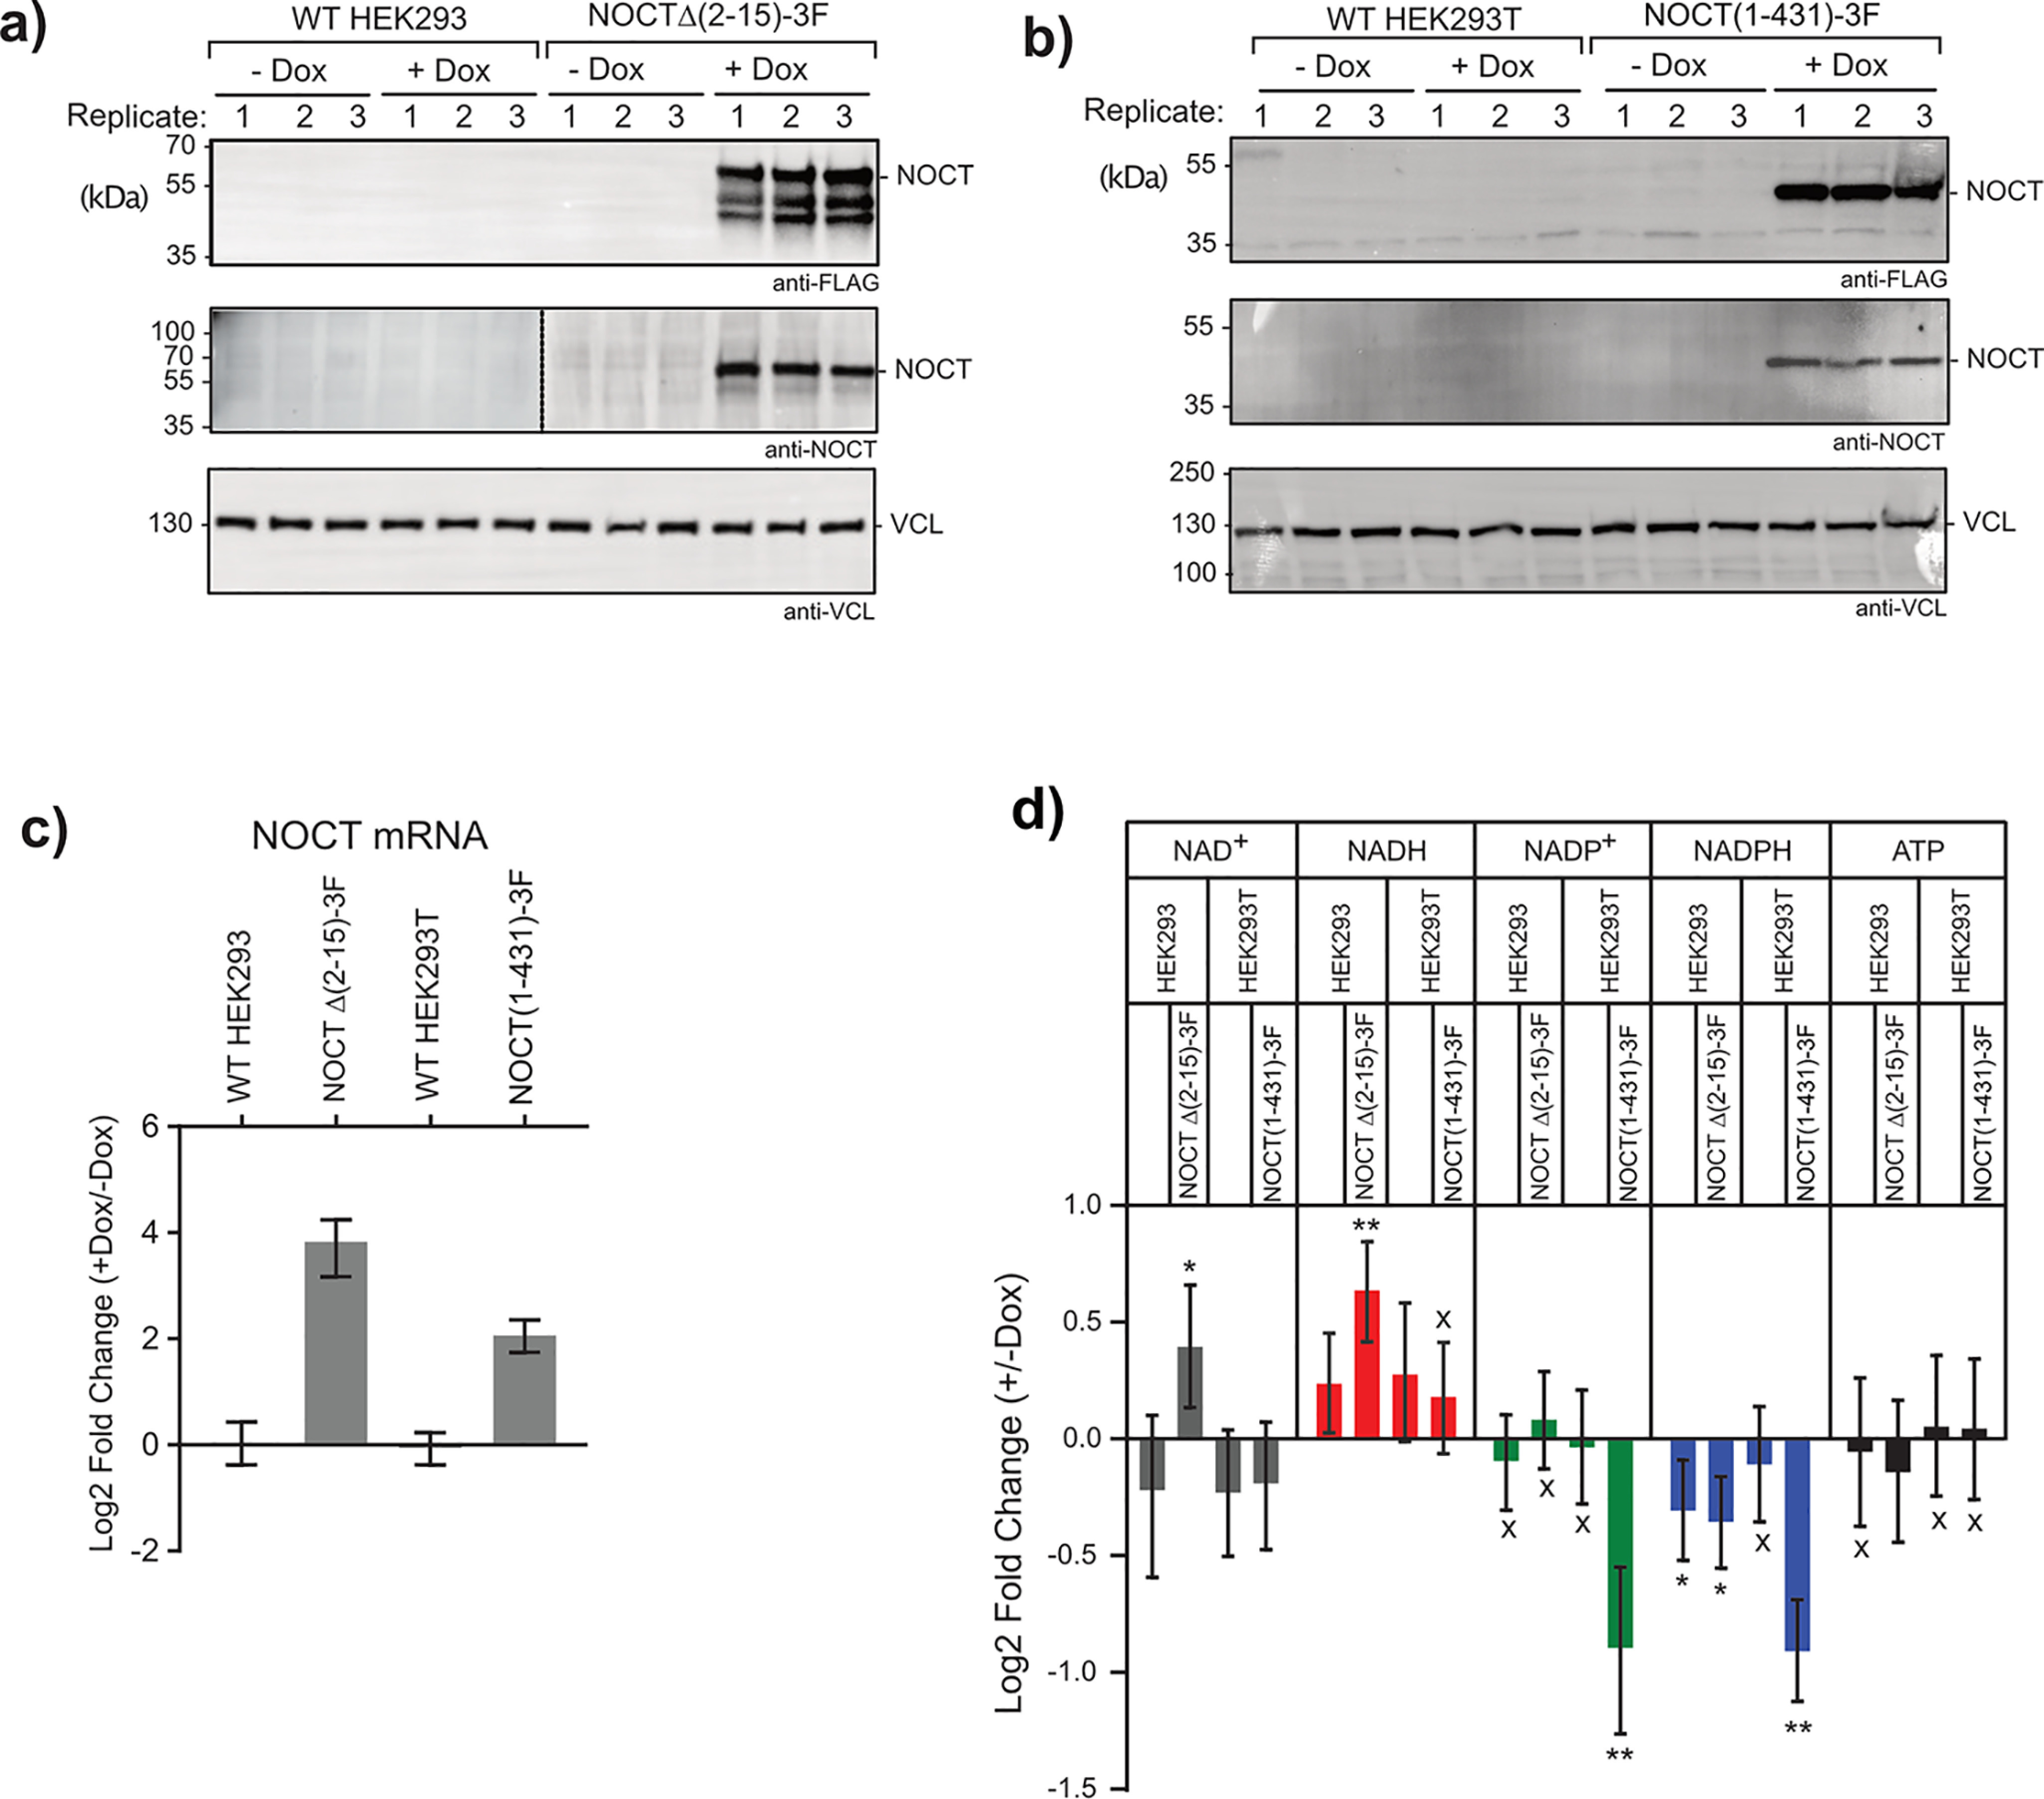
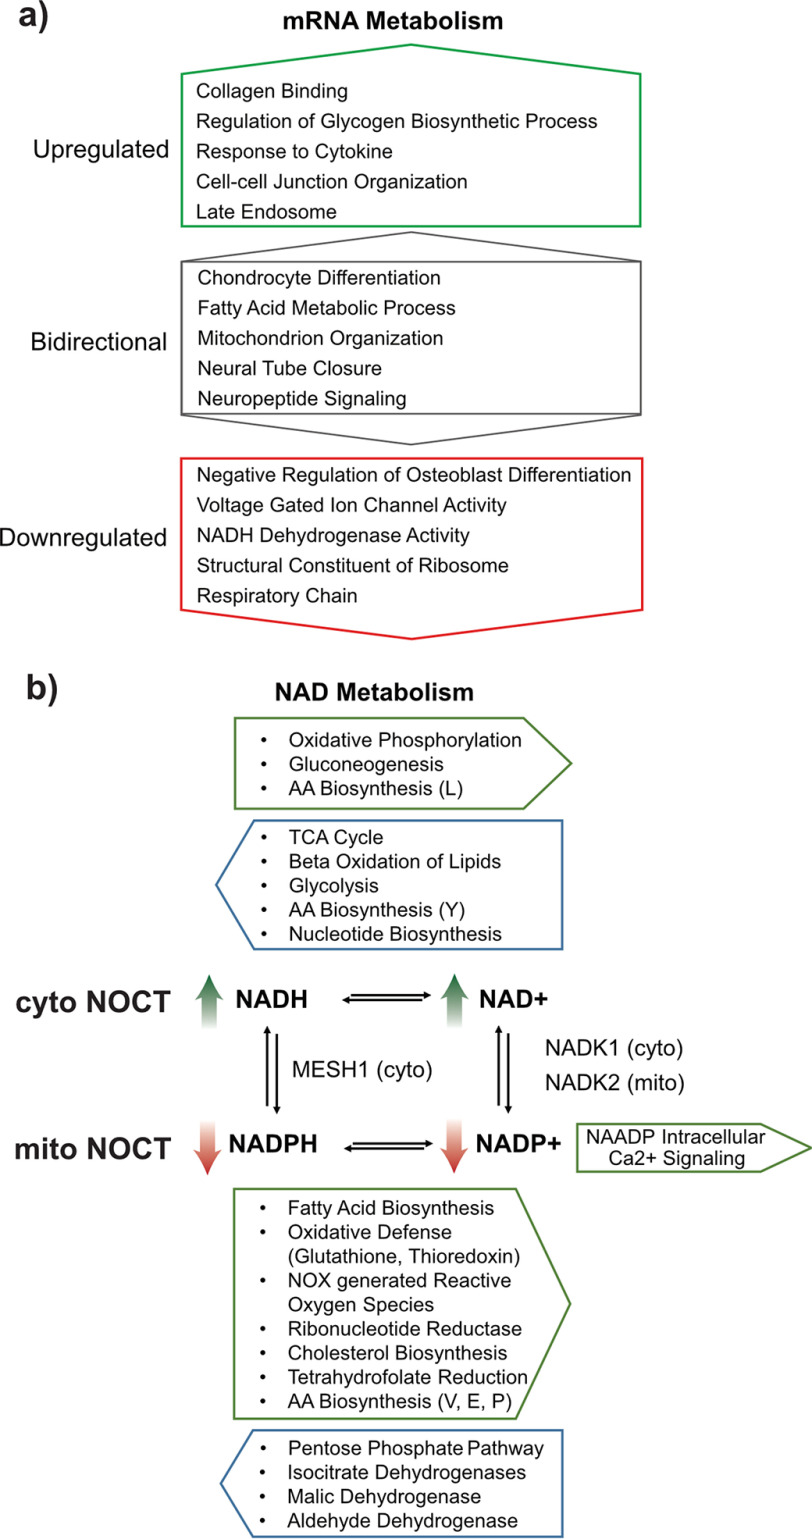
Nocturnin (NOCT) is a eukaryotic enzyme that belongs to a superfamily of exoribonucleases, endonucleases, and phosphatases. In this study, we analyze the expression, processing, localization, and cellular functions of human NOCT. We find that NOCT protein is differentially expressed and processed in a cell and tissue type-specific manner to control its localization to the cytoplasm or mitochondrial exterior or interior. The N terminus of NOCT is necessary and sufficient to confer import and processing in the mitochondria. We measured the impact of cytoplasmic NOCT on the transcriptome and observed that it affects mRNA levels of hundreds of genes that are significantly enriched in osteoblast, neuronal, and mitochondrial functions. Recent biochemical data indicate that NOCT dephosphorylates NADP(H) metabolites, and thus we measured the effect of NOCT on these cofactors in cells. We find that NOCT increases NAD(H) and decreases NADP(H) levels in a manner dependent on its intracellular localization. Collectively, our data indicate that NOCT can regulate levels of both mRNAs and NADP(H) cofactors in a manner specified by its location in cells.

Keywords: NOCT; Nocturnin; exoribonuclease; gene regulation; mRNA; mRNA decay; mitochondria; nicotinamide adenine dinucleotide; nicotinamide adenine dinucleotide (NAD); ribonuclease.


Conflict of interest statement

Conflict of interest—The authors declare that they have no conflicts of interest with the contents of this article.

Figures

Figure 1.
Figure 1.
NOCT protein is post-translationally processed in a manner consistent with mitochondrial targeting. a, diagram of the NOCT protein-coding sequence. The locations of a predicted MTS and EEP domain are indicated. Two potential translation sites are indicated at the top (methionine codons Met-1 and Met-67). The location of a predicted MPP cleavage site, Leu-74, is indicated at the bottom. Predicted molecular weights of the resulting NOCT isoforms are indicated. b, Western blotting analysis of translation initiation of NOCT protein. Endogenous NOCT protein was detected in cell extracts from human embryonic kidney (HEK293) or human liver (HepG2) cell lines, indicated at the top. The apparent molecular weights of endogenous NOCT protein were observed at 41 kDa in HEK293 cells and 55 kDa in HepG2 cells. NOCT protein expression in HEK293 cells was also analyzed in cells transiently transfected with WT NOCT cDNA encoding amino acids 1–431. The role of the two potential initiation sites was tested by mutating the Met-1 AUG codon to GGG (M1X) or the Met-67 AUG codon to a glycine codon, GGG (M67G). The role of the N-terminal predicted MTS in processing of NOCT protein was tested; deletion of the MTS in NOCTΔ(2–15) or NOCTΔ(2–15)+M67G abolishes processing, consistent with mitochondrial localization and processing. Mock, untransfected cells. For all Western blots, an equal mass of protein from cell lysates was loaded in each lane of the gel. NOCT protein was detected using Western blotting with antigen affinity–purified, rabbit polyclonal α-NOCT antibody. Purified rNOCT(64–431) served as a positive control for Western blotting detection. Blots were probed using α-GAPDH antibody to assess equivalent loading of the samples. Molecular weight markers in kDa are indicated on the left. Apparent molecular weights are indicated on the right. The vertical dashed line indicates where the blot was cropped to assemble the figure. c, same approach as in b except using the human colon carcinoma cell line HCT116. d, processing of NOCT protein requires the MTS. Shown is expression of NOCT in HEK293 cells from transfected plasmid that expresses the coding sequence fused to C-terminal 3×FLAG epitope tag. NOCT(1–431)-3F is processed to produce a 44-kDa product, including 3 kDa of additional mass from the C-terminal 3×FLAG tag. Deletion of the MTS in NOCTΔ(2–15)-3F results in expression of a 58-kDa form of NOCT-3F, and deletion of amino acids 2–67 resulted in expression of NOCTΔ(2–67)-3F of 44 kDa. An equal mass of protein from cell lysates was analyzed for each sample. NOCT was detected using Western blotting with α-FLAG (left) and rabbit α-NOCT (right). Western blotting of vinculin using α-VCL assess equivalent loading of the lanes. e, detection of processed (44-kDa) and unprocessed (58-kDa) NOCT in HEK293 cells transfected with titration of plasmid expressing full-length NOCT(1–431)-3F in HEK293 cells. The amount of NOCT expression vector is indicated at the top. NOCT was detected using Western blotting with rabbit α-FLAG. An equivalent mass of protein from each cell lysate was analyzed in each lane of the gel. Blots were reprobed using α-VCL to assess equivalent loading of the gel lanes.
Figure 2.
Figure 2.
NOCT protein fractionates with mitochondria. a, fractionation of HEK293T cells provides evidence that overexpressed NOCT is imported and processed in mitochondria. Shown is Western blotting of subcellular fractions (including total, cytosol, and mitochondria) prepared from HEK293T cells that were transfected with NOCT(1–431)-3F. The mitochondrial fractions were divided into three equal aliquots and were either left untreated, treated with proteinase K, or treated with both proteinase K and Triton X-100. The fractions were then analyzed by SDS-PAGE and Western blotting with the indicated antibodies. NOCT was detected using guinea pig polyclonal anti-NOCT and goat monoclonal anti-DDDDK (FLAG) antibodies. Fractionation was validated using the following antibodies: anti-uL4m and anti-uS15m for the mitochondrial matrix, anti-mitofusin 2 and anti-TOM20 for the outer mitochondrial membrane (OMM), anti-histone H3 for the nucleus, and anti-uL1 for the cytoplasm. Apparent molecular weights are indicated on the right. b, fractionation of HepG2 cells shows that endogenous 55-kDa NOCT is located in the cytosol and exterior of the mitochondria, where it is susceptible to degradation by proteinase K. Western blotting of the indicated fractions from HepG2 cells was performed using anti-NOCT antibody.
Figure 3.
Figure 3.
The N terminus of NOCT is necessary and sufficient for processing and mitochondrial localization. a, immunofluorescence analysis of intracellular localization of NOCT constructs in HEK293 human cell line. NOCT(1–431)-3F is localized to the mitochondria, whereas NOCTΔ(2–15)-3F and NOCTΔ(2–67)-3F constructs, which lack the MTS, are predominantly localized to the cytoplasm. The indicated NOCT expression plasmids were transfected into HepG2 cells and visualized using anti-FLAG mAb immunofluorescence against the C-terminal 3×FLAG epitope on each construct with Alexa Fluor Plus 488 secondary antibody (green). Mitochondria are visualized with MitoTracker Red CMXRos (red), and nuclei are visualized with DAPI (blue). White scale bar, 10 μm. Western blotting of the NOCT proteins is shown in Fig. S2a and verifies their expression and processing. b, the N terminus of NOCT is sufficient to confer protein processing consistent with mitochondrial localization. The N-terminal 86 amino acids of NOCT were fused to the N terminus of EGFP to create the NOCT(1–86) EGFP expression construct, which was then transfected into HEK293 cells. Cells transfected with the EGFP construct served as a control. Equal amounts of cell lysates were then analyzed by SDS-PAGE and Western blotting using anti-EGFP antibody or, as a loading control, anti-VCL. Molecular weight markers in kDa are indicated on the left. Apparent molecular weights are indicated on the right. c and d, NOCT(1–86) EGFP protein (green) is localized to the mitochondria in HEK293 cells (c) or 143B cells (d). Mitochondria are visualized with MitoTracker (red), and nuclei are visualized with DAPI (blue). White scale bar, 10 μm.
Figure 4.
Figure 4.
NOCT protein is differentially expressed in human and mouse tissues. Western blotting of human (a) and mouse (b) tissues, indicated at the top, was performed using rabbit polyclonal anti-NOCT antibody. Commercially produced tissue blots contain 50 µg of each tissue. Bands in the 40–55 kDa range are considered feasible to be NOCT. Molecular weight markers are indicated on the left. Apparent molecular weights of NOCT bands detected in human brain, heart, kidney, liver, and skeletal muscle and in mouse brain, heart, kidney, liver, lung, skeletal muscle, stomach, spleen, and testis are indicated on the right. Each membrane was stained with amido black prior to Western blotting to assess protein content of each tissue sample and detect the molecular weight markers, as shown in the bottom panels.
Figure 5.
Figure 5.
Impact of cytoplasmic NOCTΔ(2–15)-3F on the transcriptome. a, GST-3F or NOCTΔ(2–15)-3F proteins were stably transfected and expressed in three separate clonal HEK293 cell lines, as assessed by Western blotting of equal mass of each cell extract using α-FLAG. Western blotting detection of VCL confirmed equivalent loading of the gel lanes. The vertical dashed line indicates where the blot was cropped to assemble the figure. b, differential gene expression was measured by performing RNA-Seq on rRNA-depleted RNA isolated from the three clonal HEK293 cell lines that overexpressed NOCTΔ(2–15)-3F relative to the three negative control HEK293 cell lines that expressed GST-3F. Gene expression changes were analyzed using DESeq2. Log2 -fold changes of gene expression were plotted versus the log2 average relative expression level of all six samples, measured in TPM. The scaled color shows the counts of genes in each hex-bin. Red points indicate genes with significant changes in gene expression by an adjusted p value threshold of 0.05. The black labels indicate genes with expression changes ≥4-fold. In b and c, blue labels point to the values for overexpressed NOCTΔ(2–15)-3F and the endogenous NOCT, and the labeled boxes indicate genes for which we obtained qPCR validation. c, volcano plot comparing statistical significance of measurements versus the log2 -fold change in gene expression between NOCTΔ(2–15)-3F and GST-3F conditions. The red points and labels show the genes that have a ≥4-fold change, whereas black points are for genes with <4-fold changes but ≥2-fold changes, and gray points are for genes with <2-fold changes. Dashed line, FDR-corrected p value threshold of 0.05. All data and statistics for the RNA-Seq analysis are reported in Table S1. d, corroboration of NOCT-mediated regulation of FRRS1L, RORB, PTPRZ1, DLGAP1, and TMEFF2 mRNAs by RT-qPCR. The expression level of each gene was measured in RNA isolated from three replicate samples from each of the three clonal HEK293 cell lines expressing either NOCTΔ(2–15)-3F or GST-3F. The log2 -fold change of each gene was then calculated as described under “Experimental procedures” and plotted along with the log2 -fold changes measured in the RNA-Seq analysis. The 95% credible intervals for each measurement are indicated above and below the mean log2 -fold change values. The asterisk indicates that the observed -fold change measured in the RNA-Seq assay has an FDR-corrected p value of <1 × 10⁻⁸. For the RT-qPCR measurements, the black star indicates that there is a >95% posterior probability of a change of 2-fold. The B2M, ACTB, and TBP mRNAs were also measured and were unchanged in both RNA-Seq and RT-qPCR assays. Data and statistics are reported in Table S2.
Figure 6.
Figure 6.
Pathway enrichment analysis of gene expression changes in response to NOCTΔ(2–15)-3F. iPAGE was applied to identify pathways with significant mutual information with the observed expression changes. Expression changes are quantified using the t statistic of gene-specific shrunken log2 -fold changes estimated by DESeq2 (see “Experimental procedures” for details). The top panels above each heat map show how iPAGE divided the DESeq2 gene set into nine groups with equal gene counts based on the measured expression changes; the red range in each bin indicates the range of t statistics encompassed by that bin. The leftmost bin contains genes with the most negative gene expression change metrics, and the rightmost bin contains the most positive. The tile color intensities were quantified by log10 of the GO term enrichment p values from iPAGE. The colors of tiles show log10 p values for significant over- (red) or underrepresentation (blue) of genes in the corresponding expression bin. Terms with names in red type are relevant to functional categories highlighted in the text and supporting information, including functions related to bone or lipid homeostasis, mitochondria, NAD metabolism, and neuronal functions (Figs. S5S8, respectively, for each category). The in-plot descriptions for GO terms GO:0016702 and GO:0016705 are abbreviated and supplied with term numbers. Heavy tile borders indicate significant enrichments within a specific expression bin (p < 0.05 after Bonferroni correction across the rows of terms). Note that all displayed GO terms have significant mutual information with the overall gene expression change profile (as assessed by the default series of tests used by iPAGE; see “Experimental procedures” for details). Tables S1 and S3 describe the RNA-Seq data and statistics used in this analysis.
Figure 7.
Figure 7.
Effect of NOCT on cellular levels of NADH cofactors and ATP. a, Dox-inducible expression of NOCTΔ(2–15)-3F was confirmed in three separate pools of stably transduced HEK293 cells by performing anti-FLAG and guinea pig anti-NOCT Western blotting. NOCTΔ(2–15)-3F protein migrated with an apparent molecular weight of 58 kDa, consistent with unprocessed NOCT. WT HEK293 cells served as negative controls. Cells were treated with 1 µg/ml Dox (+Dox) for 72 h or the DMSO vehicle (−Dox). Equal mass of each cell lysate was loaded into each well, and VCL was detected by Western blotting to assess equivalent loading of lanes. The vertical dashed line indicates where the blot was cropped to assemble the figure. b, as in a, but using HEK293T cells with Dox-inducible NOCT(1–431)-3F that was introduced by the Flp-In T-REx system. NOCT(1–431)-3F protein migrated with a molecular mass of 44 kDa, consistent with mitochondrial protease processing. WT HEK293T cells served as negative controls. c, overexpressions of the stably expressed Dox-inducible NOCT constructs in the cell lines used in a and b were quantitated at the mRNA level using RT-qPCR. Each bar in the graph represents n = 9 from three replicate experiments with three biological replicates each. Log2 -fold change values were calculated for NOCT mRNA in the presence of Dox relative to without Dox. Mean log2 -fold change values are plotted along with 95% credible intervals. Data and statistics are reported in Table S2. d, NOCTΔ(2–15)-3F significantly increased levels of NAD+ and NADH, whereas NOCT(1–431)-3F significantly decreased levels of NADP+ and NADPH. The Dox-inducible and control cell lines were treated with either DMSO or 1 µg/ml Dox for 72 h. The levels of NAD+, NADH, NADP+, NADPH, and ATP were then measured in equal numbers of cells for each condition. Mean log2 -fold change in each metabolite was calculated in the Dox-induced condition relative to the uninduced condition. Mean log2 -fold change values are plotted for each measurement, along with 95% credible intervals. Measurements were derived from three replicate experiments, each of which contained three biological replicates. For significance calling, an asterisk denotes a posterior probability of >0.95 that the difference relative to the negative control is in the indicated direction. The double asterisk indicates a posterior probability of >0.95 that the indicated difference is at least 1.3-fold. An x marks a posterior probability of >0.95 that the indicated difference is no more than 1.3-fold in either direction. Data and statistical values are reported in Table S2.
Figure 8.
Figure 8.
Summary of NOCT-mediated effects on mRNA and NAD metabolism. a, overexpressed, cytoplasmic NOCT altered the levels of mRNAs from genes that are enriched in multiple GO terms. Examples of significantly overrepresented GO terms among genes whose levels were either increased (up-regulated) or decreased (down-regulated) by cytoplasmic NOCT are shown. The bidirectional category provides examples of enriched GO terms containing different member genes that exhibited up- and down-regulation. b, diagram of NAD cofactor metabolism and the effect of overexpressed forms of NOCT. NAD cofactors are metabolized by a variety of anabolic (green) and catabolic (blue) pathways, indicated above and below, which interconvert NAD cofactors between redox states. NADP+ can also be converted to the signaling molecule NAADP. In addition, NAD cofactors are interconverted between phosphorylation states, catalyzed by at least two kinases (NADK1 and NADK2) and phosphatases (MESH1 and NOCT). These kinases exhibit specific subcellular localization between cytoplasm (cyto) and mitochondria (mito), as indicated. Green arrows indicate the observed effect of cytoplasmic NOCT on increased NADH and NAD+ levels. Red arrows indicate the observed effect of mitochondrial NOCT on decreased levels of NADPH and NADP+.

Similar articles

Cited by

References

    1. Abshire E. T., Chasseur J., Bohn J. A., Del Rizzo P. A., Freddolino P. L., Goldstrohm A. C., and Trievel R. C. (2018) The structure of human Nocturnin reveals a conserved ribonuclease domain that represses target transcript translation and abundance in cells. Nucleic Acids Res. 46, 6257–6270 10.1093/nar/gky412 - DOI - PMC - PubMed
    1. Baggs J. E., and Green C. B. (2003) Nocturnin, a deadenylase in Xenopus laevis retina: a mechanism for posttranscriptional control of circadian-related mRNA. Curr. Biol. 13, 189–198 10.1016/S0960-9822(03)00014-9 - DOI - PubMed
    1. Blanco A. M., Gomez-Boronat M., Madera D., Valenciano A. I., Alonso-Gomez A. L., and Delgado M. J. (2017) First evidence of nocturnin in fish: two isoforms in goldfish differentially regulated by feeding. Am. J. Physiol. Regul. Integr. Comp. Physiol. 314, R304–R312 10.1152/ajpregu.00241.2017 - DOI - PubMed
    1. Green C. B., Douris N., Kojima S., Strayer C. A., Fogerty J., Lourim D., Keller S. R., and Besharse J. C. (2007) Loss of Nocturnin, a circadian deadenylase, confers resistance to hepatic steatosis and diet-induced obesity. Proc. Natl. Acad. Sci. U. S. A. 104, 9888–9893 10.1073/pnas.0702448104 - DOI - PMC - PubMed
    1. Grönke S., Bickmeyer I., Wunderlich R., Jäckle H., and Kühnlein R. P. (2009) Curled encodes the Drosophila homolog of the vertebrate circadian deadenylase Nocturnin. Genetics 183, 219–232 10.1534/genetics.109.105601 - DOI - PMC - PubMed

Publication types