. 2020 Sep 8;117(36):22193-22203.
doi: 10.1073/pnas.1913177117. Epub 2020 Aug 24.

CAMSAP1 breaks the homeostatic microtubule network to instruct neuronal polarity

Affiliations

CAMSAP1 breaks the homeostatic microtubule network to instruct neuronal polarity

Zhengrong Zhou et al. Proc Natl Acad Sci U S A. .

Abstract

The establishment of axon/dendrite polarity is fundamental for neurons to integrate into functional circuits, and this process is critically dependent on microtubules (MTs). In the early stages of the establishment process, MTs in axons change dramatically with the morphological building of neurons; however, how the MT network changes are triggered is unclear. Here we show that CAMSAP1 plays a decisive role in the neuronal axon identification process by regulating the number of MTs. Neurons lacking CAMSAP1 form a multiple axon phenotype in vitro, while the multipolar-bipolar transition and radial migration are blocked in vivo. We demonstrate that the polarity regulator MARK2 kinase phosphorylates CAMSAP1 and affects its ability to bind to MTs, which in turn changes the protection of MT minus-ends and also triggers asymmetric distribution of MTs. Our results indicate that the polarized MT network in neurons is a decisive factor in establishing axon/dendritic polarity and is initially triggered by polarized signals.

Keywords: CAMSAP1; MARK2; cell migration; neuronal polarity; noncentrosomal microtubules.


Conflict of interest statement

The authors declare no competing interest.

Figures
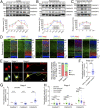
Fig. 1.
Fig. 1.
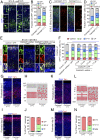
CAMSAP1 expression in the developing cortex and cultured hippocampal neurons. (AC, Upper) Western blot analysis of the expression levels of CAMSAPs in the cortex (A), hippocampus (B), and cultured neurons (C). (AC, Bottom) Quantification analysis of the protein expression in AC (n = 3 to 8 groups per condition). (D) Distribution of CAMSAPs in coronal sections of the cerebral cortex at P0. Map2 and L1 label the dendrites and callosal axons in mature neurons, respectively. (E, Left) distribution of CAMSAP1 in cultured neurons from stage 1 to stage 3. Arrows in stage 3 neuron indicate CAMSAP1 accumulation at the tip of the axon. (E, Right) Quantification analysis of neurons with CAMSAP1 accumulation in neurite tips of stage 2 or axonal tips of stage 3 (n = 161 and 183 neurons, respectively). (F) Quantification analysis of the distribution of CAMSAP1 in neurites from stage 2/3 (n = 57 neurons). (G and H) Quantification analysis of the total (G) and segmental (H) distribution of CAMSAPs in dendrites and axons from stage 3 neurons (n = 36 and 39 neurons, respectively). Data represent mean ± SEM. N.S., not significant (P > 0.05). ***P < 0.001, paired Student’s t test. (Scale bars: 10 μm in E; 50 μm in D.)
Fig. 2.
Fig. 2.
CAMSAP1 regulates neuronal polarization. (A) Representative images of in vitro cultured neurons from Camsap1(+/+) and Camsap1(−/−) mice at DIV3. Tau-1 (axons), Map2 (dendrites). (B) Percentage of neurons with single, multiple, and no axons in A. (CF) Ratio of the lengths of the longest and the second-longest neurite (C), length of the longest neurite (D), total length of neurites per neuron (E), and number of neurites per neuron (F) (n = 337 and 449 neurons, respectively). (G) Immunostaining for GFP, Tau-1, and Map2 in in vitro cultured neurons at DIV3 after transfection with different plasmids. (H) Percentage of neurons with single, multiple, and no axons in G (n = 117 to 317 neurons per condition). (I) In mice at E14.5, the neocortex was subjected to IUE with GFP-encoding plasmid. (Left) Representative image of immunofluorescence staining for DAPI and GFP in cortical coronal sections from E17.5 embryos. (Right, Inset) The various morphologies of neurons in the cortex. (J) The neuron morphologies in I were divided into four classes. (K) Quantification analysis of different morphologies of neurons in the IZ (n = 870 and 415 neurons from four and three brains, respectively). (L) In mice at E14.5, the neocortex was subjected to IUE with mCherry-encoding shRNA, and a GFP-encoding plasmid was cotransfected to depict the neurons. Immunofluorescence staining for DAPI, GFP, and mCherry in cortical coronal sections from E17.5 embryos is shown. (M) Quantification analysis of different morphologies of neurons in the IZ and CP (n = 1,757 and 1,535 neurons from three brains, respectively). Data represent mean ± SEM. N.S., not significant (P > 0.05). ***P < 0.001, paired Student’s t test. (Scale bars: 20 μm in A and G; 50 μm in I and L.)
Fig. 3.
Fig. 3.
CAMSAP1 regulates radial migration and cortical lamination. In mice at E14.5, the neocortex was subjected to IUE with GFP-encoding plasmid (A) or mCherry-encoding shRNA plus GFP- or CAMSAP1R-GFP-encoding plasmid (E). (A) Immunostaining for DAPI and GFP in the cortical coronal section from E18.5 embryos. Arrowheads indicate the neurons. (B) Quantification analysis of the distribution of GFP+ neurons across different cortical regions (n = 5,293 and 3,838 neurons from four and five brains, respectively). (C) Pregnant mice were injected with BrdU at E14.5. Coronal sections of brain collected at E18.5 were analyzed by immunostaining for DAPI, Map2, and BrdU. (D) Quantification analysis of the distribution of BrdU+ neurons across the different cortical regions (n = 4,702 and 3,881 neurons from three brains, respectively). (E) Staining for DAPI, GFP, and mCherry in cortical coronal sections from E18.5 embryos. Arrowheads indicate the neurons that migrated to the CP. (F) Quantification analysis of the distribution of GFP+ and mCherry+ neurons across the different cortical regions in E (n = 3,683 to 4,538 neurons from four to five brains per condition). (G and K) Representative images of the distribution of Tbr1+ neurons. Immunofluorescence staining for DAPI and Tbr1 in the cortex from P0 mice (G) and P21 mice (K). (H and L) Schematic diagrams of the distribution of TBR1+ neurons in G and K. (I and M) Representative images of the distribution of Cux1+ neurons on immunofluorescence staining for DAPI and Cux1 in the cortex from P0 mice (I) and P21 mice (M). (J and N) Quantification analysis of the Cux1+ neurons in I and M (n = 2,327 to 13,686 neurons from four and three brains, respectively). Data represent mean ± SEM. N.S., not significant (P > 0.05). (*P < 0.05, **P < 0.01, ***P < 0.001, paired Student’s t test. (Scale bars: 50 μm in A, C, G, and I; 100 μm in E, K, and M.)
Fig. 4.
Fig. 4.
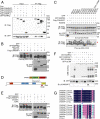
MARK2 interacts with CAMSAP1 and phosphorylates S1485 of CAMSAP1. Phos-tag was used in SDS/PAGE, and the red arrowheads indicate the shifted bands caused by phosphorylation in B, C, and E. (A) MARK2 associates with CAMSAPs. HEK293 cells were cotransfected with the indicated plasmids, and then their lysates were subjected to immunoprecipitation with anti-Flag antibodies and proteins were detected by immunoblotting. Microtubule binding protein CRMP-2 served as a negative control. (B) MARK2 phosphorylates CAMSAP1 via the interaction between CAMSAP1 and MARK2. (C) MARK2 phosphorylates CAMSAP1 at S1485. A potential phosphor site was mutated into Ala to prevent the phosphorylation. (D) Schematic diagram showing the relationship between MARK2 and CAMSAP1. (E) The MARK2-dependent phosphorylation site of CAMSAP1 is located in the CKK domain. (F) Bacterially produced MARK2 was incubated with CAMSAP1 or its mutants to perform an in vitro kinase assay. The red arrowhead designates the band of GST-MARK2. (G) Sequence alignment of CAMSAP1 orthologs across species (Upper) and of CAMSAP/Patronin/PTRN-1 family members (Lower). Arrowheads indicate the S1485 of CAMSAP1.
Fig. 5.
Fig. 5.
CAMSAP1 controls neuronal polarity in response to the activity of MARK2. (A, Left) Western blot analysis of the protein levels of pCAMSAP1 (S1485) in cultured neurons. The asterisk shows the band of pCAMSAP1. (A, Right) quantification analysis of the protein expression on the left (n = 5). (B) Representative images of immunofluorescences staining for GFP, Tau-1, and Map2 in the neurons at DIV3 after transfection with indicated plasmids. (C) Quantification analysis of neurons with a single axon, multiple axons, or no axon in B (n = 159 to 366 neurons per condition). (D) Western blot analysis of the expression levels of S1485A and S1485D in neurons (n = 3). (E) Representative images of immunofluorescences staining for GFP and mCherry (Upper and Middle) and Tau-1 (Bottom) in the neurons at DIV3 after transfection with indicated plasmids. (F) Quantification analysis of E (n = 220 to 245 neurons per condition). Data represent mean ± SEM. N.S., not significant (P > 0.05). *P < 0.05, **P < 0.01, ***P < 0.001, unpaired Student’s t test. (Scale bars: 50 μm.)
Fig. 6.
Fig. 6.
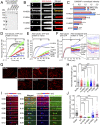
Phosphorylation of CAMSAP1 alters its MT-binding ability. (A) CBB staining of a gel with GFP-CAMSAP1 and mutant proteins purified from sf9 cells. (B) Representative TIRF microscopy images of the MT-binding ability assay. Taxol-stabilized MTs were attached to the coverslip, and CAMSAP1 or mutant was added to the chamber to allow binding with MT minus-ends. (C) Quantification of CAMSAP1 and mutant intensities at MT minus-end and on the MT lattice (minus-end, n = 38 to 51 MTs per condition; lattice, n = 52 to 115 MTs per condition). (D) MT polymerization was monitored by measuring the absorbance (turbidity) at 340 nm for 60 min. Taxol (5 μM) or CAMSAP1 at different concentrations was mixed with the tubulin solution (n = 3). (E) MT polymerization was monitored by measuring absorbance at 340 nm for 60 min. Taxol (5 μM) or CAMSAP1/mutant (500 nM) was mixed with the tubulin solution (n = 5). (F) MT polymerization and depolymerization was monitored by measuring the absorbance (turbidity) at 340 nm. The tubulin solution was polymerized for 30 min, and then 5 μM Taxol or 400 nM CAMSAP1/mutant was mixed with 5 μM nocodazole and added to the solution to measure the absorbance for another 30 min (n = 5). The graph at right provides information on depolymerization, and statistical analyses were performed at the bottom of the curve between WT and mutants. (G) Representative images of MTs in E and tubulin labeled with cy3. (H) Length of MTs in G (n = 684 to 3,588 MTs per condition). (I) Representative time lapses of dilution experiments with buffer (Left) or GFP-CAMSAP1 (Right). Red arrowheads indicate the minus-end localization of CAMSAP1. The timestamp indicates the time after washout (min:s). (J) Quantification of MTs minus-end depolymerization rate in the presence of buffer, CAMSAP1, or mutants (n = 60 to 136 MTs per condition). Data represent mean ± SEM. N.S., not significant (P > 0.05). ***P < 0.001, unpaired Student’s t test. (Scale bars: 1 μm for B and I; 10 μm for G.)
Fig. 7.
Fig. 7.
CAMSAP1 is required for the asymmetric distribution of MTs. (A) Representative SIM images of CAMSAP1 in stage 3 cultured neurons after the removal of soluble substances. Panels 1, 2, and 3 show higher-magnification images, and the arrowheads in these panels indicate points at which CAMSAP1 interacts with MTs. (B and C) Quantification analysis of the percentage of MT-binding CAMSAP1 clusters in total (B) and per unit length (C) in minor neurites, the longest neurite of stage 2/3 neurons, and in the dendrite, the axon of stage 3 neurons (n = 44 and 47 neurons, respectively). (D) Fitted line plots of CAMSAP1 cluster number and microtubule intensity from neurons in B and C. (E) Representative images of immunostaining for Tuj1 and phalloidin in cultured WT neurons. (F and G) Ratio of fluorescence signal intensity in the longest neurite to the average signal intensity in all neurites (F) or of the longest neurite to the second-longest neurite (G) (n = 17 and 20 neurons, respectively). (H) Representative images of immunostaining for Tuj1 and phalloidin in cultured WT and Camsap1(−/−) neurons at stage 2–3. (I and J) Ratio of the fluorescence signal intensity in the longest neurite to the average signal intensity in all neurites (I) or of the longest neurite to the second-longest neurite (J) (n = 67 and 37 neurons, respectively). Data represent mean ± SEM. N.S., not significant (P > 0.05). ***P < 0.001; *P < 0.05, paired Student’s t test. (Scale bars, 1 μm in A; 10 μm in E and H.)

References

    1. Araújo S. J., Tear G., Axon guidance mechanisms and molecules: Lessons from invertebrates. Nat. Rev. Neurosci. 4, 910–922 (2003). - PubMed
    1. Shelly M., Poo M. M., Role of LKB1-SAD/MARK pathway in neuronal polarization. Dev. Neurobiol. 71, 508–527 (2011). - PubMed
    1. Kapitein L. C., Hoogenraad C. C., Building the neuronal microtubule cytoskeleton. Neuron 87, 492–506 (2015). - PubMed
    1. Baas P. W., Rao A. N., Matamoros A. J., Leo L., Stability properties of neuronal microtubules. Cytoskeleton (Hoboken) 73, 442–460 (2016). - PMC - PubMed
    1. Conde C., Cáceres A., Microtubule assembly, organization and dynamics in axons and dendrites. Nat. Rev. Neurosci. 10, 319–332 (2009). - PubMed

Publication types

LinkOut - more resources