. 2020 Aug 24;10(1):14097.
doi: 10.1038/s41598-020-70455-7.

Gut bacteria-derived peptidoglycan induces a metabolic syndrome-like phenotype via NF-κB-dependent insulin/PI3K signaling reduction in Drosophila renal system

Affiliations

Gut bacteria-derived peptidoglycan induces a metabolic syndrome-like phenotype via NF-κB-dependent insulin/PI3K signaling reduction in Drosophila renal system

Olivier Zugasti et al. Sci Rep. .

Abstract

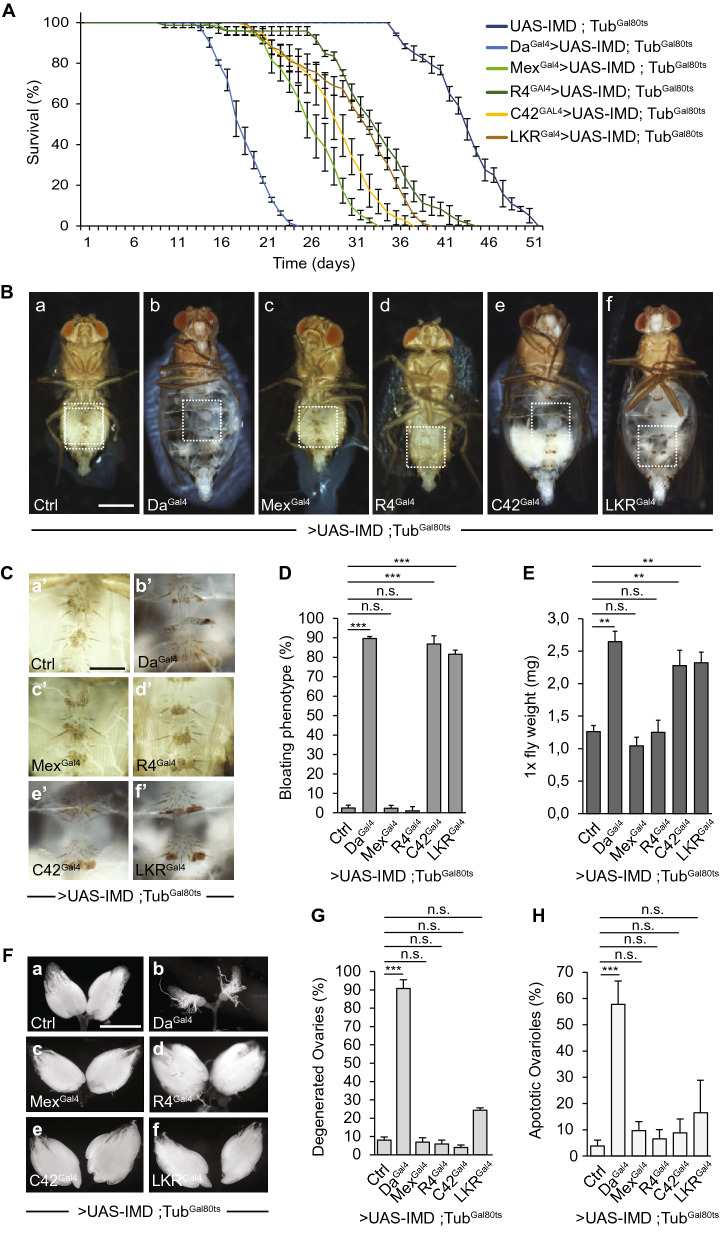
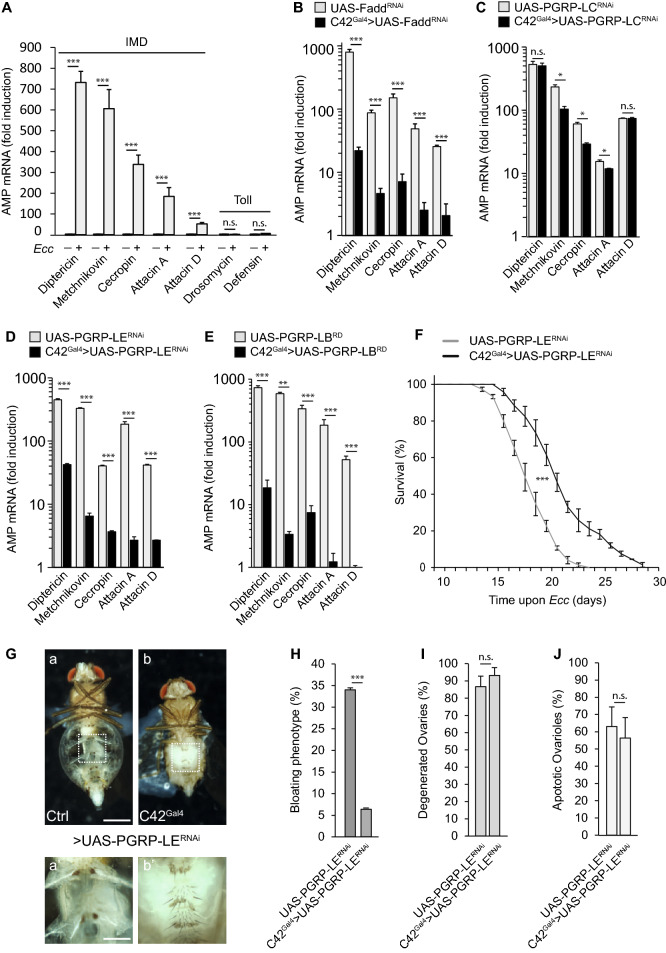
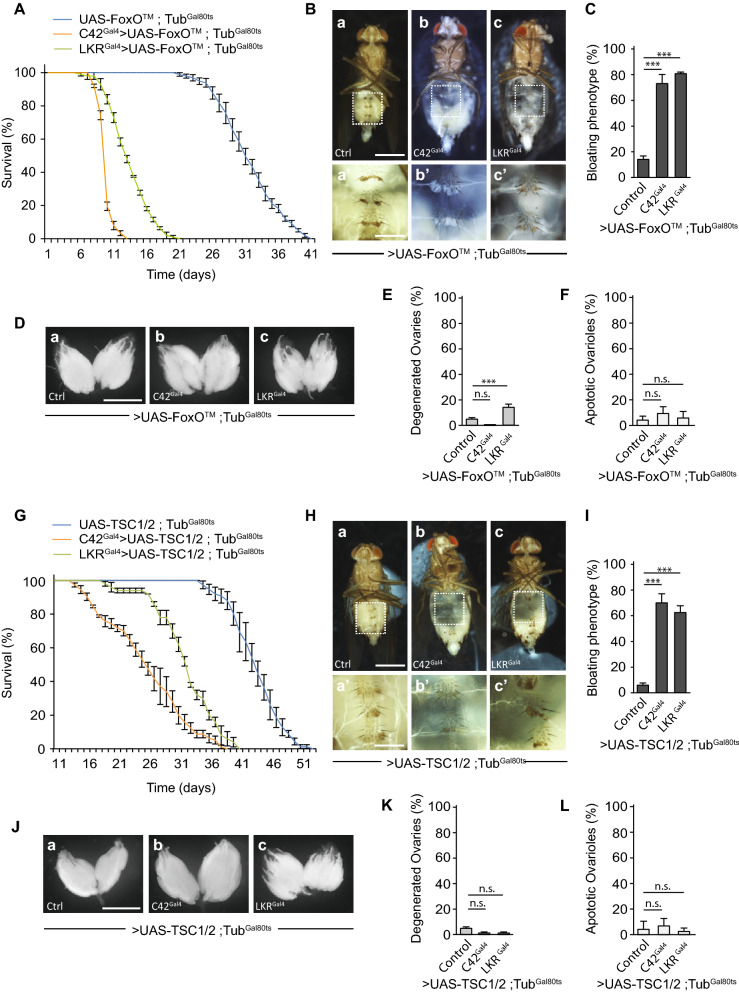
Although microbiome-host interactions are usual at steady state, gut microbiota dysbiosis can unbalance the physiological and behavioral parameters of the host, mostly via yet not understood mechanisms. Using the Drosophila model, we investigated the consequences of a gut chronic dysbiosis on the host physiology. Our results show that adult flies chronically infected with the non-pathogenic Erwinia carotorova caotovora bacteria displayed organ degeneration resembling wasting-like phenotypes reminiscent of Metabolic Syndrome associated pathologies. Genetic manipulations demonstrate that a local reduction of insulin signaling consecutive to a peptidoglycan-dependent NF-κB activation in the excretory system of the flies is responsible for several of the observed phenotypes. This work establishes a functional crosstalk between bacteria-derived peptidoglycan and the immune NF-κB cascade that contributes to the onset of metabolic disorders by reducing insulin signal transduction. Giving the high degree of evolutionary conservation of the mechanisms and pathways involved, this study is likely to provide a helpful model to elucidate the contribution of altered intestinal microbiota in triggering human chronic kidney diseases.


Conflict of interest statement

The authors declare no competing interests.

Figures

Figure 1
Figure 1
Chronic activation of the NF-κB cascade by bacteria-derived peptidoglycan reduces longevity and causes organ wasting. (A) Quantitative RT-PCR analysis of the expression of the NF-κB target gene Diptericin (Dipt.) in whole wild-type flies upon acute (5 h) and chronic enteric dysbiosis. The difference between control and chronically infected flies is significant (***p < 0.001; ANOVA test). (B) Survival of wild-type flies in control conditions and after acute (5 h) or chronic infection with Ecc. The difference between control and chronically infected flies is significant (***p < 0.001; one-sided log rank test). (C) Survival of wild-type and DreddD55 mutant flies upon chronic infection. The difference between infected wild-type and DreddD55 mutant flies is significant (***p < 0.001; one-sided log rank test). (D) Representative pictures of wild type (a–c) and DreddD55 mutant flies (e–g) in control conditions (a, b and e, f) and infected with Ecc for 30 days (c, d and g) (scale bar, 0.5 mm). aʹ–gʹ, magnified fat bodies views of the boxed regions (scale bar, 0.15 mm). (E) Average percent of wild type and DreddD55 mutant flies displaying abdominal bloating in control conditions or upon chronic infection. Comparisons between selected conditions are shown (Fisher’s exact test; ns, not significant; ***p < 0.001). (F) Weight measurements of wild-type and DreddD55 mutant flies in control conditions or infected. Comparisons between selected conditions are shown (Mann Whitney test; ns, not significant; **p < 0.01). (G) Representative pictures of ovaries from wild-type and DreddD55 mutant flies in control conditions (a, c and b, d, respectively) and after chronic dysbiosis (30 days) (e and f) (scale bar, 0.5 mm). (H) Average percent of ovary atrophy in wild-type and DreddD55 flies in control conditions or upon enteric dysbiosis for 30 days. Comparisons between selected conditions are shown (Fisher’s exact test; ns, not significant; ***p < 0.001). (I) Average percent of ovarioles that contained apoptotic nurse cells in wild type and DreddD55 flies in control conditions or infected for 30 days. Comparisons between selected conditions are shown (Mann Whitney test; ns, not significant; ***p < 0.001).
Figure 2
Figure 2
Constitutive IMD/NF-κB signaling in Malpighian tubule cells causes premature death, fluid buildup and fat body wasting. (A) Survival of control flies (UAS-IMD, TubGal80ts) and flies overexpressing IMD ubiquitously (DaGal4 > UAS-IMD, TubGal80ts) or specifically in enterocytes (MexGal4 > UAS-IMD, TubGal80ts), fat body cells (R4Gal4 > UAS-IMD, TubGal80ts) and in Malpighian principal or stellate cells (C42gal4 > UAS-IMD, TubGal80ts and LKRGal4 > UAS-IMD, TubGal80ts, respectively). The difference between control flies and those overexpressing IMD is significant (p < 0.001 respectively; one-sided log rank test). (B) Representative pictures of control flies (a) and those overexpressing IMD (b–f) (scale bar, 0.5 mm). (C) Magnified fat bodies views of the boxed regions in (B) (scale bar, 0.15 mm). (D) Average percent of flies displaying abdominal bloating in control conditions and after overexpressing IMD. Comparisons between selected conditions are shown (Fisher’s exact test; ns, not significant; ***p < 0.001). (E) Weight measurements of control flies and those overexpressing IMD. Comparisons between selected conditions are shown (Mann Whitney test; ns, not significant; **p < 0.01). (F) Representative pictures of ovaries from control flies (a) and upon activation of the IMD cascade by overexpression of IMD (b–f) (scale bar, 0.5 mm). (G) Average percent of ovary atrophy in control flies and those overexpressing IMD. Comparisons between selected conditions are shown (Fisher’s exact test; ns, not significant; ***p < 0.001). (H) Average percent of ovarioles that contained apoptotic nurse cells in control conditions and upon constitutive activation of the IMD cascade. Comparisons between selected conditions are shown (Mann Whitney test; ns, not significant; ***p < 0.001).
Figure 3
Figure 3
Intracellular detection of PGN by MT cells activates NF-κB signaling and causes fluid retention and fat body degeneration. (A) Quantitative RT-PCR analysis of the expression of IMD/NF-kB target AMP genes Diptericin, Metchnikovin, Cecropin, Attacin A and Attacin D and Toll target genes Drosomycin and Defensin in Malpighian tubules upon enteric dysbisosis. Comparisons between control and Ecc infected flies are shown (Mann Whitney test; ns, not significant, ***p < 0.001). In this and subsequent RT-PCR assays, the analysis of the activation of the NF-κB signaling was performed 24 h after oral infection with Ecc. (BE) Quantitative RT-PCR analysis of the expression of IMD/NF-κB antimicrobial target genes upon enteric dysbiosis after RNAi-mediated inactivation of NF-κB pathway components Fadd (B), PGRP-LC (C) and PGRP-LE (D) or overexpression of the cytosolic amidase PGRP-LBRD (E) in MT principal cells. Results are presented relative to those of control uninfected flies. Comparisons between selected conditions are shown (Mann Whitney test; ns, not significant, ***p < 0.001, **p < 0.01; *p < 0.1). (F) Survival of control flies (UAS-PGRP-LERNAi) and after RNAi-mediated inactivation of PGRP-LE in MT principal cells (C42Gal4 > UAS-PGRP-LERNAi) upon chronic enteric dysbiosis. The difference between these conditions is significant (p < 0.001; one-sided log rank test). (G) Representative pictures of control infected flies (a) and after PGRP-LE RNAi-mediated gene knock-down in principal cells (b) (scale bar, 0.5 mm). aʹ and bʹ, magnified fat bodies views of the boxed regions (scale bar, 0.15 mm). (HJ) Quantification of abdominal bloating (H), ovary degeneration (I) and ovarioles that contained apoptotic nurse cells (J) upon chronic infection in control flies and after PGRP-LE RNAi-mediated gene knock-down in principal cells. Comparisons between selected conditions are shown (Fisher’s exact test (H,I) and Mann Whitney test (J); ns, not significant, ***, p < 0.001).
Figure 4
Figure 4
Chronic activation of the IMD/NF-κB pathway in MTs interrupts insulin signaling and causes fluid accumulation and fat body wasting. (A) Quantitative RT-PCR analysis of the expression of the FoxO target gene 4EBP in Malpighian tubules of control and infected flies for 1, 10 and 20 days. Comparisons between selected conditions are shown (Fisher’s exact test; ns, not significant; **p < 0.01). Each condition was normalized to its own uninfected control to take into account age-specific changes in gene expression. (B) Quantitative RT-PCR analysis of the expression of 4EBP in Malpighian tubules of control and infected flies for 1, 10 and 20 days treated or not with RNAi against PGRP-LE in principal cells. Comparisons between selected conditions are shown (Fisher’s exact test; ns, not significant; **p < 0.01, *p < 0.1). (C) Survival of infected control flies (UAS-PI3KCAAX, TubGal80ts) and those overexpressing a constitutive active form of PI3K in Malpighian principal cells (C42gal4 > UAS-PI3KCAAX, TubGal80ts). The difference between control flies and flies overexpressing PI3KCAAX in MT principal cells is significant (***p < 0.001, respectively; one-sided log rank test). (D) Representative pictures of infected control flies (a) and those overexpressing PI3KCAAX under the control of the C42gal4 driver (b) (scale bar, 0.5 mm). aʹ and bʹ, magnified fat bodies views of the boxed regions (scale bar, 0.15 mm). (EG) Percentage of abdominal bloating (E), ovary degeneration (F) and ovarioles that contained apoptotic nurse cells (G) upon chronic infection of control flies and those overexpressing PI3KCAAX in MT principal cells. Comparisons between selected conditions are shown (Fisher’s exact test (E,F) and Mann Whitney (G) test; ns, not significant, **p < 0.01).
Figure 5
Figure 5
Activation of FoxO or inhibition of TOR signaling in MTs provokes fluid buildup and fat body wasting. (A) Survival of control flies (UAS-FoxO™, TubGal80ts) and flies expressing FoxO™ in Malpighian principal or stellate cells (C42gal4 > UAS-FoxO™, TubGal80ts and LKRGal4 > UAS-FoxO™, TubGal80ts, respectively). The difference between control flies and flies expressing FoxO™ is significant (p < 0.001 respectiveley; one-sided log rank test). (B) Representative pictures of control flies (a) and those expressing FoxO™ (b and c) (scale bar, 0.5 mm). aʹ–cʹ, magnified fat bodies views of the boxed regions (scale bar, 0.15 mm). (C) Average percent of abdominal bloating observed in flies expressing FoxO™. Comparisons between selected conditions are shown (Fisher’s exact test; ***p < 0.001). (D) Representative pictures of ovaries from control flies (a) and upon expression of FoxO™ (b and c) (scale bar, 0.5 mm). (E,F) Average percent of ovary atrophy (E) and ovarioles that contained apoptotic nurse cells (F) in control flies and those expressing FoxO™. Comparisons between selected conditions are shown (Fisher’s exact test (E) and Mann Whitney test (F); ns, not significant, ***p < 0.001). (G) Survival of control flies (UAS-TSC1/2, TubGal80ts) and flies overexpressing TSC1/2 in Malpighian principal or stellate cells (C42gal4 > UAS-TSC1/2, TubGal80ts and LKRGal4 > UAS-TSC1/2, TubGal80ts, respectively). The difference between control flies and flies overexpressing TSC1/2 is significant (p < 0.001 respectively; one-sided log rank test). (H) Representative pictures of control flies (a) and those overexpressing TSC1/2 (b and c) (scale bar, 0.5 mm). aʹ–cʹ, magnified fat bodies views of the boxed regions (scale bar, 0.15 mm). (I) Average percent of abdominal bloating observed in flies overexpressing TSC1/2. Comparisons between selected conditions are shown (Fisher’s exact test; ***p < 0.001). (J) Representative pictures of ovaries from control flies (a) and upon inhibition of the TOR signaling transduction cascade by overexpression of TSC1/2 (b and c) (scale bar, 0.5 mm). (K,L) Average percent of ovary atrophy (K) and ovarioles that contained apoptotic nurse cells (L) in control flies and flies overexpressing TSC1/2. Comparisons between selected conditions are shown (Fisher’s exact test, (K) and Mann Whitney test (L); ns, not significant).

Similar articles

Cited by

References

    1. Cani PD. Microbiota and metabolites in metabolic diseases. Nat. Rev. Endocrinol. 2019;15:69–70. - PubMed
    1. Tilg H, Zmora N, Adolph TE, Elinav E. The intestinal microbiota fuelling metabolic inflammation. Nat. Rev. Immunol. 2020;20:40–54. - PubMed
    1. Saklayen MG. The Global Epidemic of the Metabolic Syndrome. Curr Hypertens Rep. 2018;20:12. - PMC - PubMed
    1. Singh AK, Kari JA. Metabolic syndrome and chronic kidney disease. Curr. Opin. Nephrol. Hypertens. 2013;22:198–203. - PubMed
    1. Dabke K, Hendrick G, Devkota S. The gut microbiome and metabolic syndrome. J. Clin. Investig. 2019;129:4050–4057. - PMC - PubMed

Publication types

MeSH terms

Supplementary concepts

LinkOut - more resources