. 2020 Aug 24;10(1):14108.
doi: 10.1038/s41598-020-70671-1.

Acapsular Staphylococcus aureus with a non-functional agr regains capsule expression after passage through the bloodstream in a bacteremia mouse model

Affiliations

Acapsular Staphylococcus aureus with a non-functional agr regains capsule expression after passage through the bloodstream in a bacteremia mouse model

Carlos M Suligoy et al. Sci Rep. .

Abstract

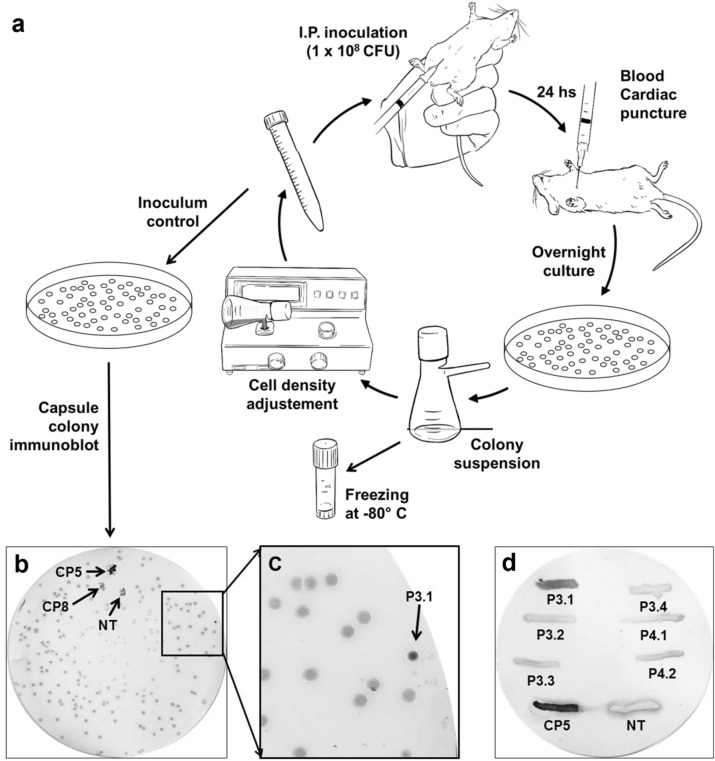
Selection pressures exerted on Staphylococcus aureus by host factors during infection may lead to the emergence of regulatory phenotypes better adapted to the infection site. Traits convenient for persistence may be fixed by mutation thus turning these mutants into microevolution endpoints. The feasibility that stable, non-encapsulated S. aureus mutants can regain expression of key virulence factors for survival in the bloodstream was investigated. S. aureus agr mutant HU-14 (IS256 insertion in agrC) from a patient with chronic osteomyelitis was passed through the bloodstream using a bacteriemia mouse model and derivative P3.1 was obtained. Although IS256 remained inserted in agrC, P3.1 regained production of capsular polysaccharide type 5 (CP5) and staphyloxanthin. Furthermore, P3.1 expressed higher levels of asp23/SigB when compared with parental strain HU-14. Strain P3.1 displayed decreased osteoclastogenesis capacity, thus indicating decreased adaptability to bone compared with strain HU-14 and exhibited a trend to be more virulent than parental strain HU-14. Strain P3.1 exhibited the loss of one IS256 copy, which was originally located in the HU-14 noncoding region between dnaG (DNA primase) and rpoD (sigA). This loss may be associated with the observed phenotype change but the mechanism remains unknown. In conclusion, S. aureus organisms that escape the infected bone may recover the expression of key virulence factors through a rapid microevolution pathway involving SigB regulation of key virulence factors.


Conflict of interest statement

The authors declare no competing interests.

Figures

Figure 1
Figure 1
(a) Mouse experiment flowchart. Mice were injected by the i.p. route with 1 × 108 CFU of S. aureus HU-14. After 24 h mice were sacrificed and blood obtained by cardiac puncture. Blood was plated quantitatively and after an overnight culture all colonies from a plate were harvested and suspended in PBS, and the suspension adjusted to a density of 1 × 109 per ml for further injection to another group of mice. Suspension aliquots were plated for CFU count and colony immunoblots were performed on the grown TSB plates to detect the emergence of any colony producing CP5. (b) Colony immunoblot of strain HU-14 after three passages through mice. The arrows indicate strains Reynolds CP5, Reynolds CP8 and Reynolds NT. These three control strains were added by impregnation of the blot membrane. (c) Magnification of the photograph shown in (b). The arrow indicate colony #1, later identified as P3.1. (d) P3.1 was confirmed as CP5. Positive control was strain Reynolds CP5 (lower left strike). Negative control was Reynolds NT (lower right strike).
Figure 2
Figure 2
(a) Quantitative real time PCR of RNAIII and agrA transcripts from strains HU-14 and derivative P3.1. S. aureus strain 6,850 was used as reference. Changes in gene expression are shown as normalized mean fold change 2-ΔCt. Data were normalized to 16S expression. The data represent the mean of duplicate measurements from 3 independent experiments. (b) Electrophoretic run of agrC PCR amplicons. HU-14 and P3.1 rendered amplicons of identical size, larger than that obtained from control strain HU-8 with a conserved agrC. Lane (-) contains no DNA. The original gel image is shown in Suppl. Figure 3. The result obtained shows that the IS256 insertion remains in place within agrC in derivative P.3.1.
Figure 3
Figure 3
(a) Strain HU-14 and P3.1 colonies on TSA showing the different pigmentation level. Panel b: pigments were extracted S. aureus strains with methanol and the optical density ratios at 450 nm/600 nm were measured. Sample size in each column varied from 4 to 18. The P3.1 methanolic extract produced a significantly higher absorbance when compared with the parental HU-14 strain. (*) p = 0.0121, Student t test for unpaired samples. S. aureus RN6911 does not produce staphyloxanthin and SH1000 is a heavy staphyloxanthin producer strain.
Figure 4
Figure 4
PIA in biofilms produced by S. aureus HU-14 and P3.1. Strains SA113 and MBD034 were included as positive standard and negative control, respectively. Each bar represents the arithmetic mean ± SEM from 4 to 6 wells from 3 separate experiments. PIA production values are the OD at 595 nm of crystal violet (ODB) relative to the final culture density (ODG) after 24 h incubation. There was no significant difference between HU-14 and P3.1 (ordinary one-way ANOVA, Tukey´s test, Brown-Forsythe post-test).
Figure 5
Figure 5
Quantitative real time PCR of asp23 and sigB transcripts from strains HU-14 and derivative P3.1. S. aureus strain 6850 was used as reference. Changes in gene expression are shown as normalized mean fold change 2-ΔCt. Data were normalized to 16S expression. The data represent the median of duplicate measurements from 3 independent experiments. (*) Significant difference with p = 0.0070 (Mann–Whitney test).
Figure 6
Figure 6
(a,b) RAW 264.7 cells were stimulated with the S. aureus HU-14 isolate or its derivative P3.1 (Heat-killed bacteria, 107 CFU/ml) for 48 h. Media alone was used as negative control. (a) Photographs at 20 × magnification. (b) The number of mature osteoclasts was quantified by light microscopy using TRAP staining. TRAP + cells with 3 or more nuclei were considered mature osteoclasts. The mean and standard error of cumulative data from 3 independent experiments (6 wells) is shown. Levels of significance were obtained by ordinary one-way ANOVA (Tukey´s multi comparisons test, Brown-Forsythe post-test). (c) TNF-α production was quantified by ELISA in the culture media. The mean and standard error of cumulative data from 3 independent experiments (6 wells) is shown. Levels of significance were obtained by ordinary one-way ANOVA (Tukey’s multi comparisons test, Brown-Forsythe post-test).

References

    1. Tong SYCC, Davis JS, Eichenberger E, Holland TL, Fowler VG. Staphylococcus aureus infections: epidemiology, pathophysiology, clinical manifestations, and management. Clin. Microbiol. Rev. 2015;28:603–661. - PMC - PubMed
    1. Goetghebeur M, Landry PA, Han D, Vicente C. Methicillin-resistant Staphylococcus aureus: A public health issue with economic consequences. Can. J. Infect. Dis. Med. Microbiol. 2007;18:27–34. - PMC - PubMed
    1. Prestinaci F, Pezzotti P, Pantosti A. Antimicrobial resistance: a global multifaceted phenomenon. Pathog. Glob. Health. 2015;109:309–318. - PMC - PubMed
    1. Howden BP, et al. Different bacterial gene expression patterns and attenuated host immune responses are associated with the evolution of low-level vancomycin resistance during persistent methicillin-resistant Staphylococcus aureus bacteraemia. BMC Microbiol. 2008;8:39. doi: 10.1186/1471-2180-8-39. - DOI - PMC - PubMed
    1. Kallen AJ, et al. Health care-associated invasive MRSA infections, 2005–2008. JAMA. 2010;304:641–648. - PubMed

Publication types

MeSH terms