. 2020 Aug 24;10(1):14089.
doi: 10.1038/s41598-020-71059-x.

Spatial organization of Clostridium difficile S-layer biogenesis

Affiliations

Spatial organization of Clostridium difficile S-layer biogenesis

Peter Oatley et al. Sci Rep. .

Abstract

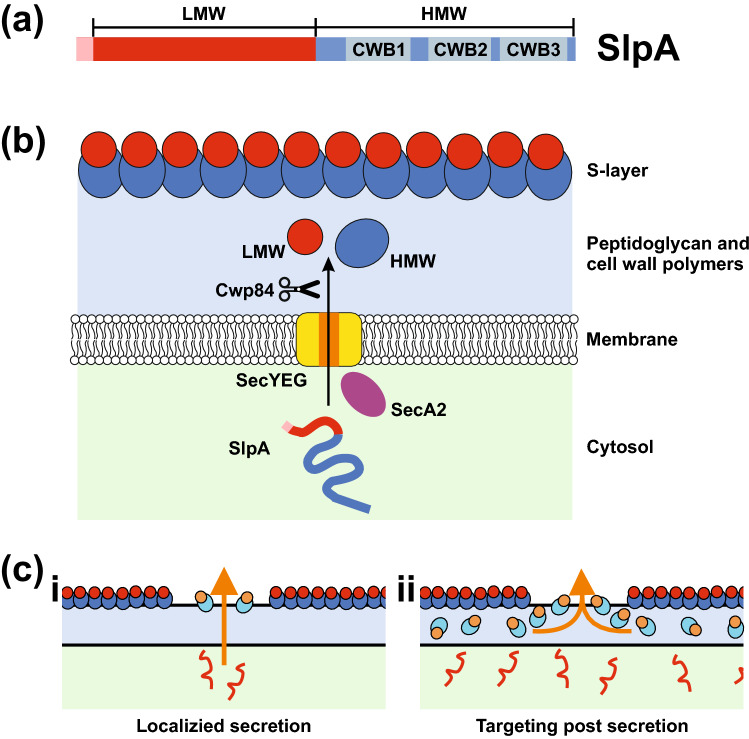
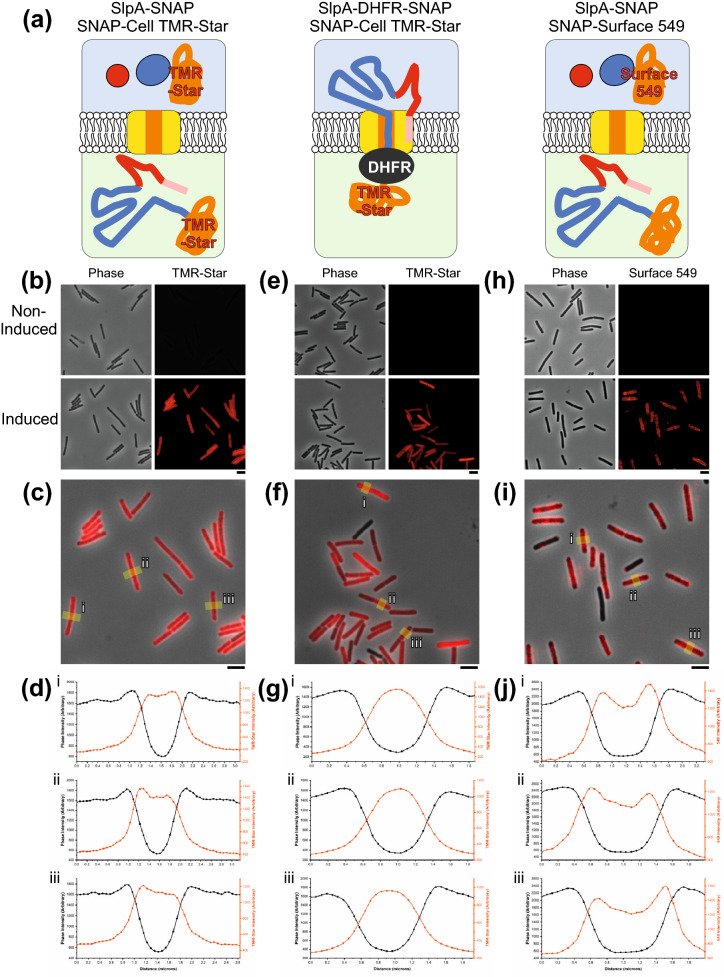
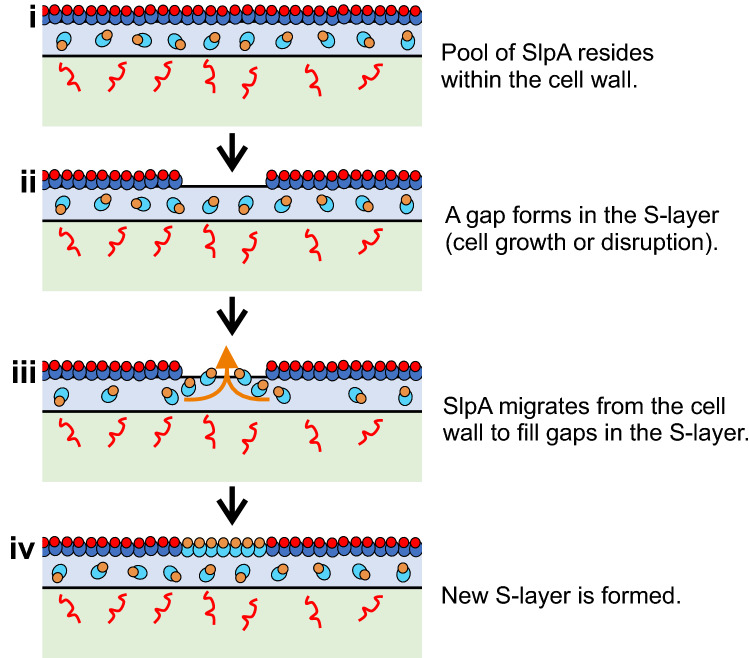
Surface layers (S-layers) are protective protein coats which form around all archaea and most bacterial cells. Clostridium difficile is a Gram-positive bacterium with an S-layer covering its peptidoglycan cell wall. The S-layer in C. difficile is constructed mainly of S-layer protein A (SlpA), which is a key virulence factor and an absolute requirement for disease. S-layer biogenesis is a complex multi-step process, disruption of which has severe consequences for the bacterium. We examined the subcellular localization of SlpA secretion and S-layer growth; observing formation of S-layer at specific sites that coincide with cell wall synthesis, while the secretion of SlpA from the cell is relatively delocalized. We conclude that this delocalized secretion of SlpA leads to a pool of precursor in the cell wall which is available to repair openings in the S-layer formed during cell growth or following damage.


Conflict of interest statement

The authors declare no competing interests.

Figures

Figure 1
Figure 1
The C. difficile S-layer and the SlpA secretory pathway. (a) Domain structure of SlpA precursor protein with signal sequence (Pink), low molecular weight region (LMW, Red) and high molecular weight region (HMW, Blue) that contains three cell wall binding domains (CWB, 1–3 in Grey). (b) Schematic diagram of SlpA secretion and processing in C. difficile. SlpA (Pink/Red/blue line) is translated in the cytosol (light green) and targeted for secretion across the membrane using SecA2 (Purple oval) most likely via the SecYEG Channel (Yellow/Orange). Cwp84 (Scissors) cleaves SlpA into low molecular weight (LMW, Red spheres) and high molecular weight (HMW, Blue spheres) S-layer protein (SLP) subunits. The HMW and LMW SLPs assemble to form hetero-dimers that incorporate into the S-layer. The surface of the S-layer consists largely of exposed LMW-SLP anchored to the cell wall (light blue) via cell wall biding domains of the HMW-SLP component (see (a)). (c) Models of SlpA integration into the S-layer. (i) unfolded SlpA (red line) is secreted from specific points on the cell membrane—directed by gaps in the S-layer or cell wall (colored as in (b)), newly processed SlpA (LMW-SLP orange circles, HMW-SLP light blue ovals) is transported directly through the cell wall for integration into the S-layer. Alternatively; (ii) SlpA is translocated across the cell membrane at multiple sites. A pool of SlpA lays within the cell wall ready to fill gaps in the S-layer.
Figure 2
Figure 2
New surface S-layer colocalizes with areas of new peptidoglycan synthesis. (a) Examples of timepoints from real-time widefield fluorescent HADA signal (left panels) and phase contrast (center panels) of C. difficile 630 cells chased for HADA stain. Frame time represented in minutes, scale bar indicates 6 µm. (b) Airyscan confocal image of a C. difficile 630 cell grown with HADA to label peptidoglycan (Blue) and chased to reveal darker areas of newly synthesized peptidoglycan in the cell wall. This chase was followed by a short expression of SlpAR20291 which was specifically immunolabeled with Cy5 (White). After merging HADA and Cy5 channels (righthand panels, duplicated for clarity), cell sides (yellow bars) were selected for signal intensity analysis. For this example cell the intensity plots for cell sides (i) and (ii) are shown in panel C. Scale bar indicates 6 µm. (c) Intensity plot depicting signal from HADA (Blue) and Cy5 (Grey) along the yellow bars illustrated in (b). Trace (i) was calculated to have a significant positive correlation and (ii) a significant negative correlation.
Figure 3
Figure 3
S-layer formation during cell division. Airyscan confocal images of C. difficile 630 cells during and immediately after cell division with HADA labelled peptidoglycan cell wall (blue) and new surface SlpAR20291 immunolabeled with Cy5 (white). Large, dark areas lacking HADA staining mark peptidoglycan synthesis at the septum between cells or a newly produced cell pole. Scale bar indicates 3 µm. On the right-hand side of each row is a schematic diagram illustrating the position of new surface SlpAR20291 (HMW-SLP, spotted light blue and LMW-SLP, spotted orange) as detected in the corresponding microscopy images against the position of endogenous surface SlpA630 (HMW-SLP, dark blue and LMW-SLP, red). The position of newly synthesized cell wall is displayed in brown/white stripes.
Figure 4
Figure 4
SecA2-SNAP localization and new S-layer. (a) Widefield phase contrast (left panels) and fluorescent (right panels) images of wild type C. difficile 630 or 630 secA2-snap cells stained with TMR-Star (red). Scale bar indicates 3 µm. (b) Airyscan confocal image displaying SecA2-SNAP-TMR-Star signal distribution in C. difficile 630 cells. Scale bar indicates 3 µm. (c) Airyscan confocal image showing the localization of SecA2-SNAP-TMR-Star (red) in relation to the synthesis of peptidoglycan (dark patches lacking blue HADA stain) and newly synthesized S-layer (Cy5, white). Scale bar indicates 3 µm. (d) Graph displaying the proportion of cell area with internal SecA2-SNAP-TMR-star signal or outline with R20291-LMW-SLP-Cy5 signal. Mean and SD of results from n = 47 cells is shown. One-way ANOVA analysis identified a significant difference in mean values *p < 0.0001.
Figure 5
Figure 5
Sites of S-layer secretion. (a) Schematic diagram illustrating the position of stained SNAP tagged SlpA constructs expressed in C. difficile 630 cells: SNAP-Cell TMR-Star stained SlpA-SNAP (left panel) or SlpA-DHFR-SNAP (center panel) and SNAP-Surface 549 stained SlpA-SNAP (right panel). Colored as in Fig. 1b with SNAP tags represented as an orange coil. SlpA-SNAP is exported and cleaved into LMW-SLP and HMW-SLP-SNAP. The DHFR domain (dark gray oval) of SlpA-DHFR-SNAP blocks the translocon channel during export, leaving the TMR-Star bound SNAP tag in the cytosol. SNAP-Surface 549 stains extracellular HMW-SLP-SNAP only. (b) Widefield phase contrast (left panels) and fluorescent SNAP-Cell TMR-Star signal (right panels) of C. difficile 630 cells stained with SNAP-Cell TMR-Star imaged with and without induction of SlpA-SNAP expression. Scale bar indicates 3 µm. (c) Overlay of fluorescent signal in the induced sample (from (b)) with areas taken for the plot profiles labelled (yellow lines, i–iii). Scale bar indicates 3 µm. (d) SlpA-SNAP-Cell TMR-Star profile plots of i-iii (from (c)) of phase contrast signal (black) and SNAP-Cell TMR-Star signal (red). (e) SlpA-DHFR-SNAP in C. difficile 630 cells (labelled as in (b)). (f) Overlay of signal in the induced sample (from (e), labelled as in (c)). (g) SlpA-DHFR-SNAP-Cell TMR-Star profile plots of i–iii (from (f)) (labelled as in (d)). (h): Widefield phase contrast (left panels) and fluorescent SNAP-Surface 549 signal (right panels) of C. difficile 630 cells stained with SNAP-Surface 549 imaged with and without induction of SlpA-SNAP expression. (i) Overlay of signal in the induced sample (from (h), labelled as in (c)). (j) HMW-SLP-SNAP-Surface 549 profile plots of i-iii (from (i)) of phase contrast signal (black) and SNAP-Surface 549 (red).
Figure 6
Figure 6
Model of S-layer in the cell envelope. Schematic flow diagram of SlpA secretion and S-layer formation (colored as in Fig. 1c). During normal cell growth SlpA is targeted by SecA2 for secretion all over the cytosolic membrane. A store of SlpA resides within the cell wall where it is processed ready for integration into the S-layer (i). Gaps may form in the S-layer due to cell growth or injury (ii). SlpA in the cell wall diffuses out (iii) and fills openings in the S-layer (iv).

References

    1. Hull MW, Beck PL. Clostridium difficile-associated colitis. Can. Fam. Physician. 2004;50(1536–1540):1535–1543. - PMC - PubMed
    1. Napolitano LM, Edmiston CE., Jr Clostridium difficile disease: diagnosis, pathogenesis, and treatment update. Surgery. 2017;162:325–348. doi: 10.1016/j.surg.2017.01.018. - DOI - PubMed
    1. Kirk JA, et al. New class of precision antimicrobials redefines role of Clostridium difficile S-layer in virulence and viability. Sci. Transl. Med. 2017 doi: 10.1126/scitranslmed.aah6813. - DOI - PMC - PubMed
    1. Fagan RP, Fairweather NF. Biogenesis and functions of bacterial S-layers. Nat. Rev. Microbiol. 2014;12:211–222. doi: 10.1038/nrmicro3213. - DOI - PubMed
    1. Kirby JM, et al. Cwp84, a surface-associated cysteine protease, plays a role in the maturation of the surface layer of Clostridium difficile. J. Biol. Chem. 2009;284:34666–34673. doi: 10.1074/jbc.M109.051177. - DOI - PMC - PubMed

Publication types

MeSH terms