. 2020 Dec;5(12):1504-1515.
doi: 10.1038/s41564-020-0779-9. Epub 2020 Aug 24.

Large freshwater phages with the potential to augment aerobic methane oxidation

Affiliations

Large freshwater phages with the potential to augment aerobic methane oxidation

Lin-Xing Chen et al. Nat Microbiol. 2020 Dec.

Abstract

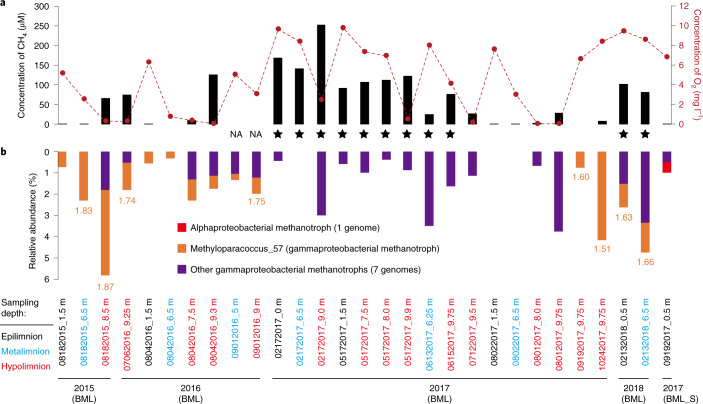
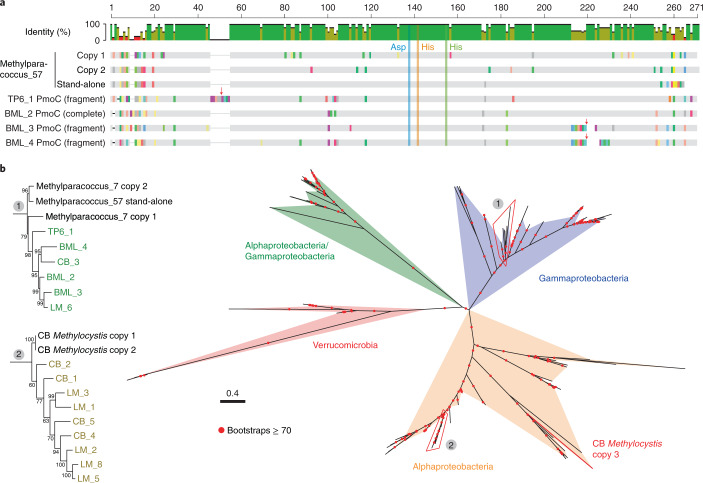
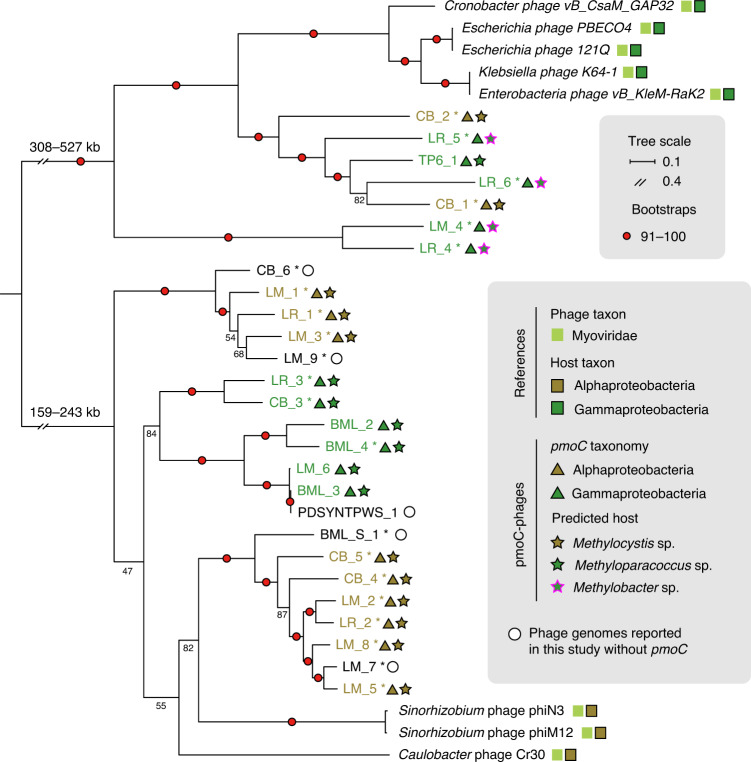
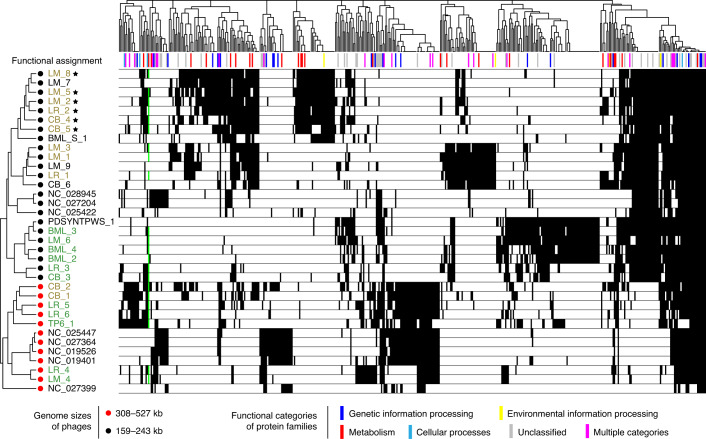
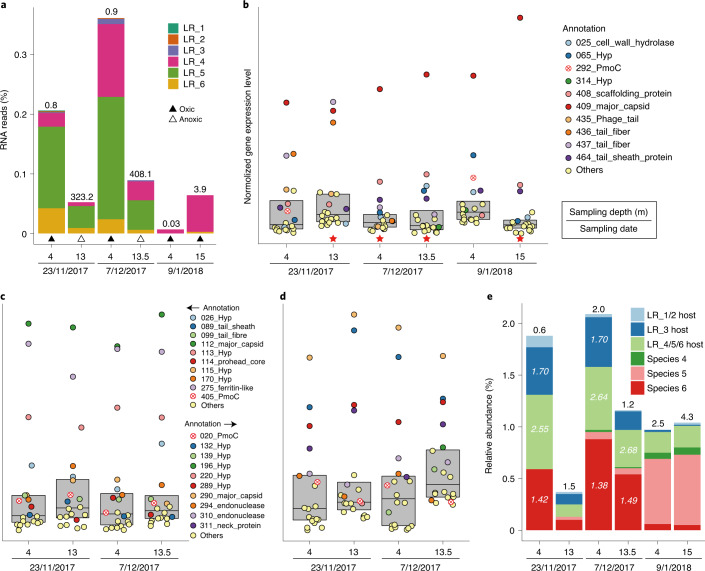
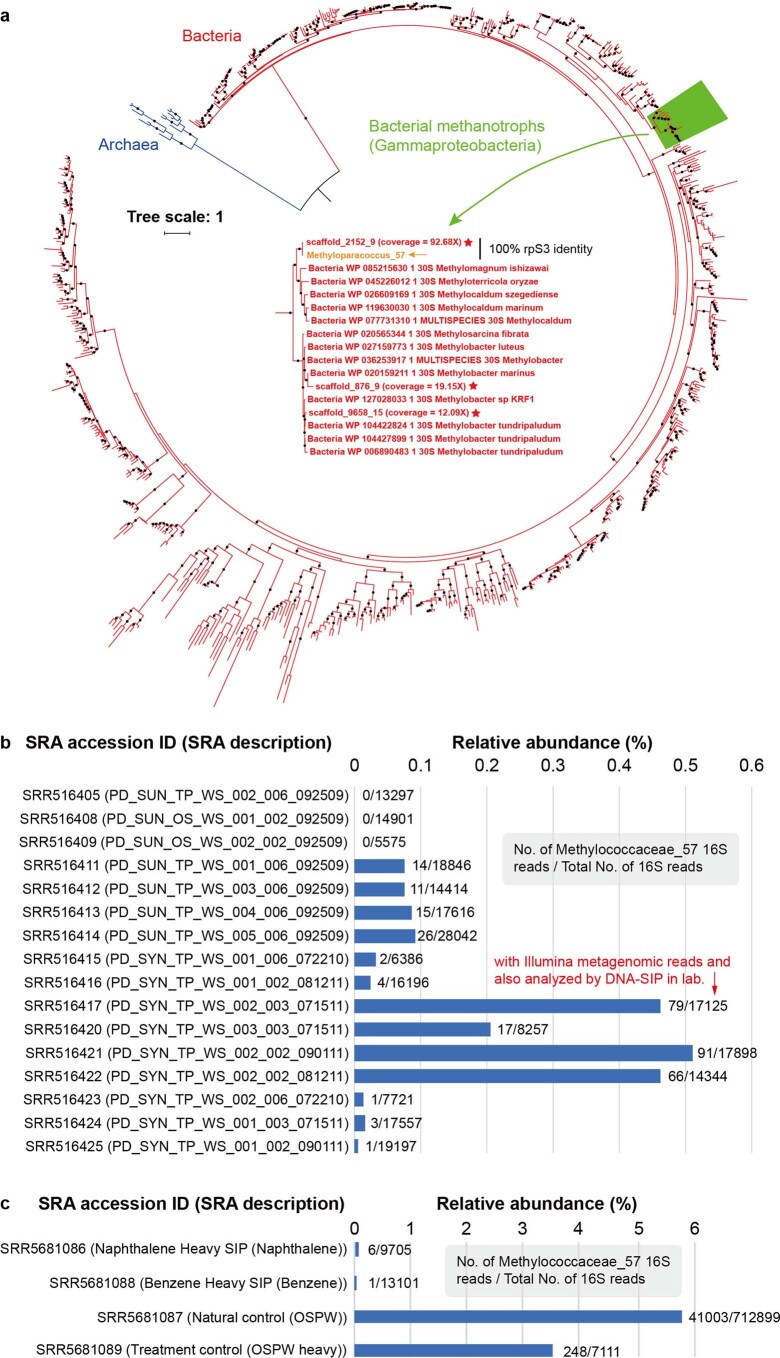
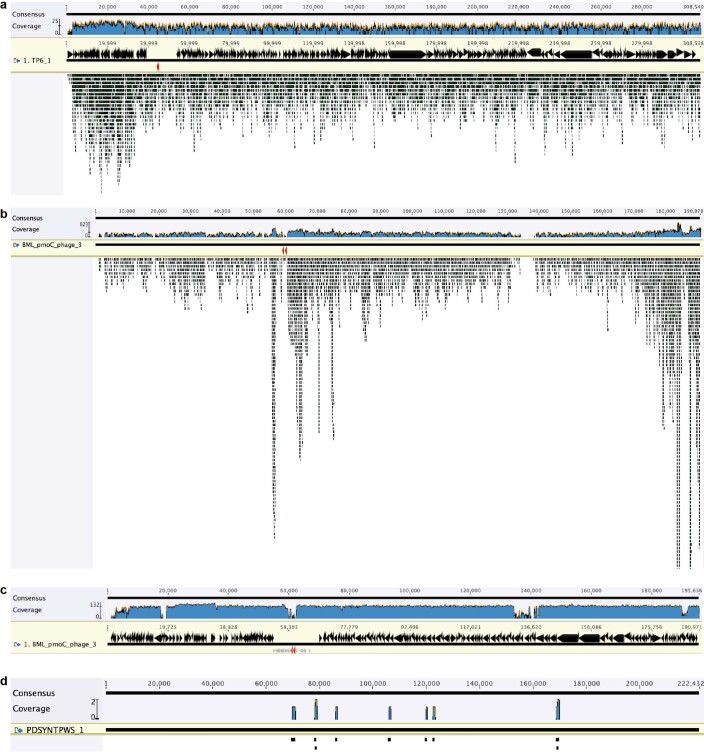
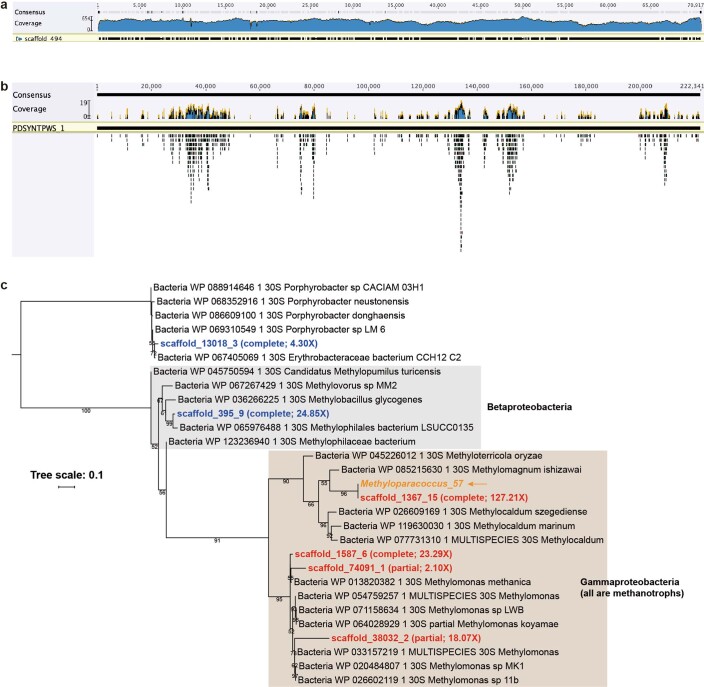
There is growing evidence that phages with unusually large genomes are common across various microbiomes, but little is known about their genetic inventories or potential ecosystem impacts. In the present study, we reconstructed large phage genomes from freshwater lakes known to contain bacteria that oxidize methane. Of manually curated genomes, 22 (18 are complete), ranging from 159 kilobase (kb) to 527 kb in length, were found to encode the pmoC gene, an enzymatically critical subunit of the particulate methane monooxygenase, the predominant methane oxidation catalyst in nature. The phage-associated PmoC sequences show high similarity to (>90%), and affiliate phylogenetically with, those of coexisting bacterial methanotrophs, including members of Methyloparacoccus, Methylocystis and Methylobacter spp. In addition, pmoC-phage abundance patterns correlate with those of the coexisting bacterial methanotrophs, supporting host-phage relationships. Future work is needed to determine whether phage-associated PmoC has similar functions to additional copies of PmoC encoded in bacterial genomes, thus contributing to growth on methane. Transcriptomics data from Lake Rotsee (Switzerland) showed that some phage-associated pmoC genes were highly expressed in situ and, of interest, that the most rapidly growing methanotroph was infected by three pmoC-phages. Thus, augmentation of bacterial methane oxidation by pmoC-phages during infection could modulate the efflux of this potent greenhouse gas into the environment.


Conflict of interest statement

The authors declare no competing interests.

Figures

Fig. 1
Fig. 1. Geochemical and biological evidence for methane oxidation in BML and BML_S samples.
a, The methane and oxygen concentrations at different depths at each sampling time point. Samples in which methanotrophs are inferred to be less active or inactive are indicated by stars. NA, not available. b, The relative abundances of methanotrophs. The iRep values (orange font) indicative of the growth rates of Methyloparacoccus_57 are shown; values for other methanotrophs are provided in Supplementary Fig. 2.
Fig. 2
Fig. 2. Bacterial and phage-associated PmoC.
a, Alignment of some bacterial and phage-associated PmoC sequences. The three residues in PmoC for copper ion coordination are highlighted. The pmoC genes of TP6_1, BML_3 and BML_4 are fragmented (red arrows) and both pieces are shown (see Supplementary Fig. 10 for full alignment). b, Phylogenetic analysis of bacterial and phage-associated PmoC. The coloured regions show the clades of published and currently reported bacterial sequences. The phylogenies of phage-associated PmoC are shown in detail. The CB Methylocystis sp. has a stand-alone copy of pmoC (CB Methylocystis copy 3).
Fig. 3
Fig. 3. Phylogeny and predicted host of pmoC-phages.
The complete phage genomes reported here are indicated by asterisks. The genome size ranges of the two groups of phages are shown. The taxonomy of phages and their hosts are indicated by coloured squares, triangles or stars. The bootstrap values are indicated by red circles when ≥91 or shown as numbers. See Supplementary Fig. 19 for phylogeny based on DNA polymerase sequences.
Fig. 4
Fig. 4. Metabolism of pmoC-phages and their relatives.
Clustering of phages based on the presence/absence profiles of protein families that are encoded by at least five phages. The phage-associated PmoC is highlighted by a green bar. The names of pmoC-phages infecting alpha- and gammaproteobacterial methanotrophs are shown in grey and green, respectively. The pmoC-phages with pmoC and HSP20 genes next to each other are indicated by stars (see Supplementary Table 7 for details).
Fig. 5
Fig. 5. Transcriptional analyses of pmoC-phages and information about bacterial methanotrophs in Lake Rotsee.
a, The percentage of RNA reads mapped to the pmoC-phages. The concentration of methane (in µM) is shown above the bar. bd, The 20 most highly expressed genes of LR_4 (b), LR_5 (c) and LR_6 (d). Only the functional predictions for the top 10 genes are listed. When pmoC genes are within the top 20 most highly expressed genes, they are indicated by circles containing a red x. Red stars indicate that the pmoC gene was expressed, but not one of the 20 most highly expressed genes. Box plots enclose the first to third quartiles of data values, with a black line at the median value. e, The relative abundances of methanotrophs in each of the six samples. The total cell count (× 105 cells ml−1) of the methanotrophs in each sample is shown above the bar. The iRep values indicating growth rates are shown for the methanotrophs when a given genome has ≥5× coverage in the corresponding sample. Hyp, hypothetical protein. Source data
Extended Data Fig. 1
Extended Data Fig. 1. The detection of Methyloparacoccus_57 in published oil sands datasets.
(a) The detection of Methyloparacoccus_57 in sample PDSYNTPWS (Ref. ) based on ribosomal protein S3 (rpS3). The phylogeny of the methanotrophs is zoomed-in in the middle. Sequences from PDSYNTPWS are indicated by red stars. Sequencing coverages of the corresponding scaffolds are shown in the brackets, the rpS3 of Methyloparacoccus_57 (from BML) is included for reference. A black solid circles indicate bootstrap values ≥ 70. (b)The information of Methyloparacoccus_57 related 16S rRNA gene sequences detected in the datasets reported in Ref. . (c) The information of Methyloparacoccus_57 related 16S rRNA gene sequences detected in the datasets reported in Ref. .
Extended Data Fig. 2
Extended Data Fig. 2. The detection of pmoC-phage related sequences in published oil sands datasets.
The mapping of reads from TP_MLSB (Ref. ) to pmoC-phage genomes of (a) TP6_1 and (b) BML_3. (c) The mapping of reads from PDSYNTPWS (Ref. ) to BML_3 indicates the existence of related phages in the sample. The pmoC genes are shown in red. (d) The alignment of 454 pyrosequencing reads from PDSYNTPWS (Ref. ) to phage genome of PDSYNTPWS_1. The 454 reads were reported in Ref. , and the phage genome of PDSYNTPWS_1 was reconstructed from Ref. . The small number of reads aligned was likely due to the low sequencing coverage of 454 pyrosequencing, and/or the low abundance of related phage in the sample, or genetic divergences. The mapping was performed by Bowtie2 (Ref. ) and filtered allowing ≤ 2 mismatches per read (that is, ≥ 98% nucleotide sequence similarity).
Extended Data Fig. 3
Extended Data Fig. 3. The reanalysis of published DNA-SIP metagenomic dataset from oil sands sample in Canada.
(a) Reads from the heavy DNA-SIP fraction of PDSYNTPWS mapped to the longest scaffold of Methyloparacoccus_57 (scaffold_494; 70,351 bp). The mapping was performed by Bowtie 2 and filtered to allow ≥ 98 nucleotide identity. (b) Reads from the heavy DNA-SIP fraction of PDSYNTPWS were mapped to PDSYNTPWS_1. The mapping was filtered to allow ≥ 98 nucleotide identity. The uneven depth may be due to the multiple displacement amplification used in sequencing sample preparation (see Ref. for details). (c) Phylogenetic analyses showing the active members in the community that revealed by DNA-SIP analyses. The phylogeny was performed based on the rpS3 protein sequences, rpS3 of Methyloparacoccus_57 (indicated by an arrow) was included for reference. The sequencing coverages of the corresponding scaffolds are shown in the brackets. The methanotrophs are indicated in red, and non-methanotrophs in blue.

References

    1. Salmond GPC, Fineran PC. A century of the phage: past, present and future. Nat. Rev. Microbiol. 2015;13:777–786. - PubMed
    1. Al-Shayeb B, et al. Clades of huge phage from across Earth’s ecosystems. Nature. 2020;578:425–431. - PMC - PubMed
    1. Mann NH, Cook A, Millard A, Bailey S, Clokie M. Bacterial photosynthesis genes in a virus. Nature. 2003;424:741–741. - PubMed
    1. Sharon I, et al. Photosystem I gene cassettes are present in marine virus genomes. Nature. 2009;461:258–262. - PMC - PubMed
    1. Anantharaman K, et al. Sulfur oxidation genes in diverse deep-sea viruses. Science. 2014;344:757–760. - PubMed

Publication types