. 2020 Sep;22(9):1064-1075.
doi: 10.1038/s41556-020-0562-4. Epub 2020 Aug 24.

Acetylation-dependent regulation of PD-L1 nuclear translocation dictates the efficacy of anti-PD-1 immunotherapy

Affiliations

Acetylation-dependent regulation of PD-L1 nuclear translocation dictates the efficacy of anti-PD-1 immunotherapy

Yang Gao et al. Nat Cell Biol. 2020 Sep.

Abstract

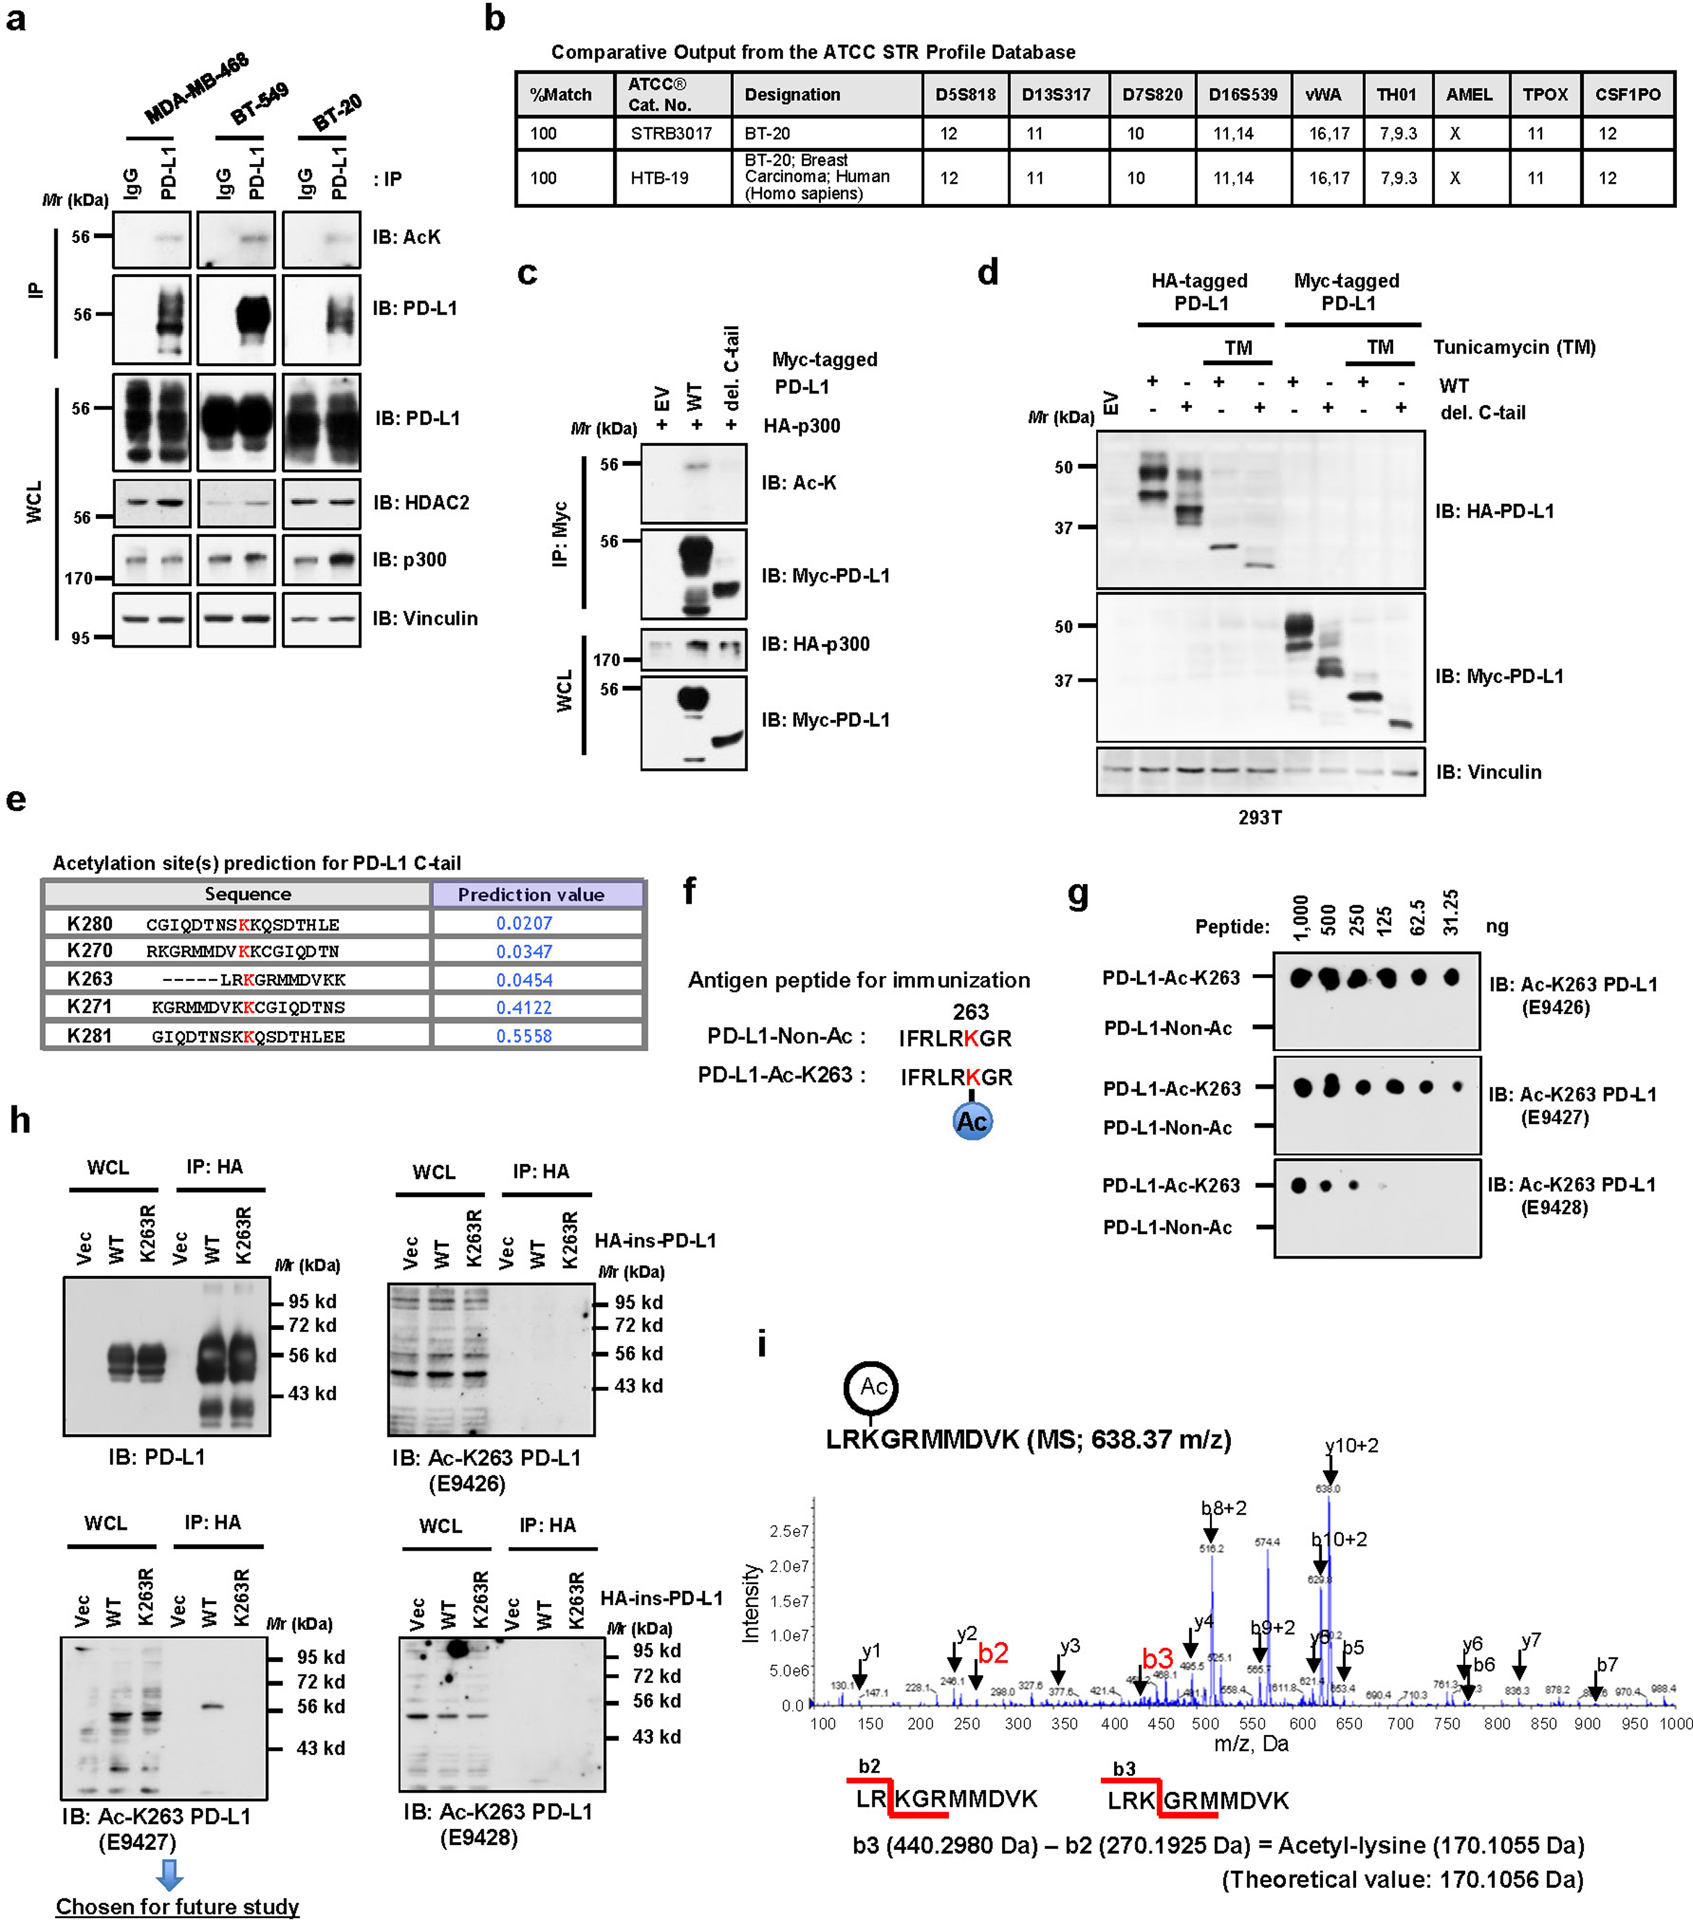
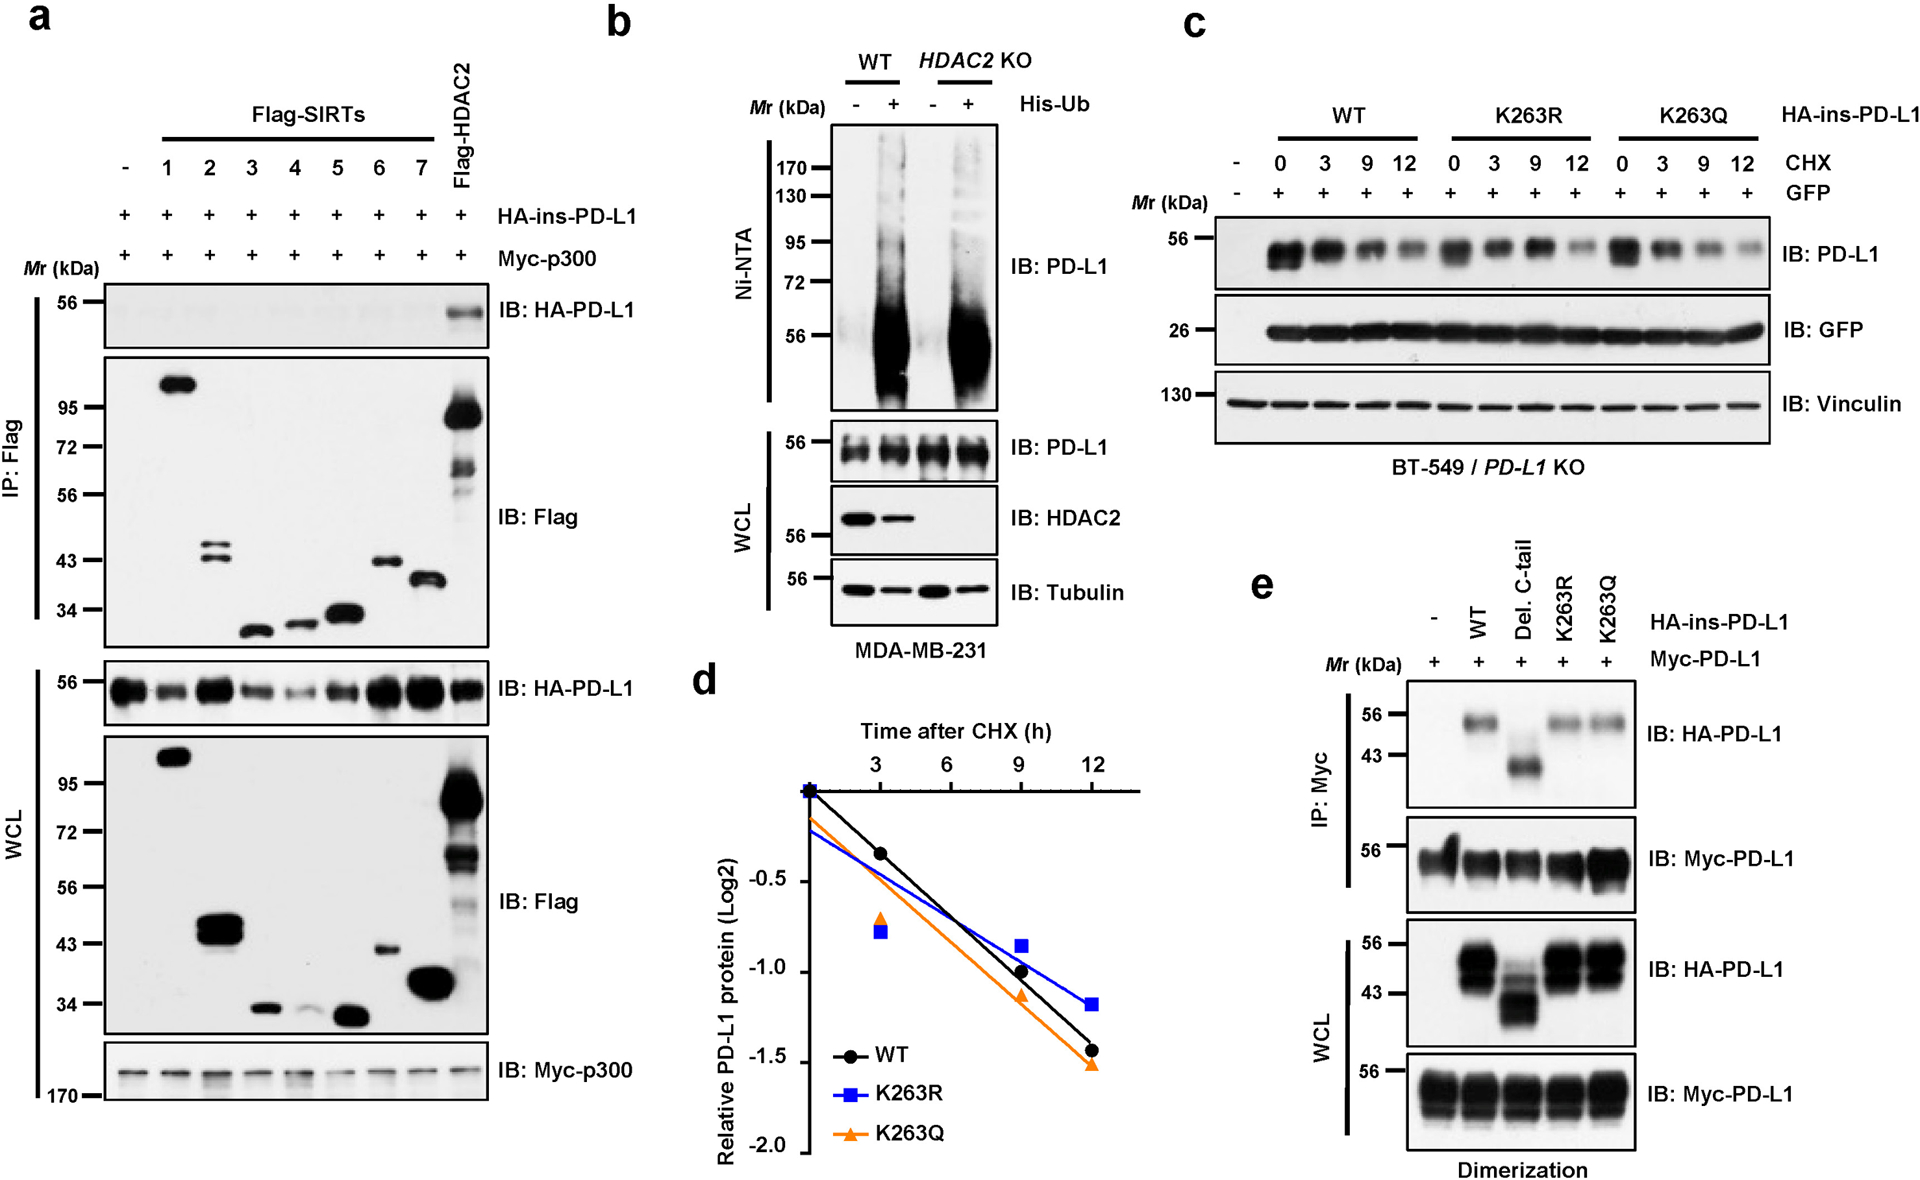
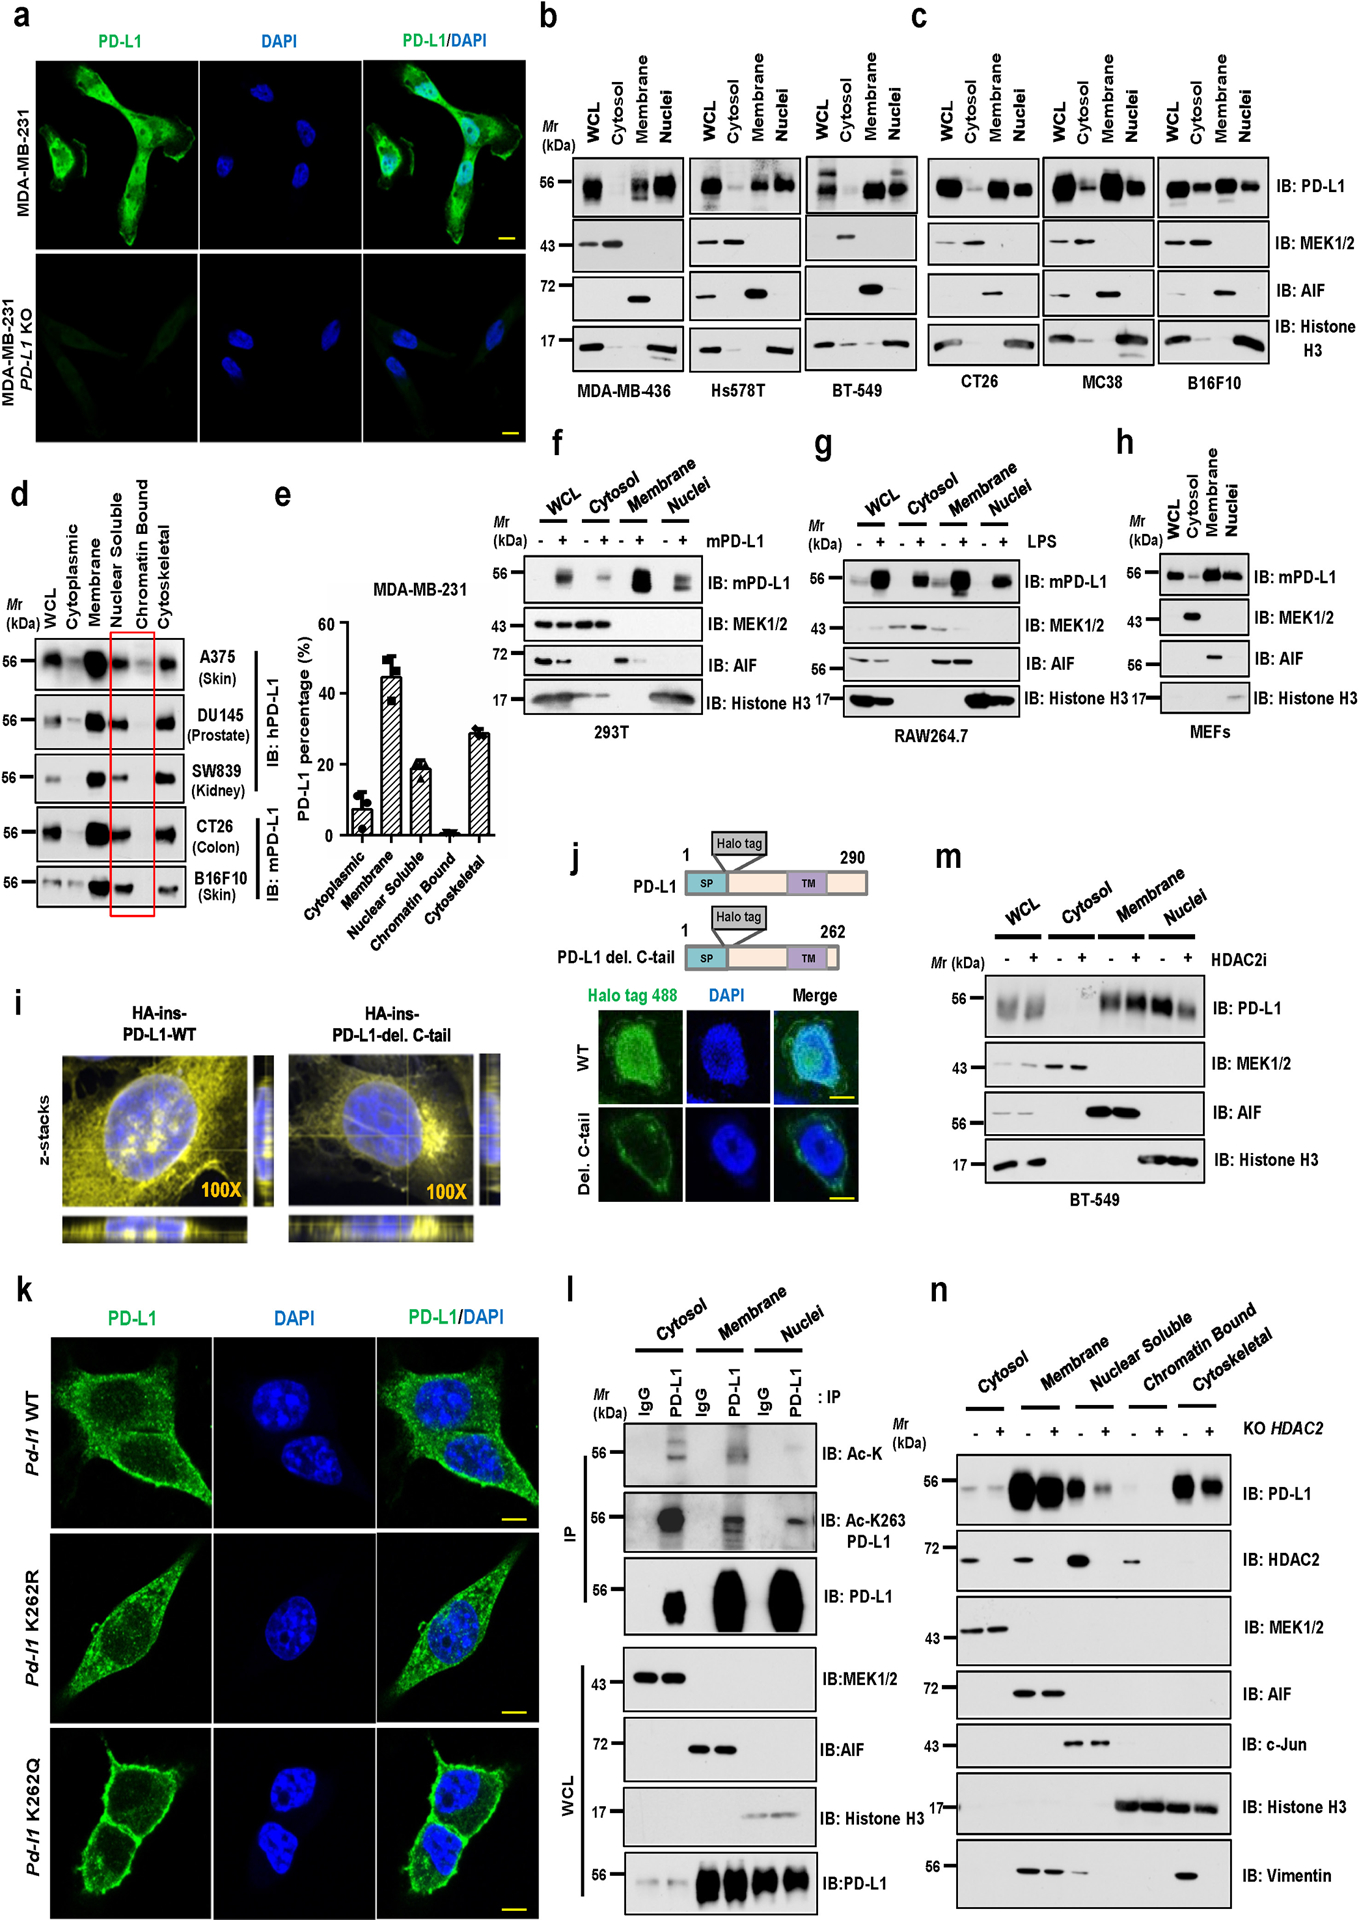
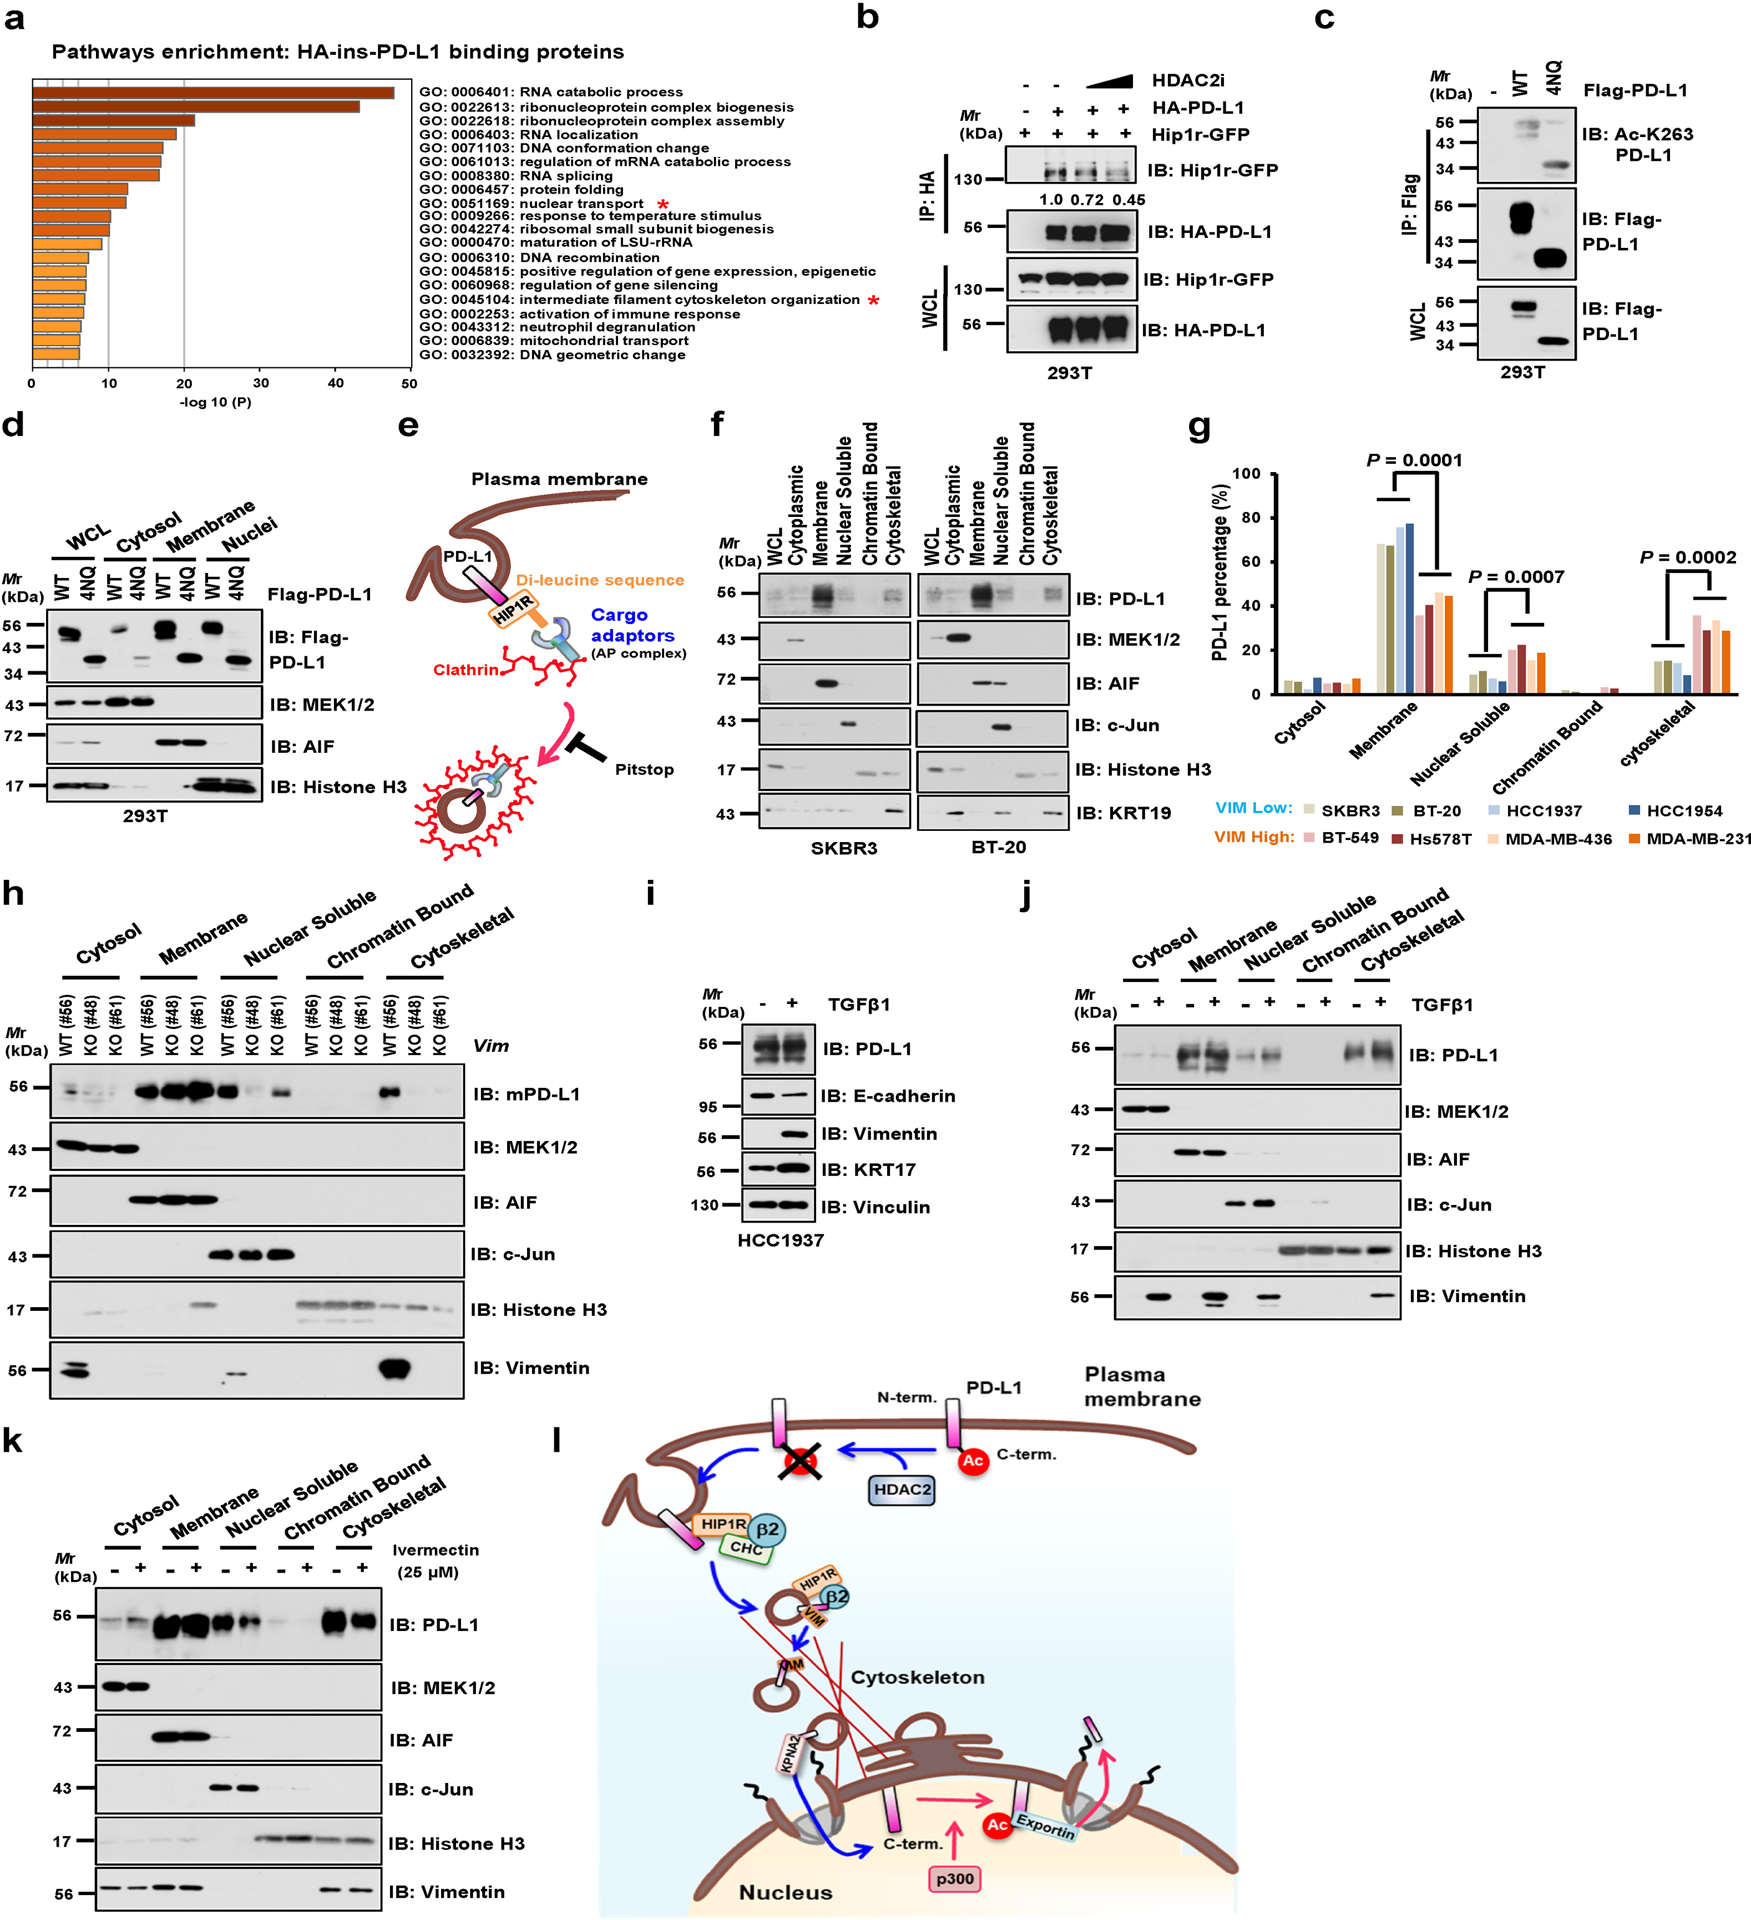
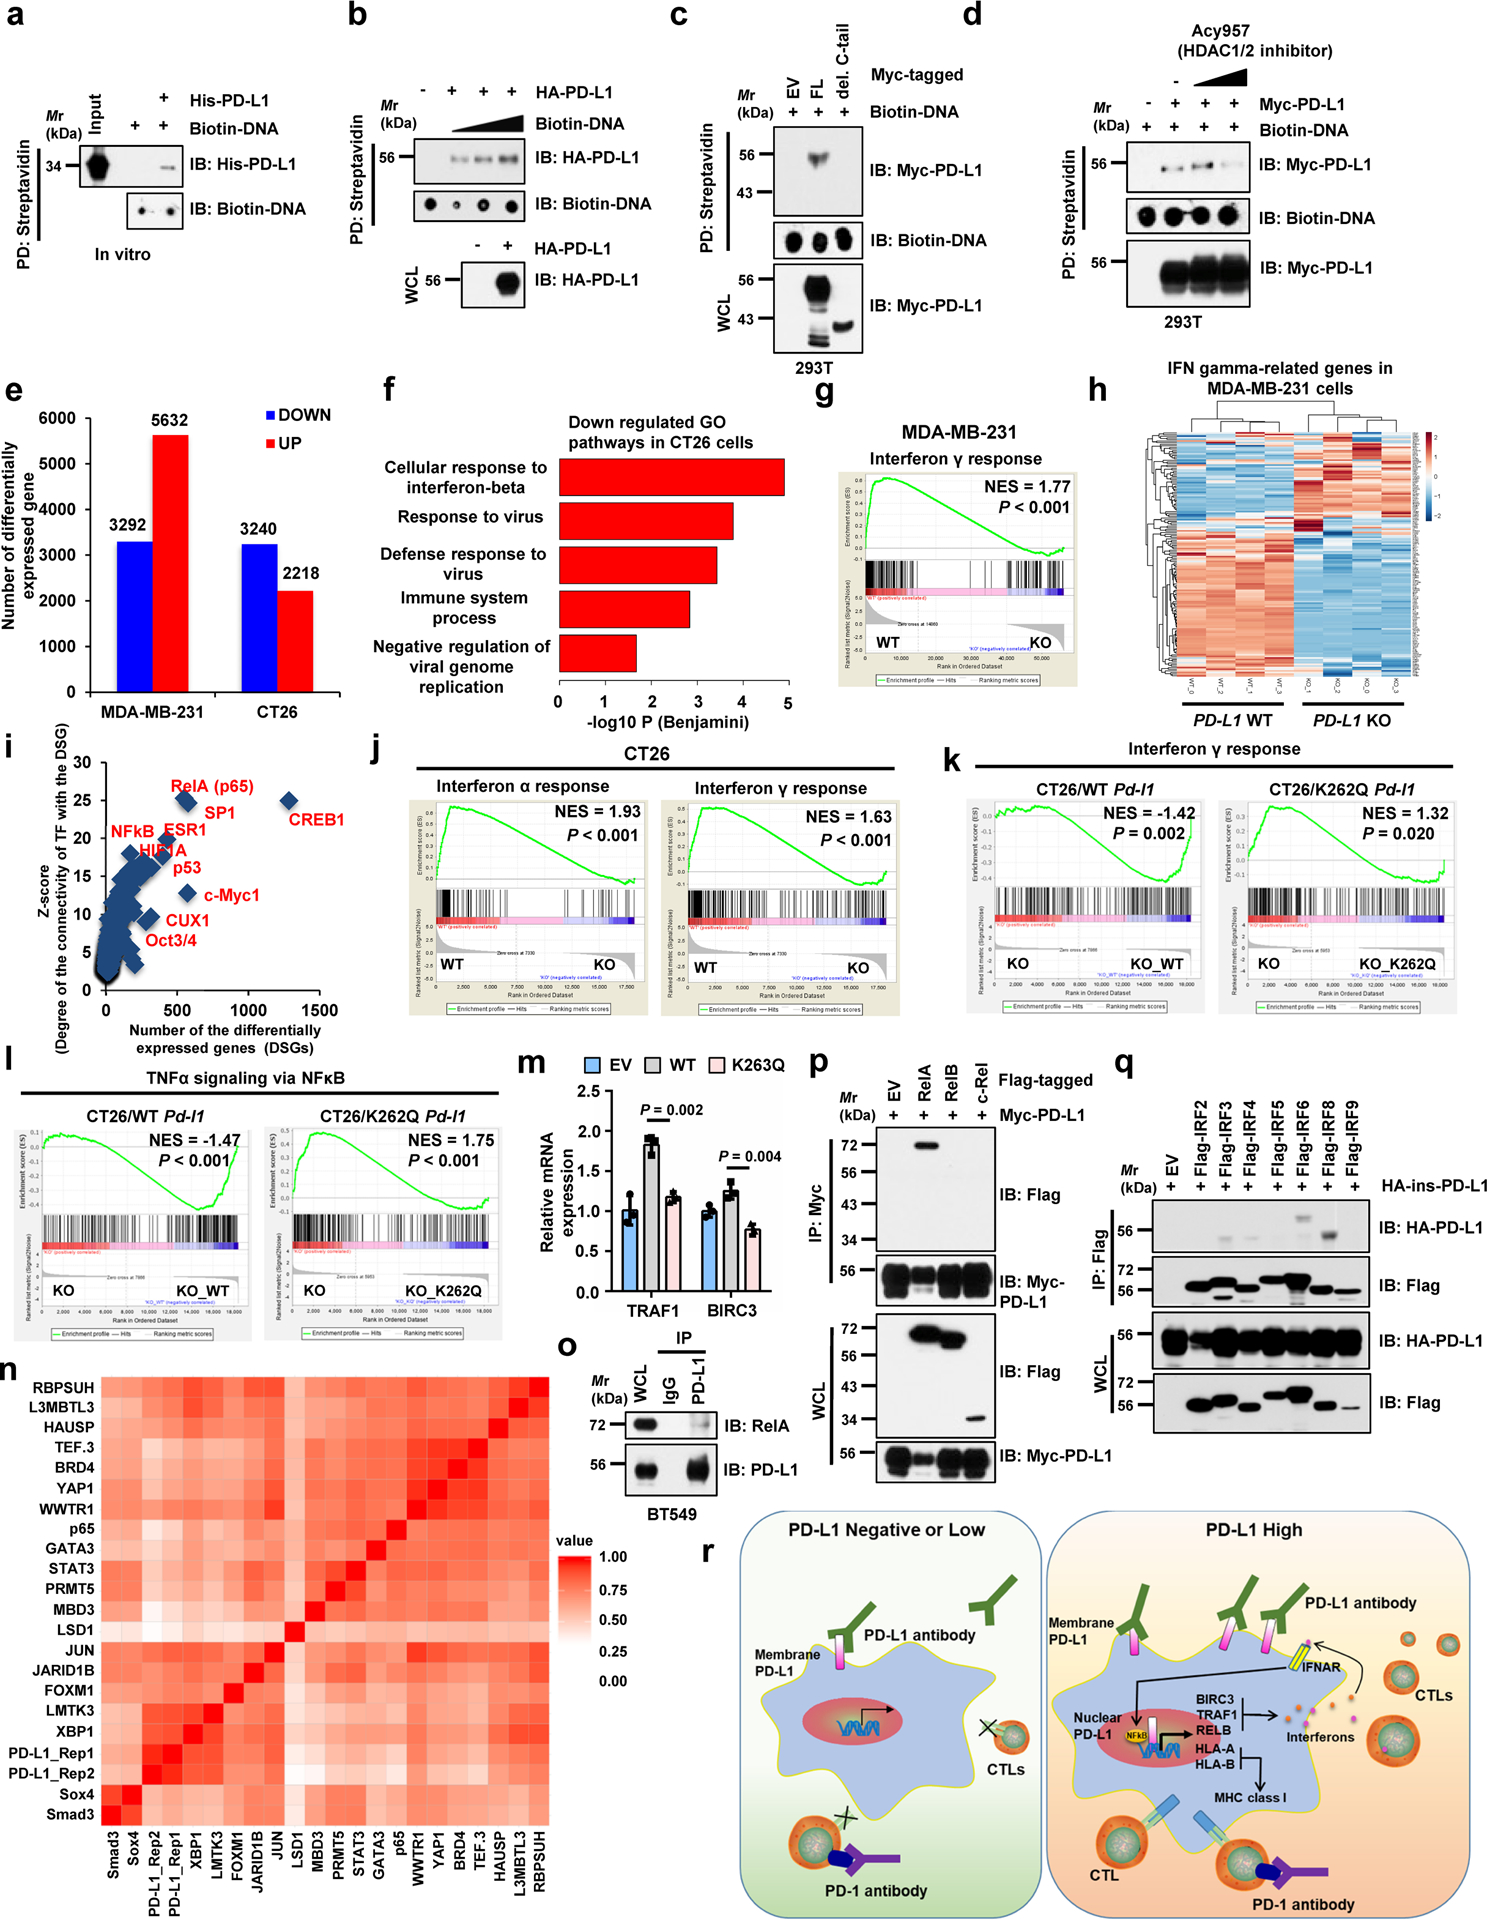
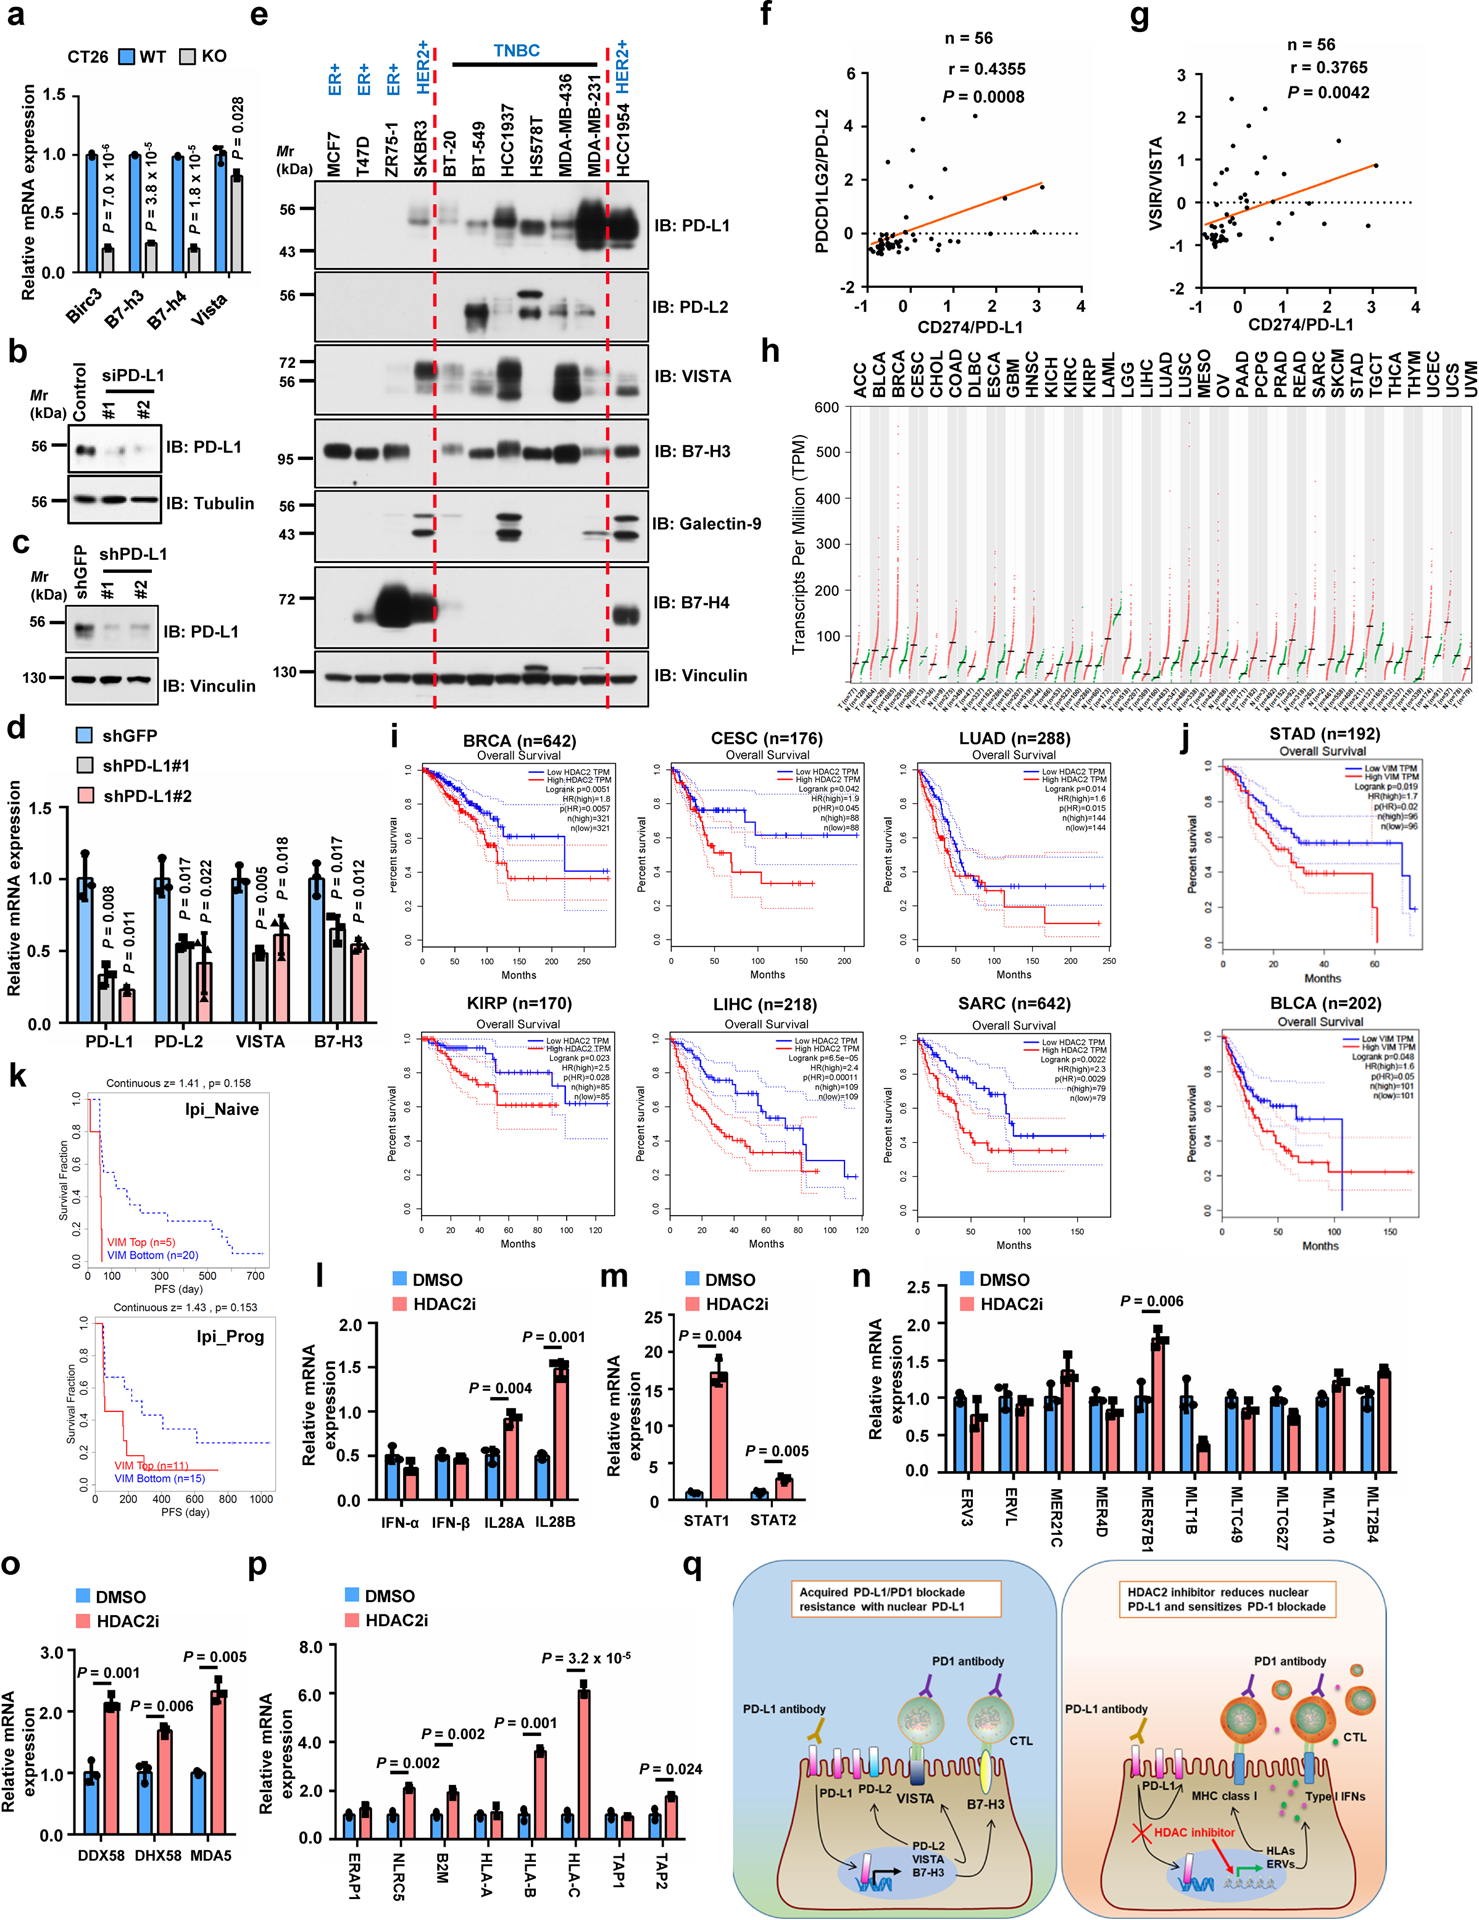
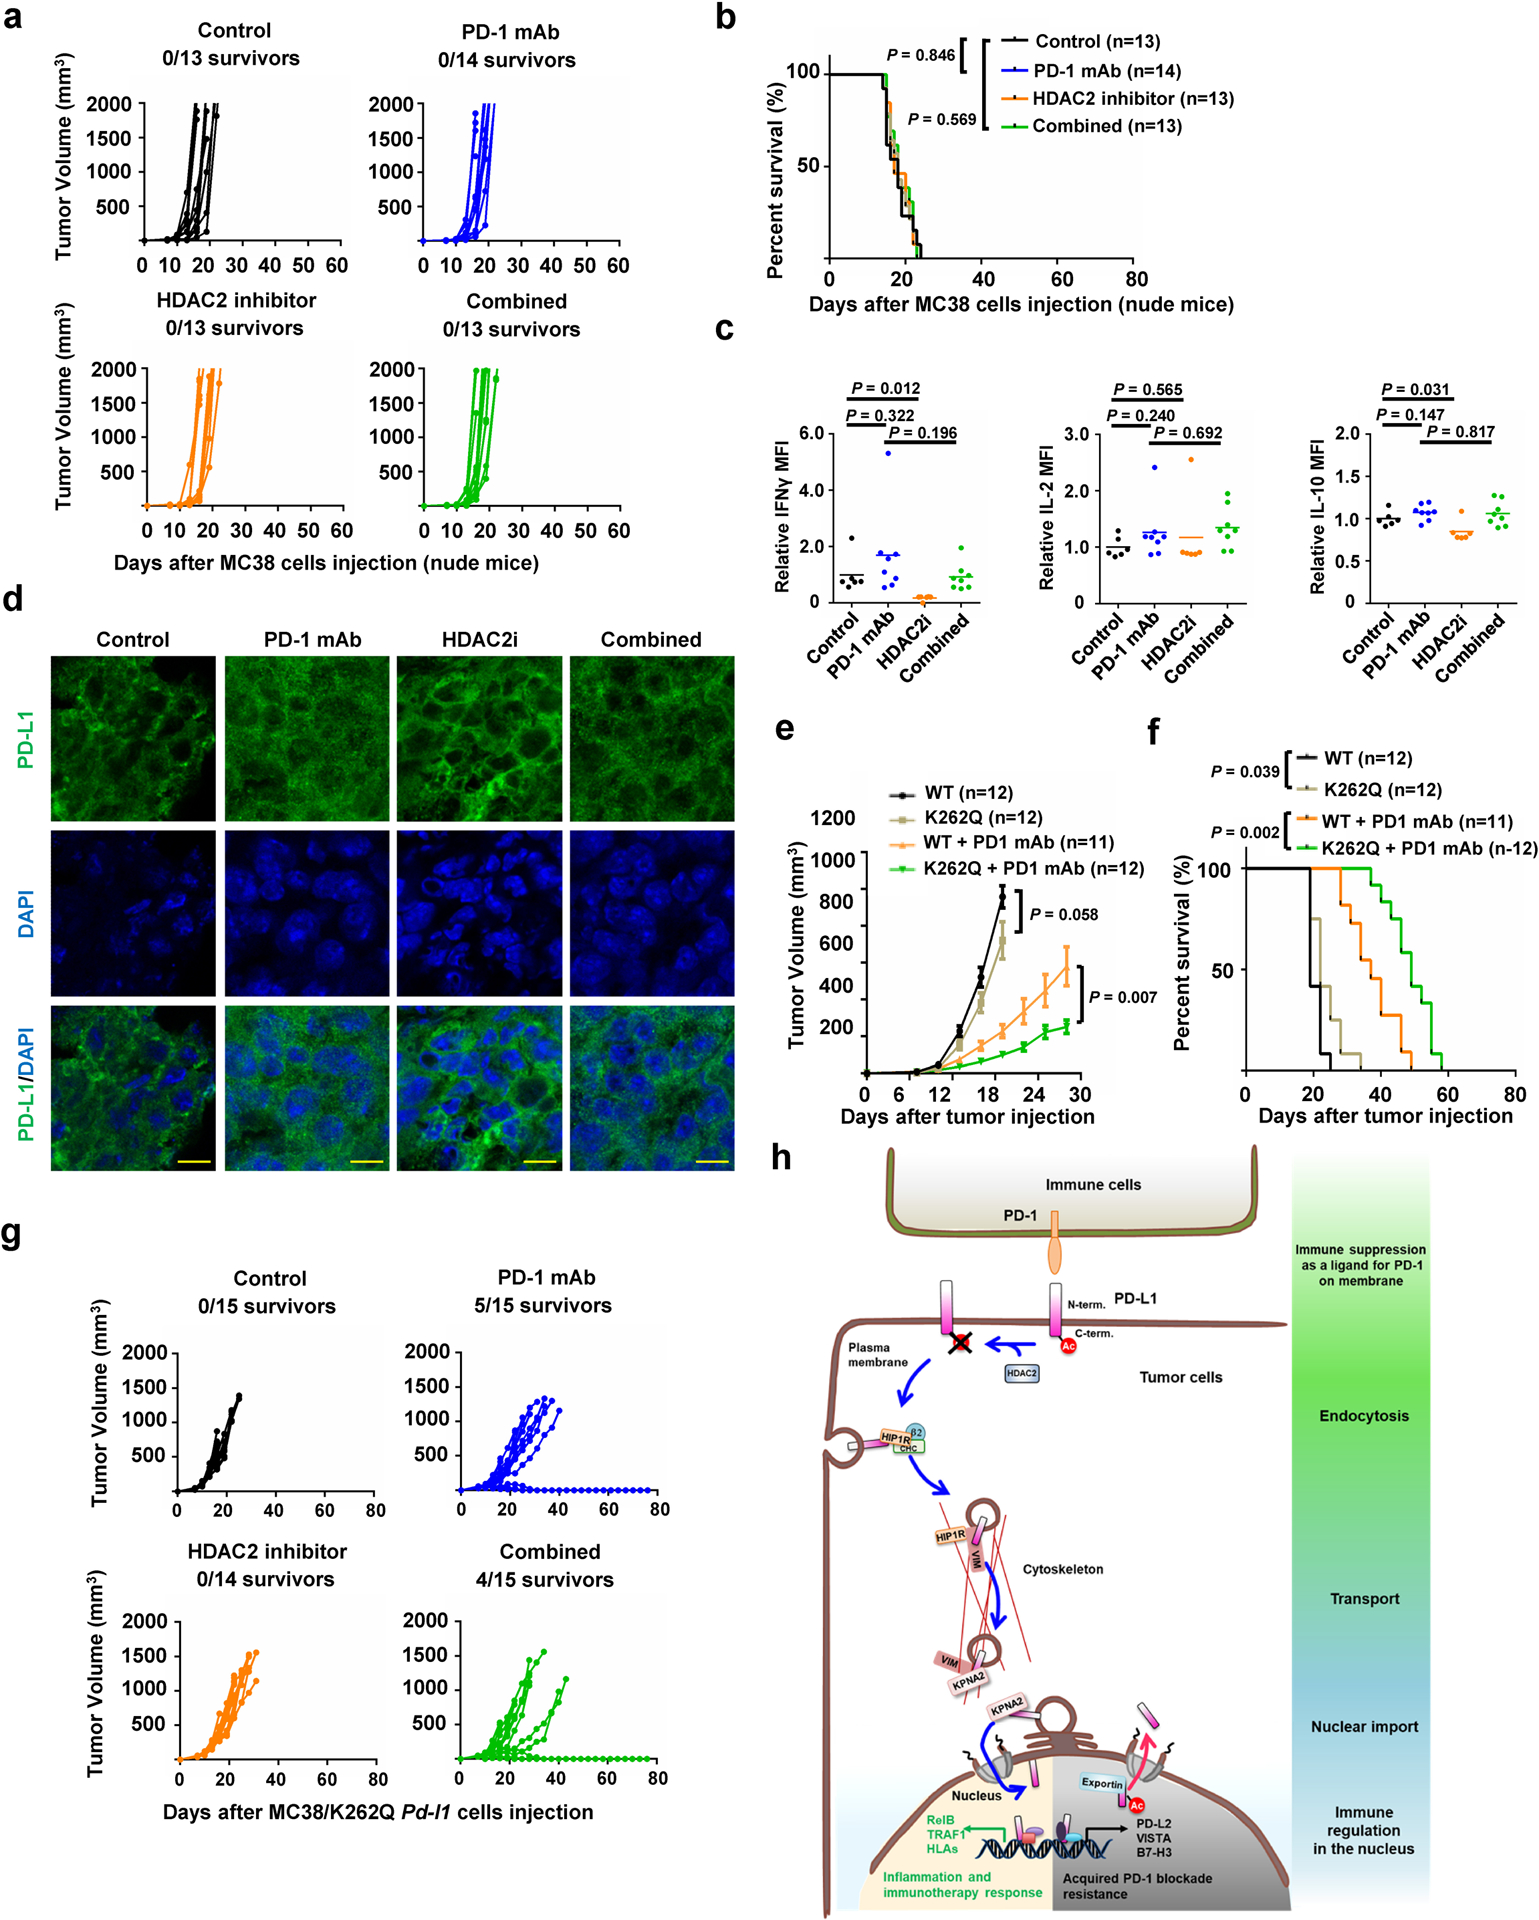
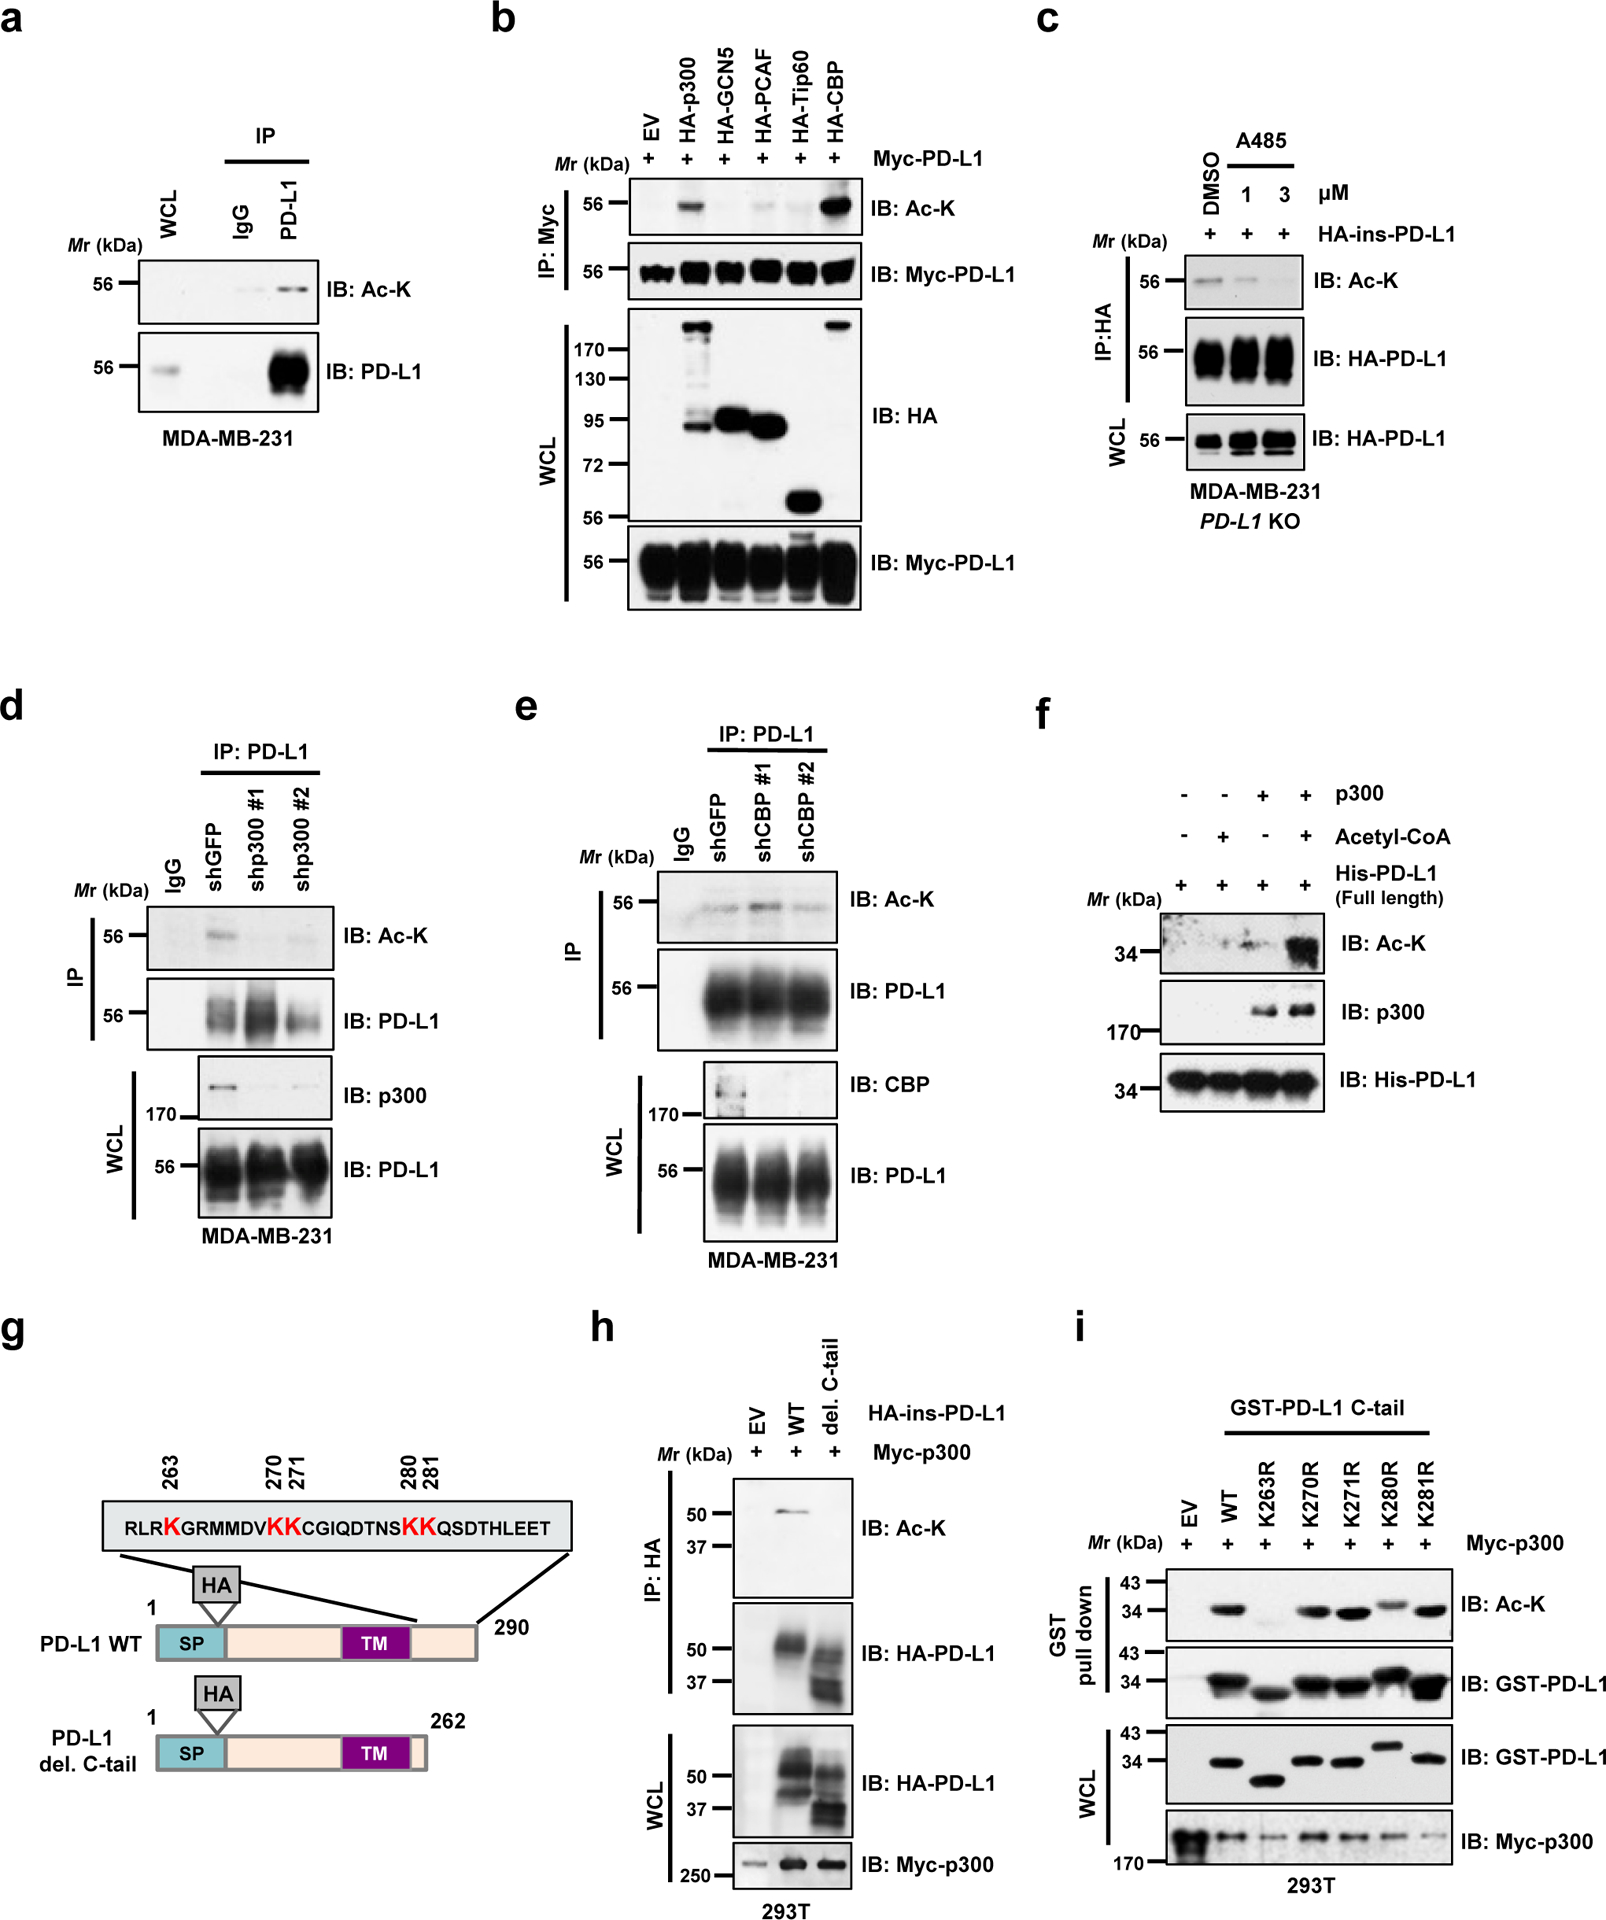
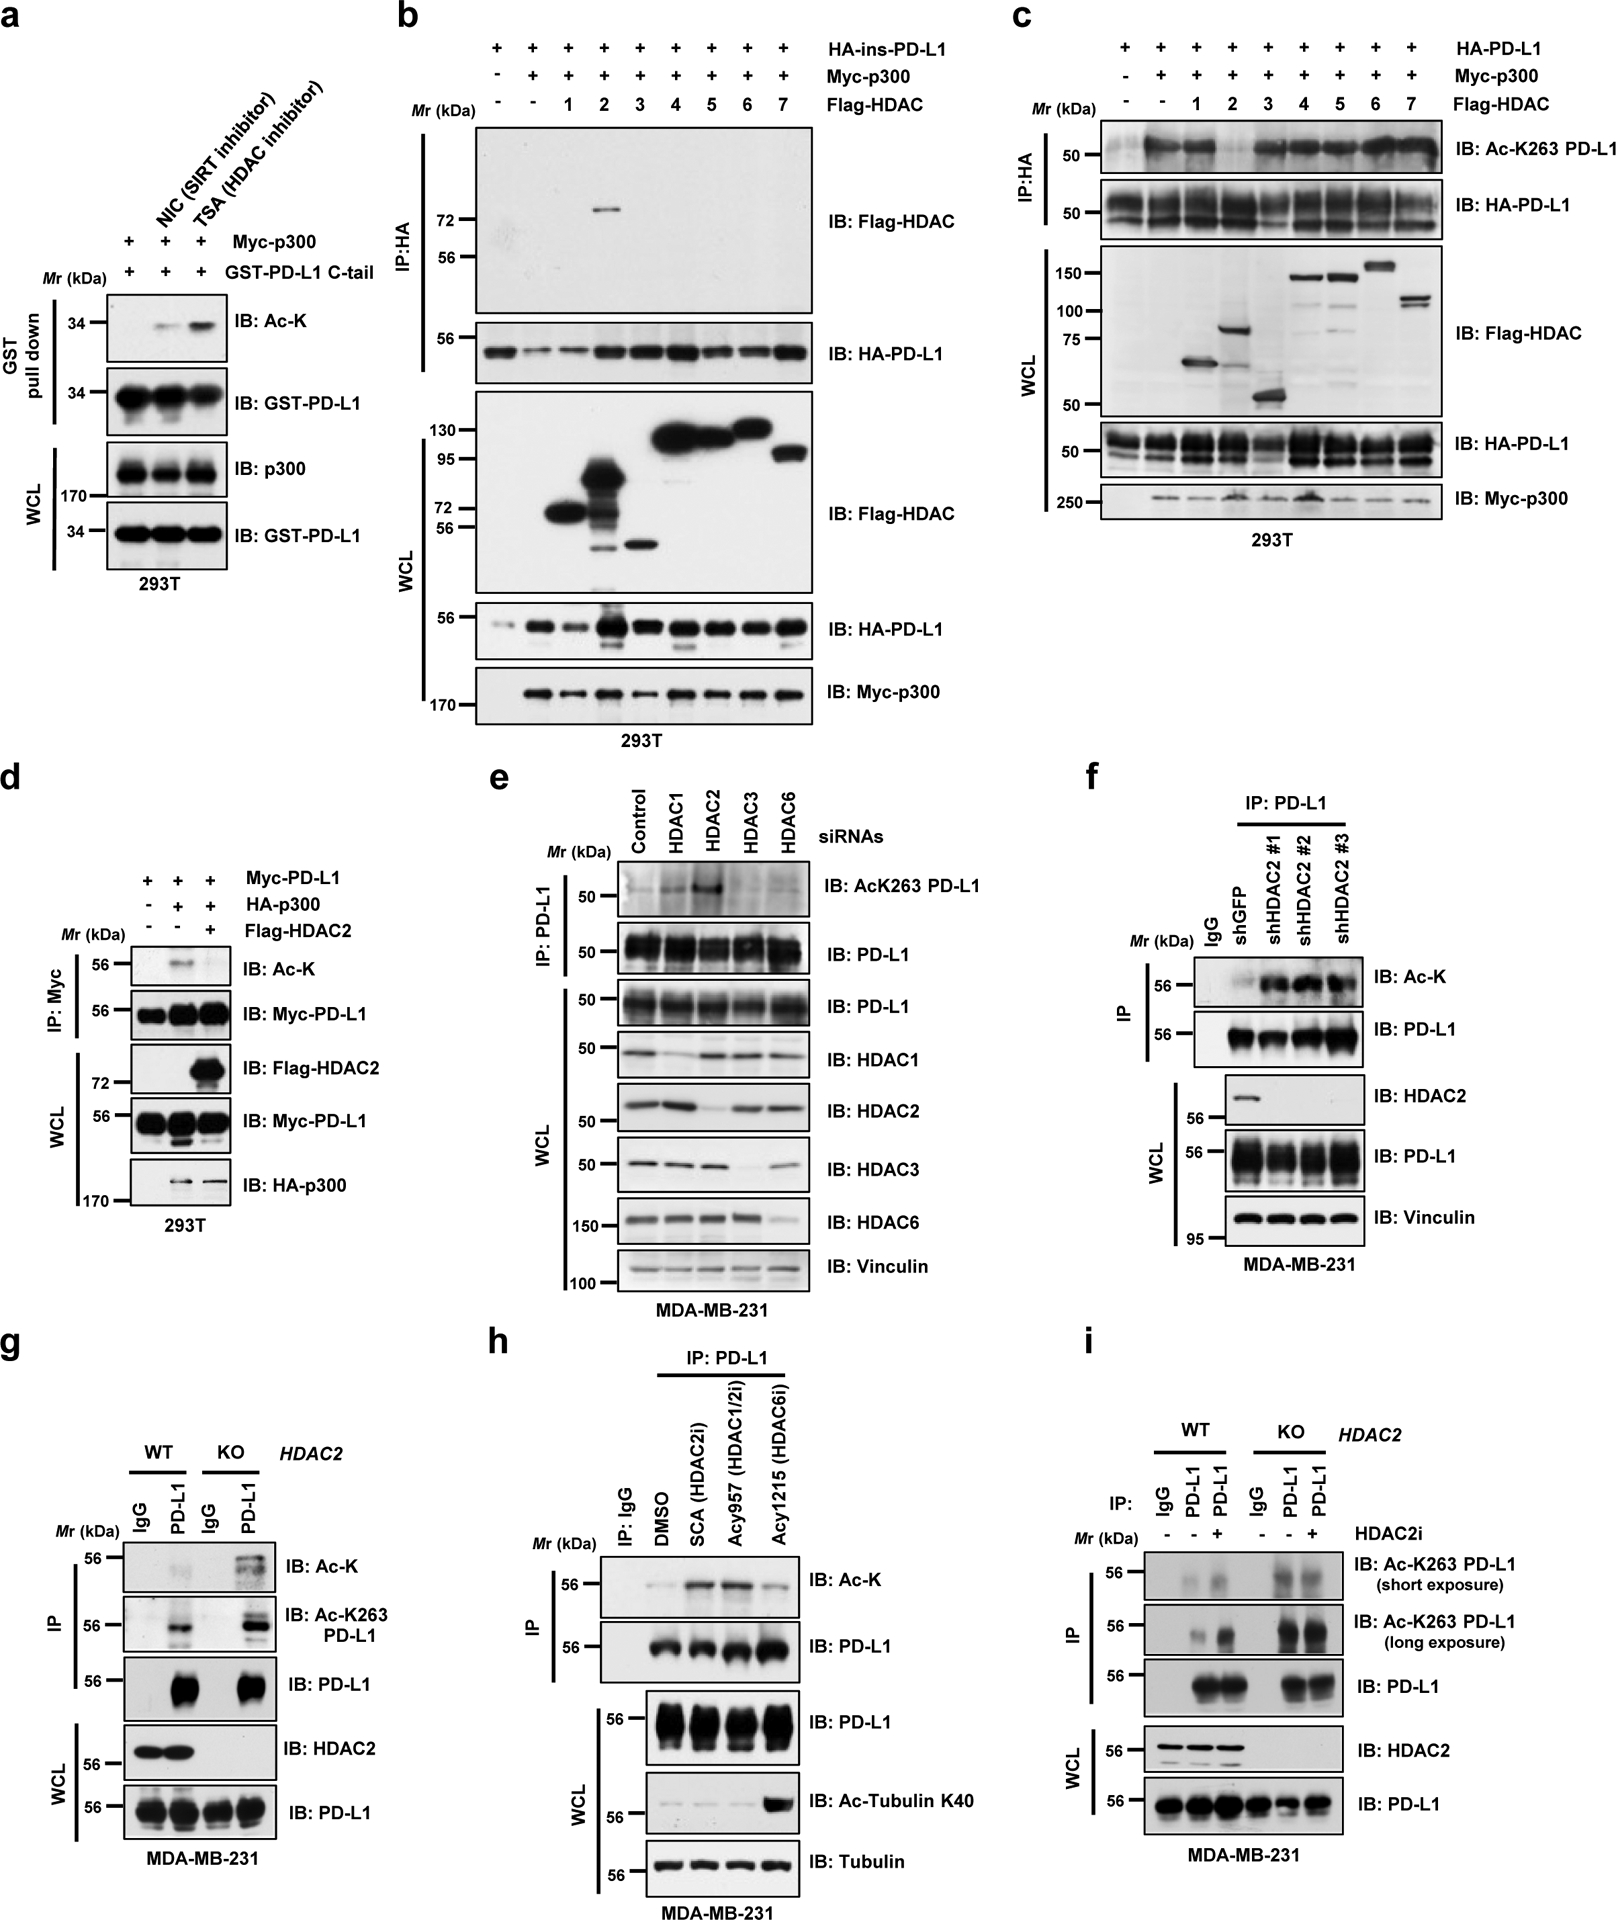
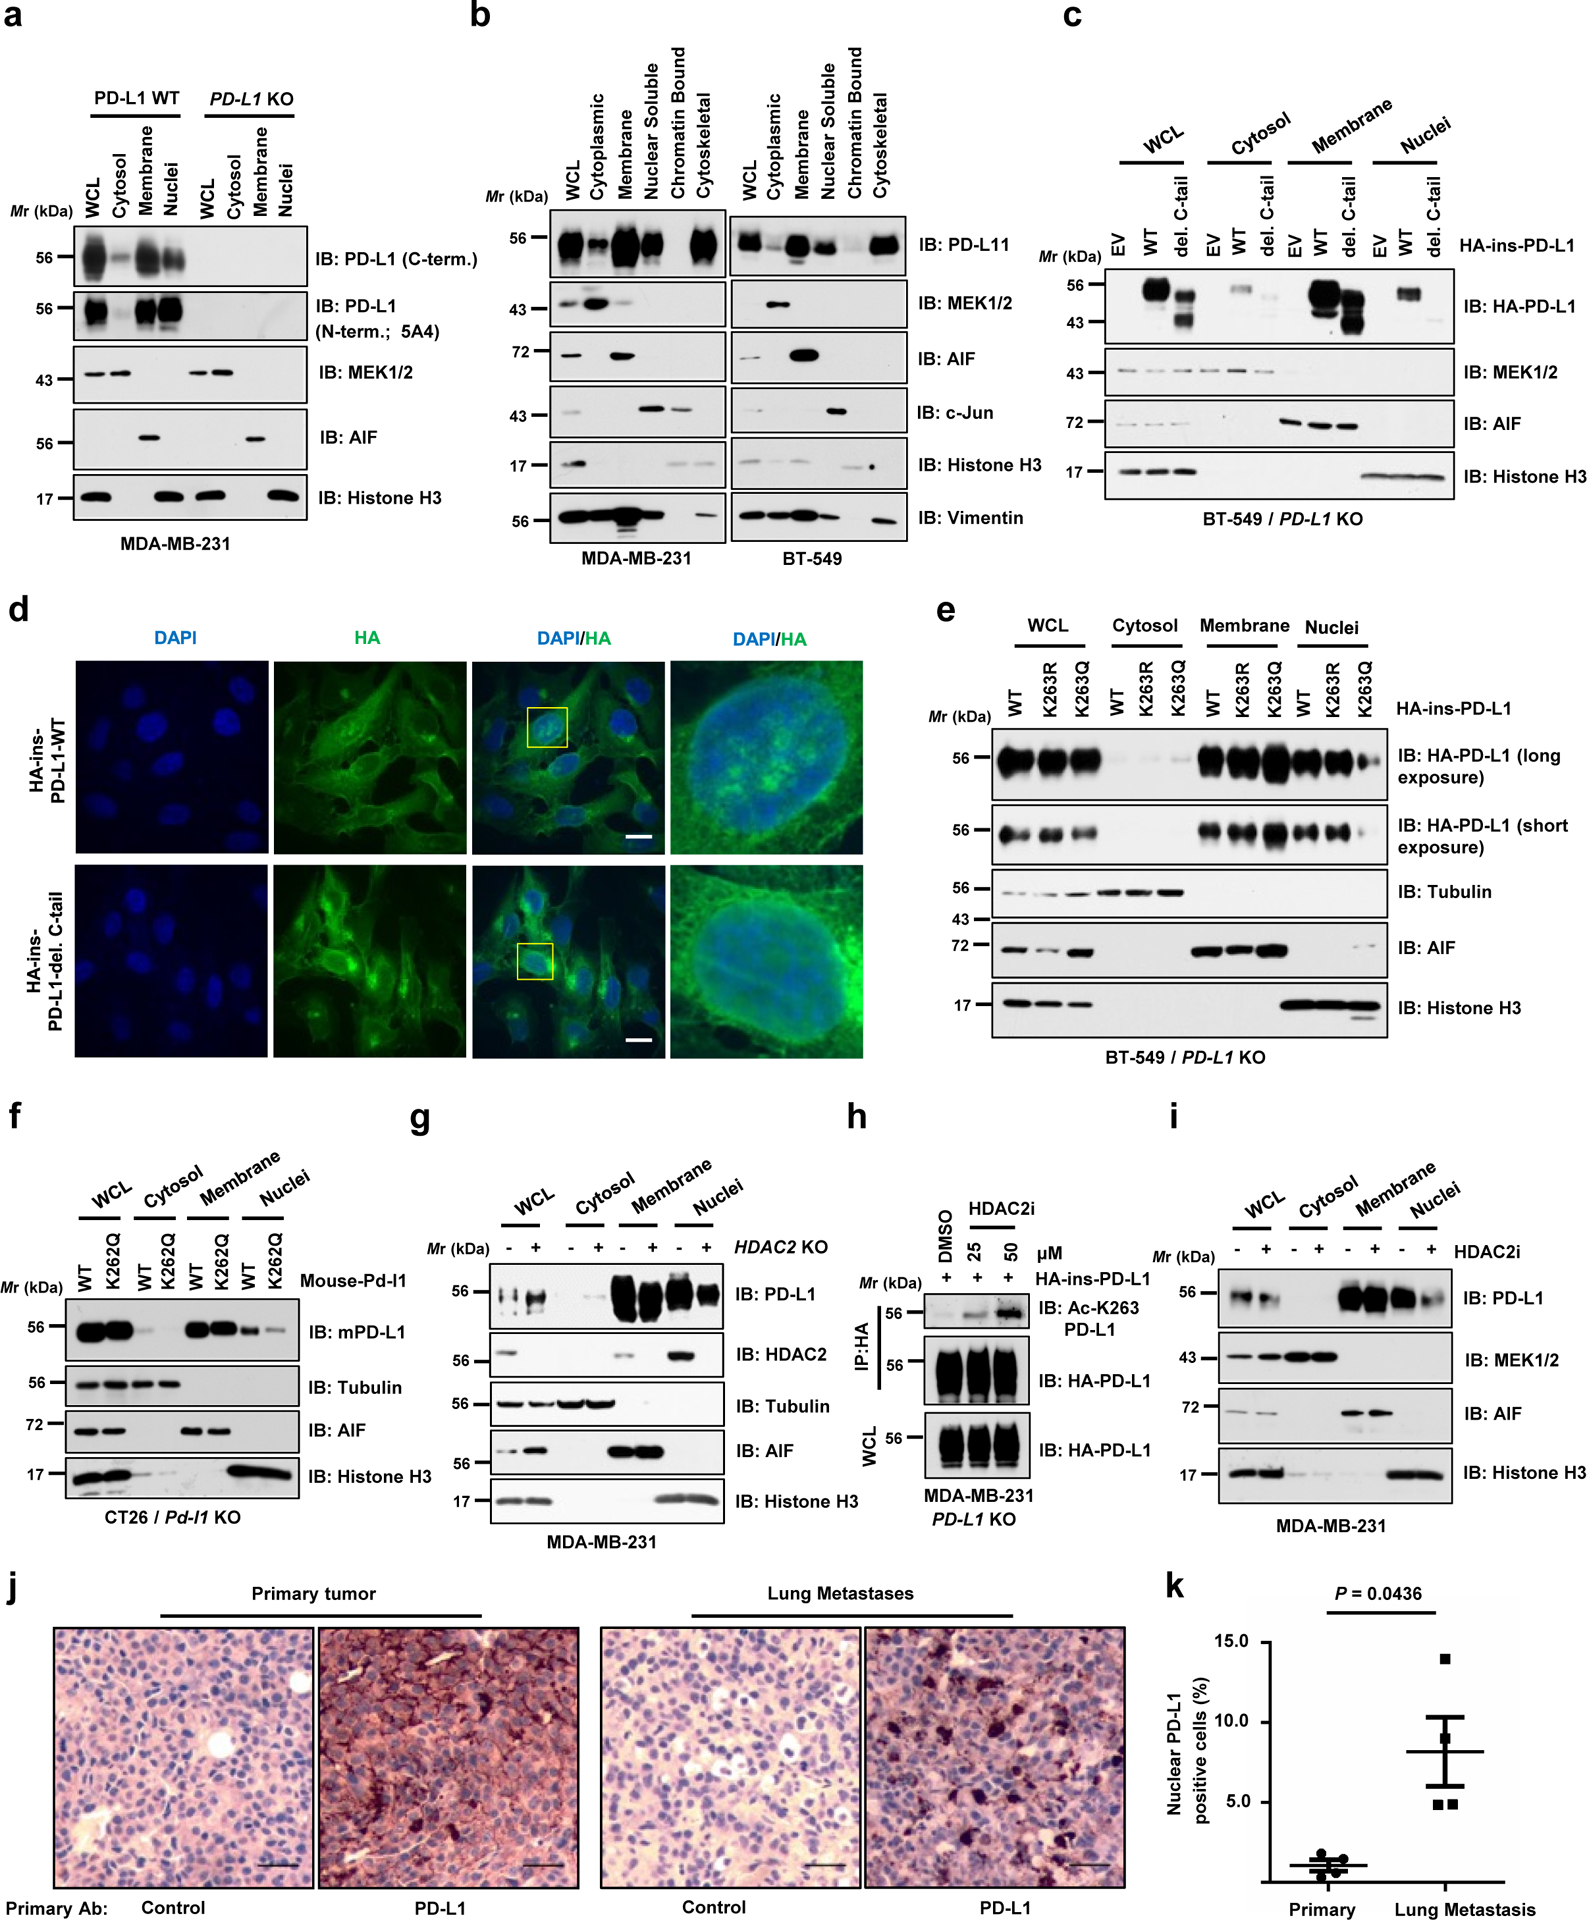
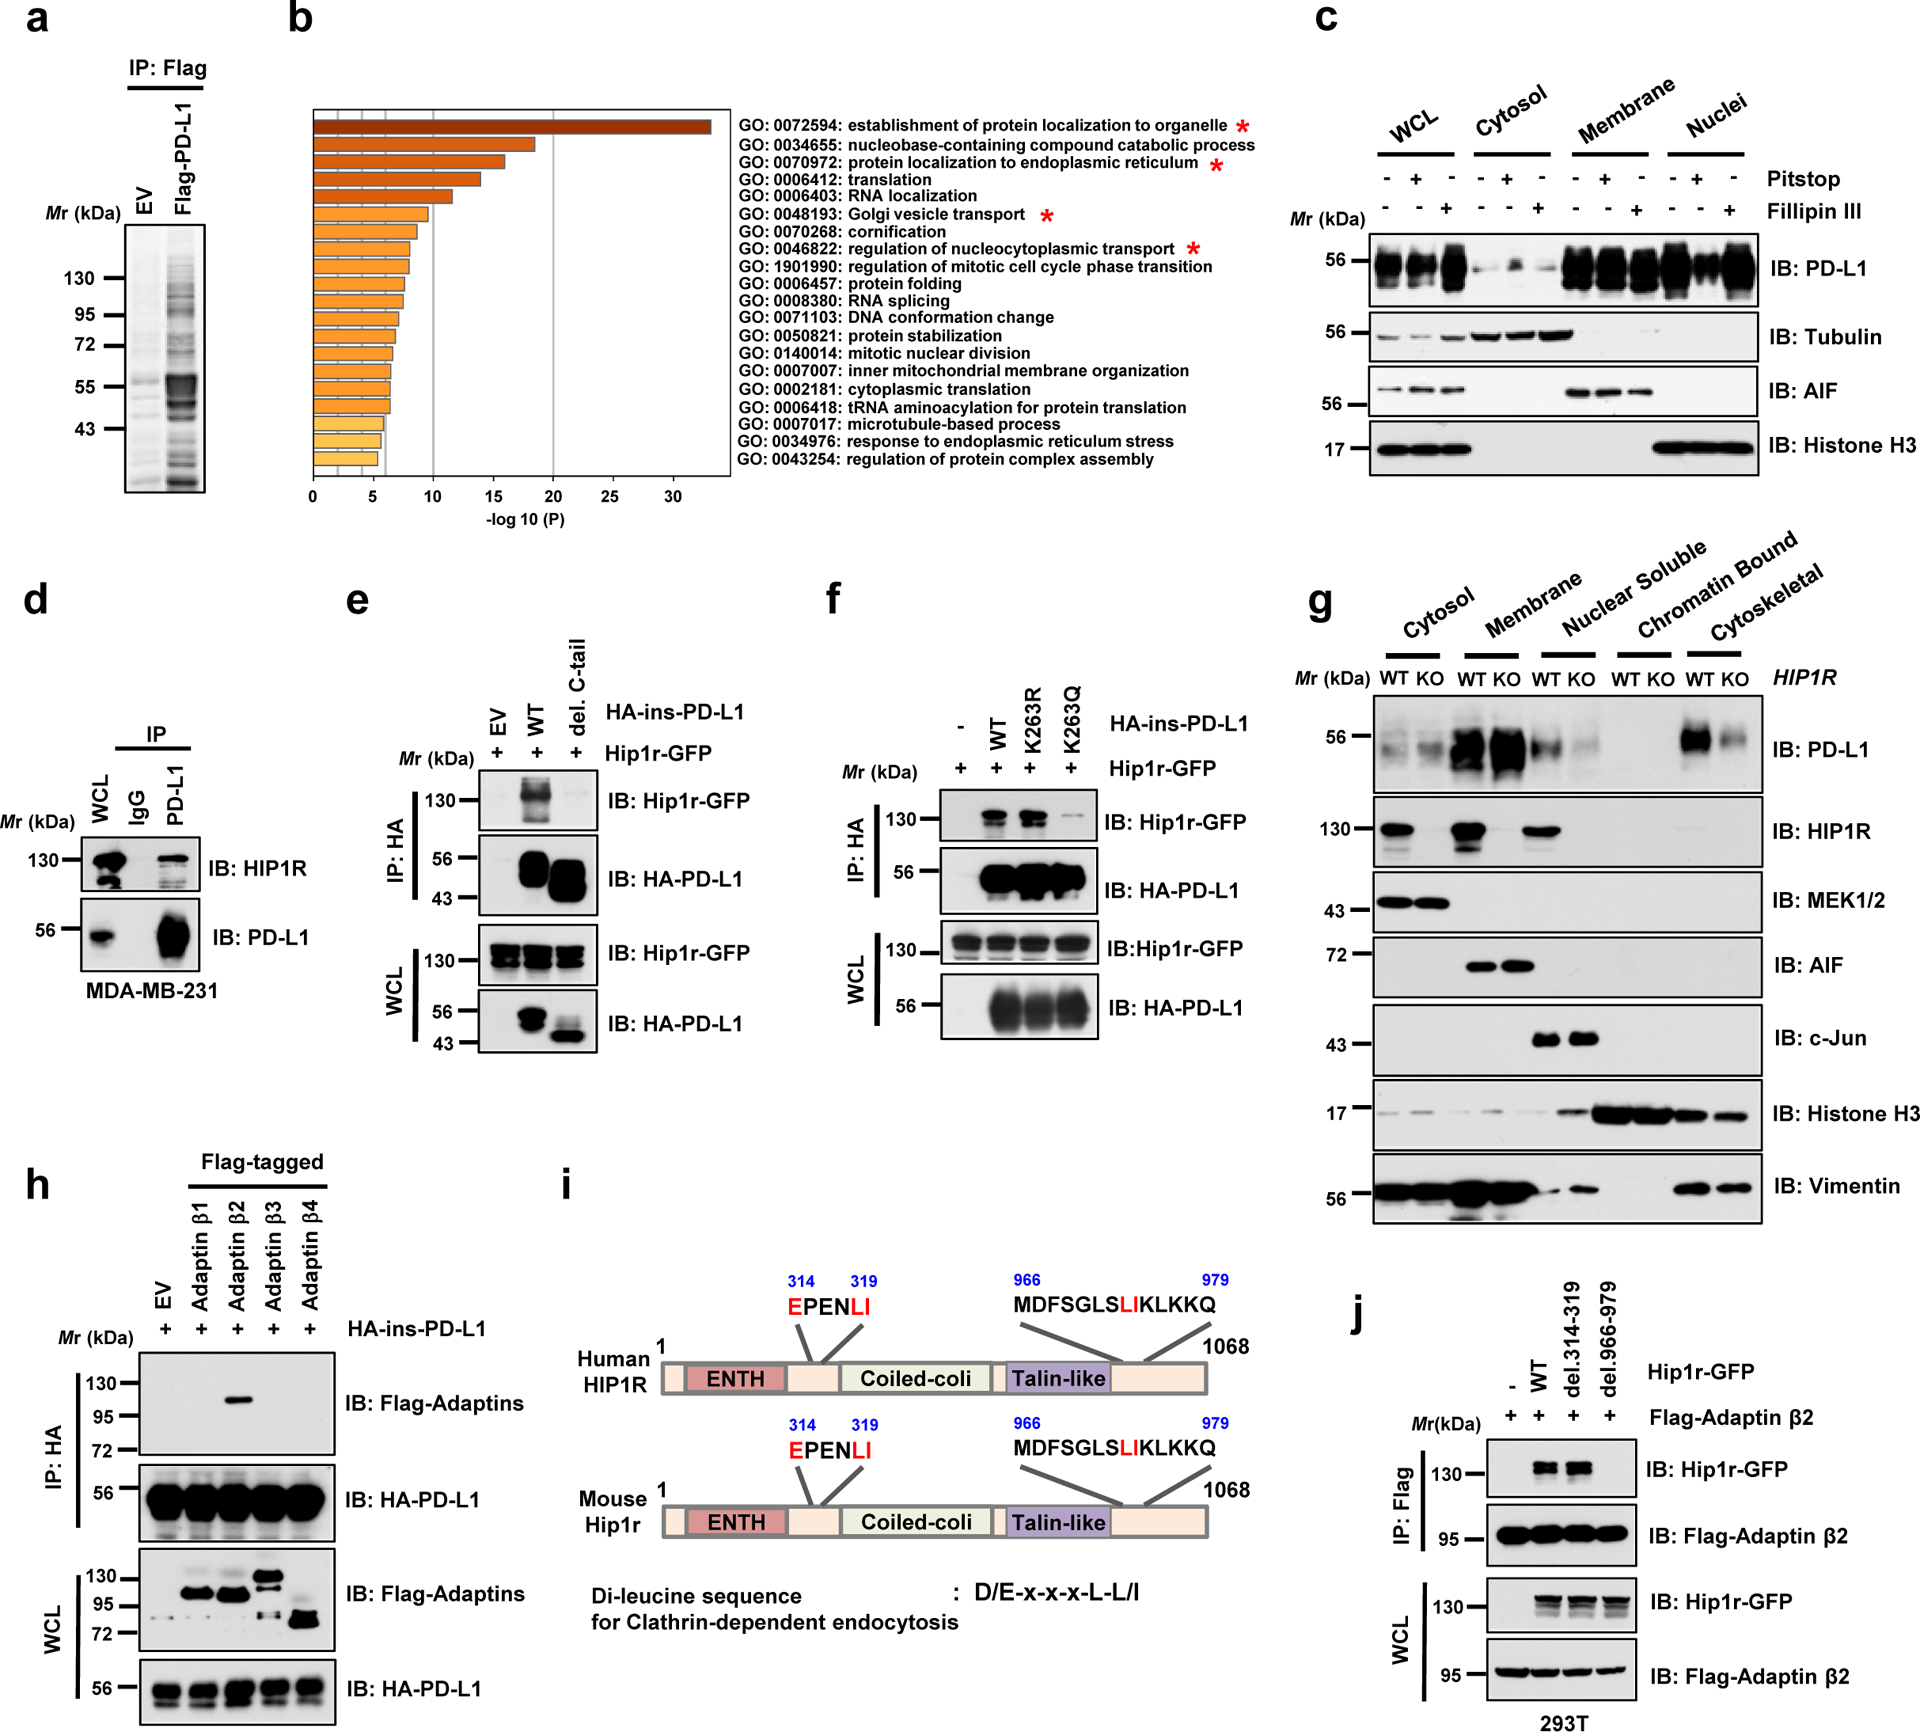
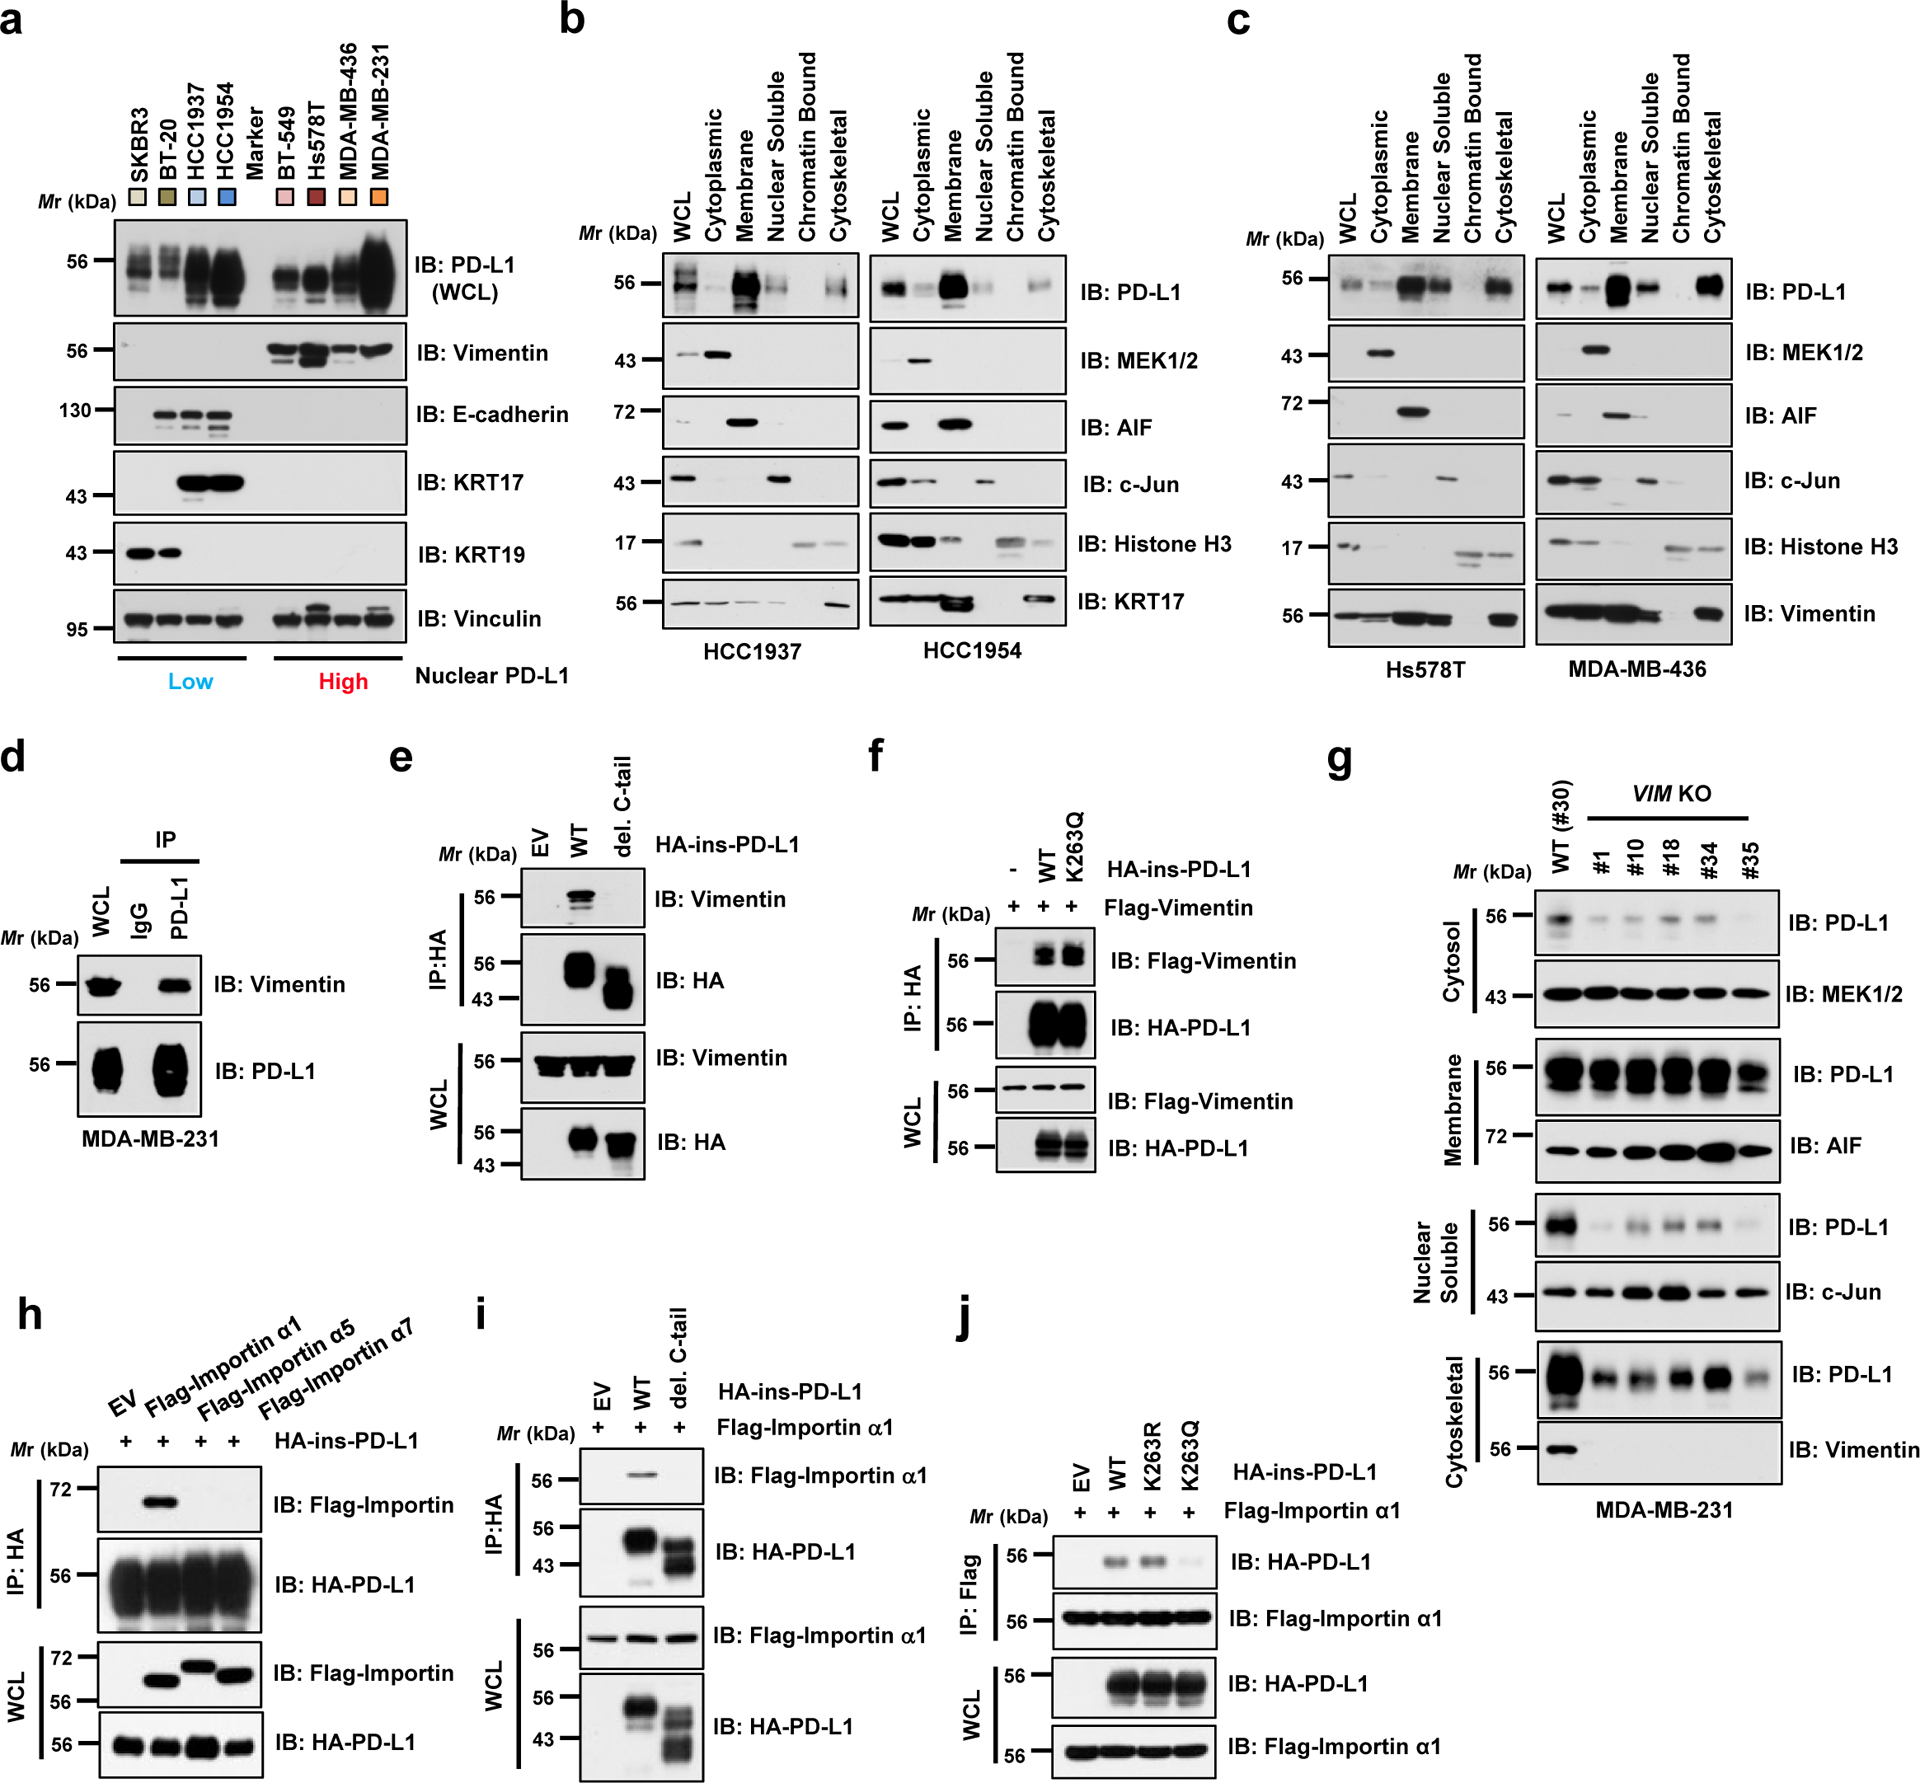
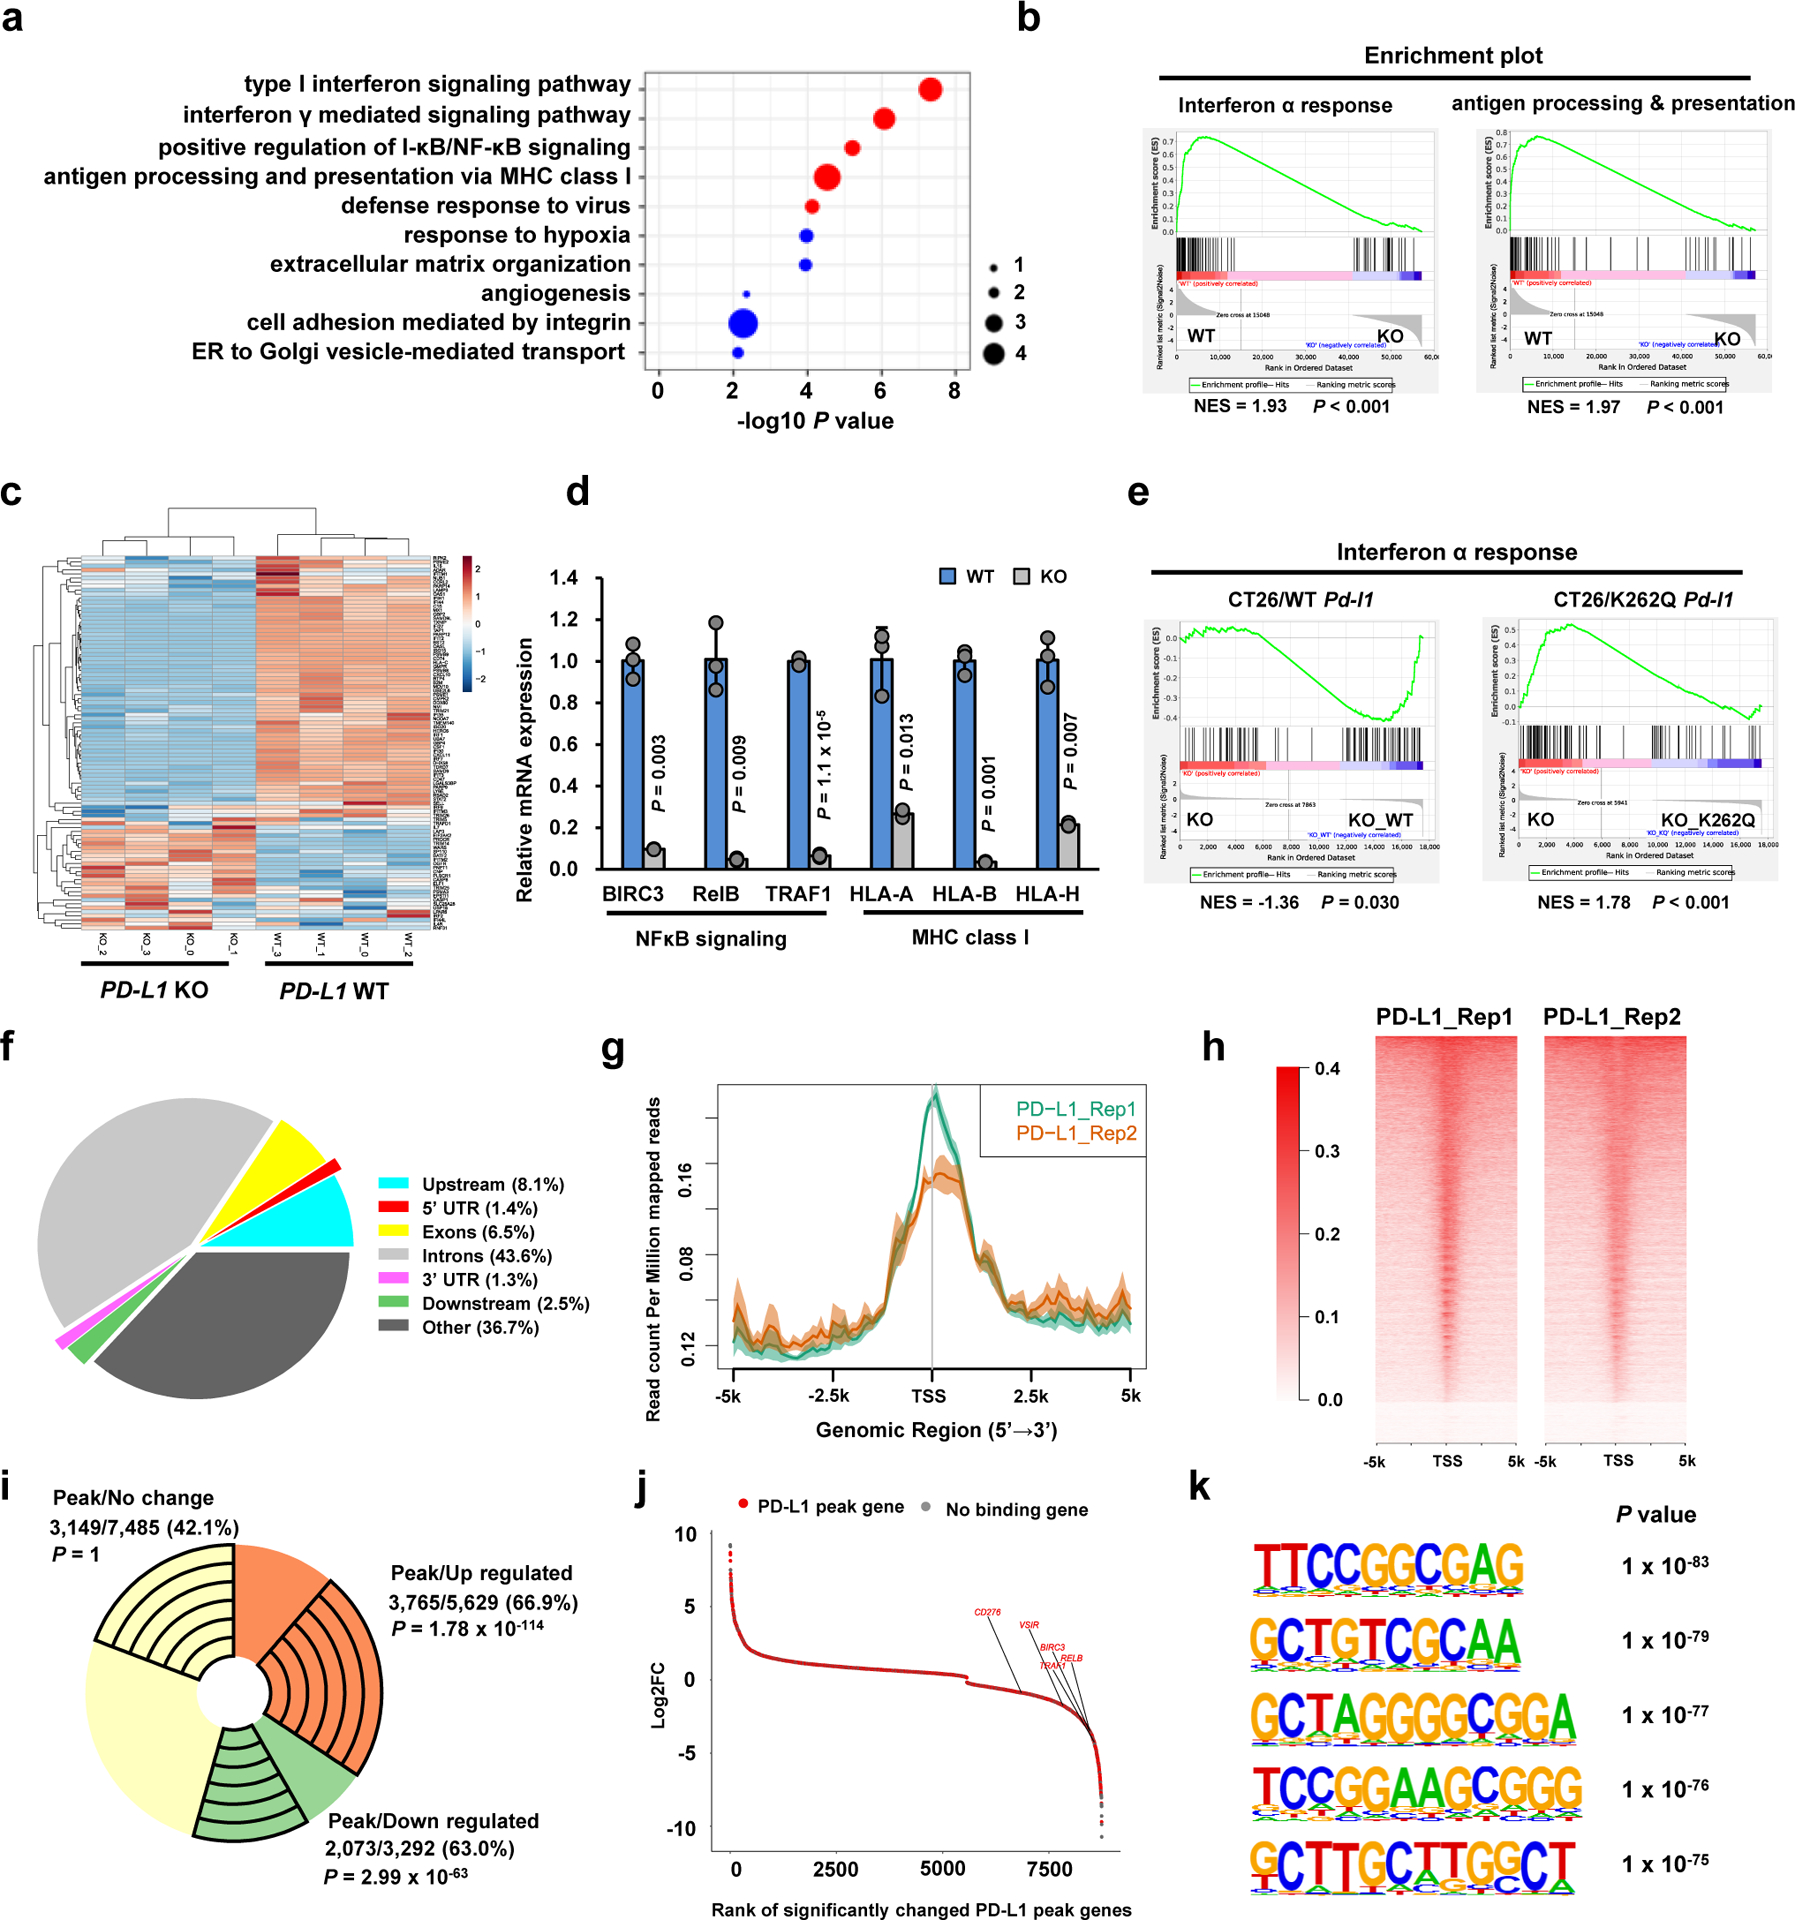
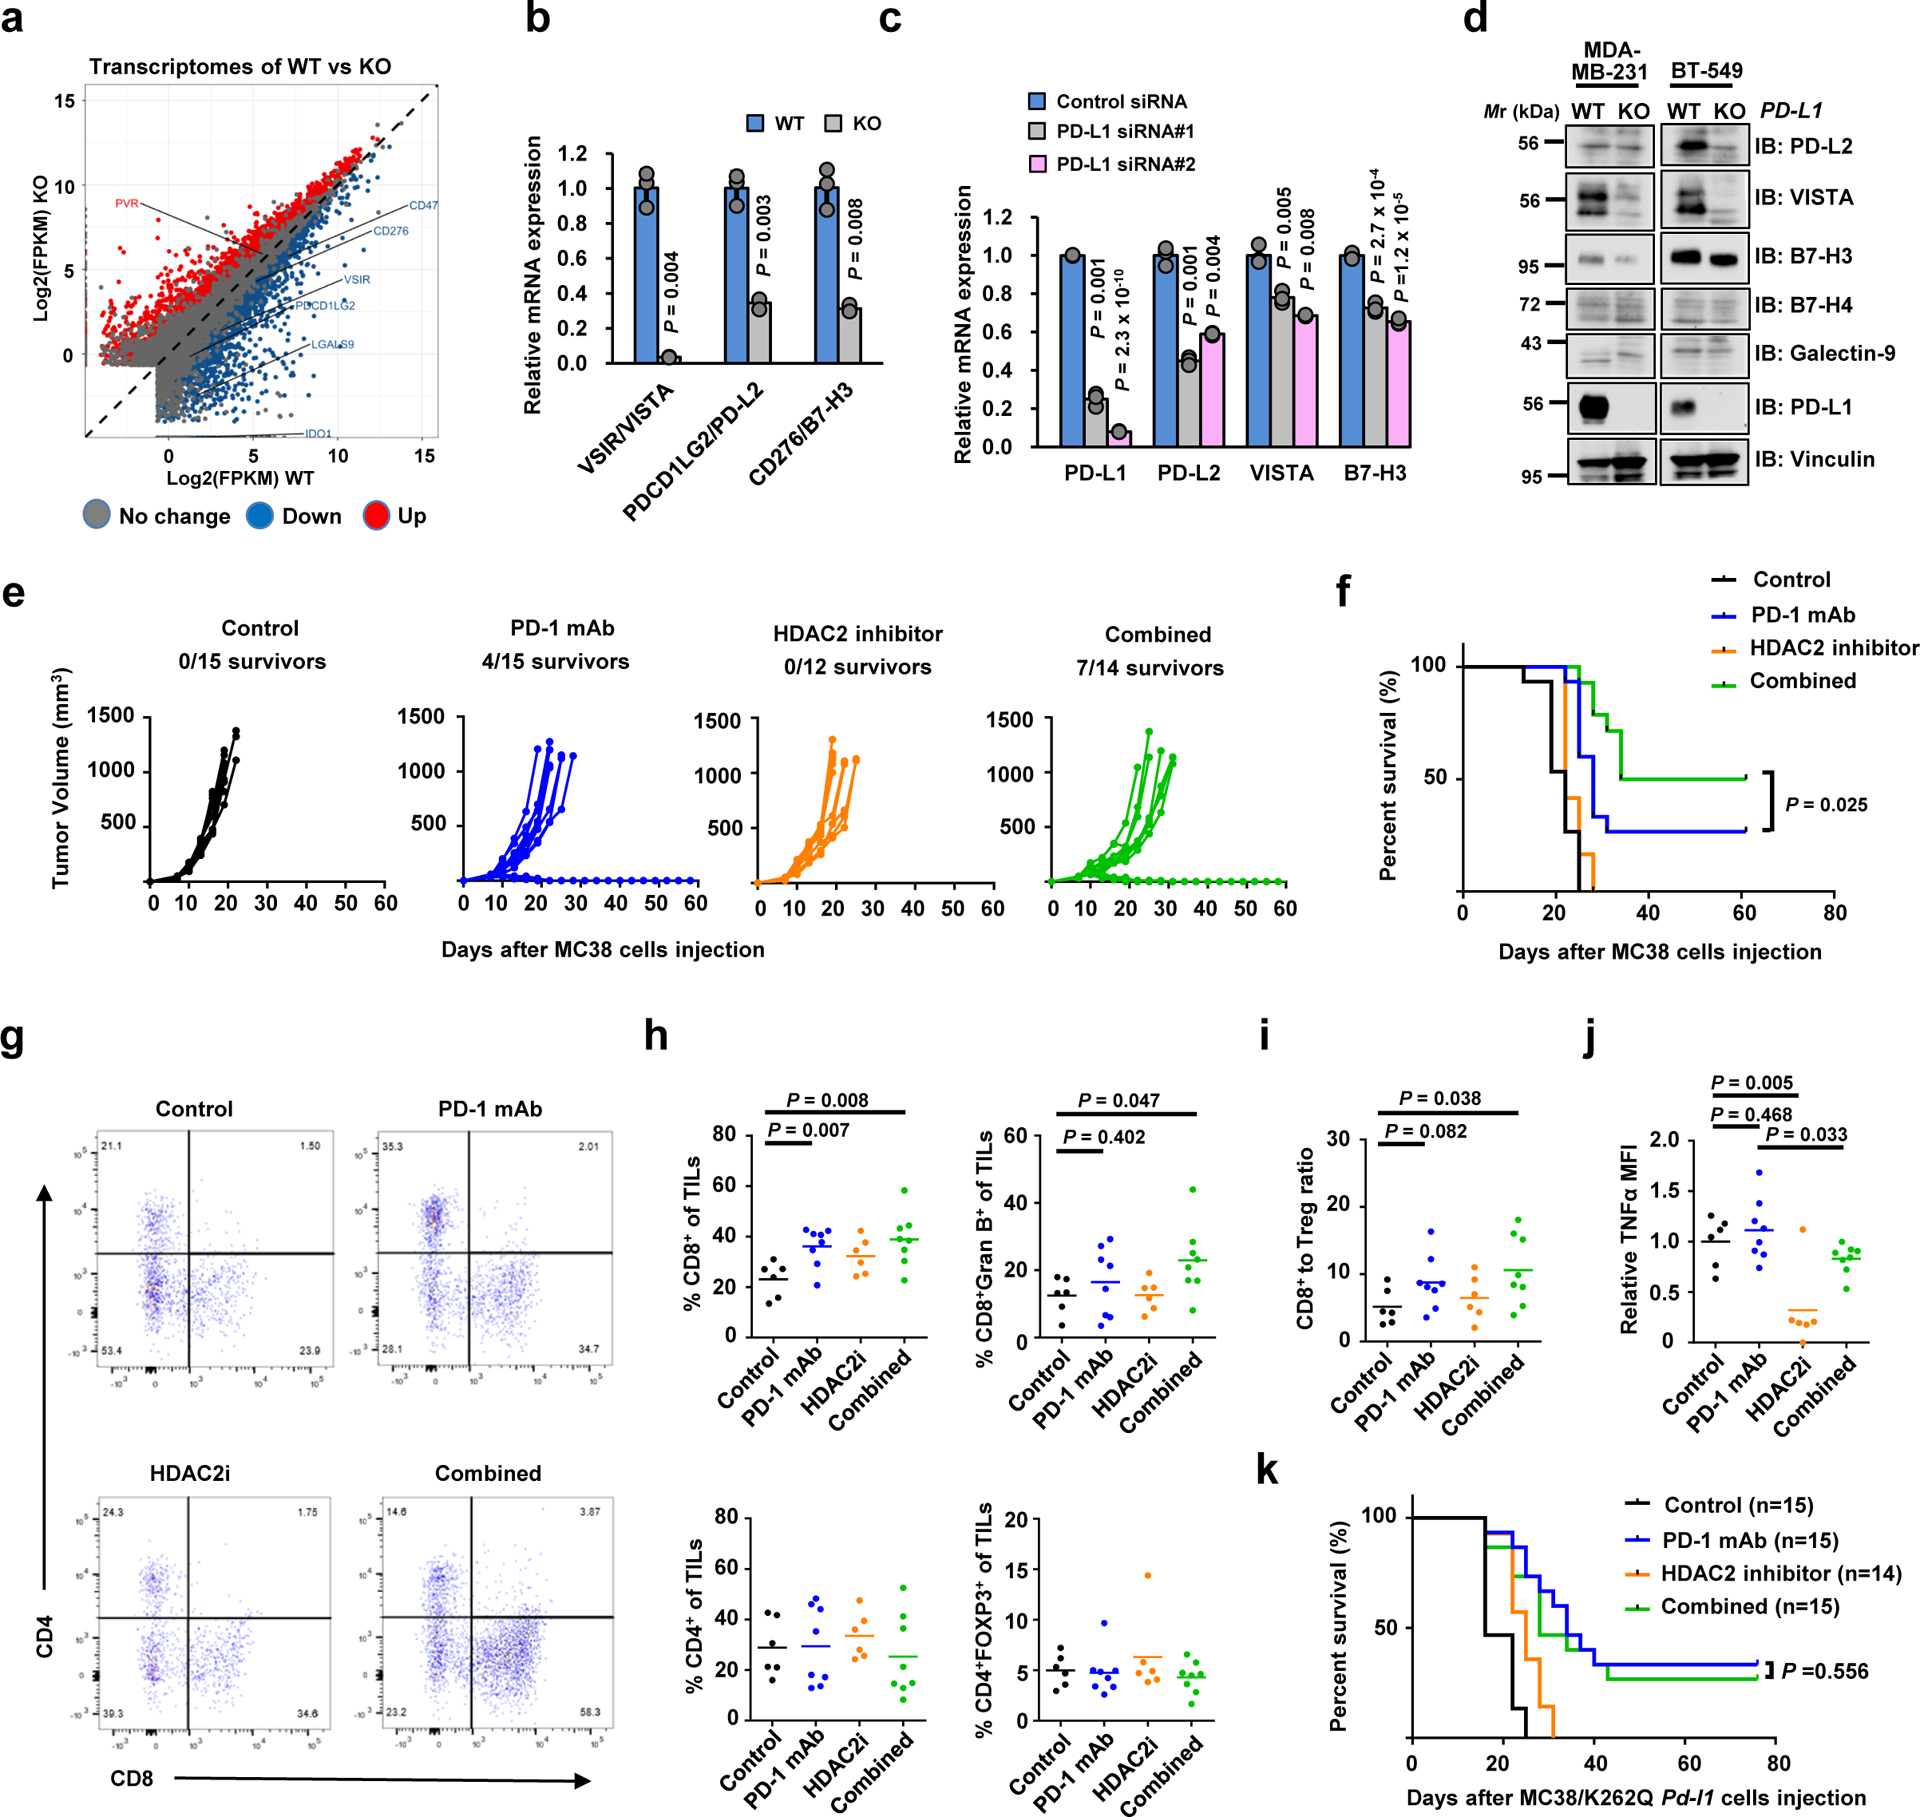
Immunotherapies that target programmed cell death protein 1 (PD-1) and its ligand PD-L1 as well as cytotoxic T-lymphocyte-associated protein 4 (CTLA4) have shown impressive clinical outcomes for multiple tumours. However, only a subset of patients achieves durable responses, suggesting that the mechanisms of the immune checkpoint pathways are not completely understood. Here, we report that PD-L1 translocates from the plasma membrane into the nucleus through interactions with components of the endocytosis and nucleocytoplasmic transport pathways, regulated by p300-mediated acetylation and HDAC2-dependent deacetylation of PD-L1. Moreover, PD-L1 deficiency leads to compromised expression of multiple immune-response-related genes. Genetically or pharmacologically modulating PD-L1 acetylation blocks its nuclear translocation, reprograms the expression of immune-response-related genes and, as a consequence, enhances the anti-tumour response to PD-1 blockade. Thus, our results reveal an acetylation-dependent regulation of PD-L1 nuclear localization that governs immune-response gene expression, and thereby advocate targeting PD-L1 translocation to enhance the efficacy of PD-1/PD-L1 blockade.


Conflict of interest statement

Competing interests

G.J.F. has patents/pending royalties on the PD-1 pathway from Roche, Merck, Bristol-Myers-Squibb, EMD-Serono, Boehringer-Ingelheim, AstraZeneca, Leica, Mayo Clinic, Dako and Novartis. G.J.F. has served on advisory boards for Roche, Bristol-Myers-Squibb, Xios, Origimed, Triursus, iTeos, NextPoint, IgM, and Jubilant. P.S. has been a consultant at Novartis, Genovis, Guidepoint, The Planning Shop, ORIC Pharmaceuticals, Syros and Exo Therapeutics; his laboratory receives research funding from Novartis. W.W. is a co-founder and consultant for the ReKindle Therapeutics. Other authors declare no competing financial interests.

Figures

Extended Data Fig. 1
Extended Data Fig. 1. Lysine 263 (K263) within the cytoplasmic domain of PD-L1 is acetylated.
a, Immunoblot (IB) analysis of whole-cell lysates (WCL) and anti-PD-L1 immunoprecipitates (IPs) derived from MDA-MB-468, BT-549 and BT-20 cells. Immunoglobulin G (IgG) served as a negative control. b, Authentication results of the BT-20 cell line performed by ATCC. c, IB analysis of WCL and anti-Myc IPs derived from 293T cells transfected with HA-p300 and Myc-full length (FL) PD-L1 or the deletion mutant of C-tail (amino acids (AA) 263–290). d, IB analysis of WCL derived from 293T cells transfected with HA-tag-inserted (HA-ins) or Myc-tagged wild-type (WT) or del. C-tail PD-L1 with or without 1 μg/ml tunicamycin treatment overnight. e, Predicted lysine acetylation sites by the Web Server for KAT-specific Acetylation Site Prediction (ASEB) analysis. f, A schematic diagram of the PD-L1 Lys263 acetylated peptide and non-acetylated peptide used for immunization to generate the anti-Ac-K263 PD-L1 antibody. g, Dot-blot testing of acetylated and non-acetylated peptides using indicated purified antibodies. h, IB analysis of WCL and anti-HA IPs derived from 293T cells transfected with HA-ins-PD-L1 WT or the K263R mutant. i, Mass-spectrometry detection of Lys263 acetylation using a synthetic peptide (AA 261 to 270) following in vitro acetylation assay. The blots and western blots in a, c, d, g and h were performed for n=2 independent experiments with similar results. Unprocessed immunoblots are shown in Source Data Extended Data Fig. 1.
Extended Data Fig. 2
Extended Data Fig. 2. HDAC2 mediates deacetylation of PD-L1.
a, IB analysis of WCL and anti-Flag IPs derived from 293T cells transfected with Myc-p300, HA-ins-PD-L1 and/or Flag-tagged deacetylases. b, IB analysis of WCL and Ni-NTA pull-down products from MDA-MB-231 WT and HDAC2 knockout (KO) cells transfected with His-Ub and treated with 10 μM MG-132 overnight. c, d, IB analysis of WCL derived from BT-549 PD-L1 KO cells transfected with HA-PD-L1 WT, K263R or K263Q mutants and treated with 150 μg/ml cycloheximide (CHX) for indicated hours (c). Signal intensity of PD-L1 protein was quantified by ImageJ as indicated (d). e, IB analysis of WCL and anti-Myc IPs derived from 293T cells transfected with indicated constructs. Western blots in a-c and e were performed for n=2 independent experiments with similar results. Unprocessed immunoblots are shown in Source Data Extended Data Fig. 2.
Extended Data Fig. 3
Extended Data Fig. 3. Lysine 263 (K263) acetylation regulates PD-L1 nuclear translocation.
a, Immunofluorescence (IF) staining of human PD-L1 (clone 9A11) and DAPI of MDA-MB-231 WT and PD-L1 KO cells. Scale bars, 10 μm. b, c, Fractionation analysis using kit from Cell Signaling Technology (CST, #9038) for PD-L1 in human MDA-MB-436, Hs578T and BT-549 cells (b), as well as in mouse CT26, MC38, and B16F10 cells (c). d, Fractionation analysis using kits from Thermo Fisher Scientific™ (#78840) for PD-L1 in indicated cell lines. e Quantification of PD-L1 protein abundance of indicated compartments in MDA-MB-231 cells. Data were presented as mean ± s.d. (n=3 biologically independent samples). f, Fractionation analysis for PD-L1 from 293T cells transfected with mouse PD-L1. g, h, Fractionation analysis for PD-L1 in RAW264.7 cells stimulated with 1 μg/ml Lipopolysaccharide (LPS) for 16 hours (g) and in mouse embryonic fibroblasts (h). i, Z-stacks confocal microscopy images (3x close-up of the source picture) for IF study in Figure 3d. PD-L1, yellow color and DAPI, blue. j, Fluorescence images of MDA-MB-231 PD-L1 KO cells transduced with Halo-PD-L1 (AF488) or its C-tail deletion mutant. Scale bars, 5 μm. k, IF staining of mouse PD-L1 (clone 5C5) in CT26 Pd-l1 KO cells transduced with mouse Pd-l1 WT, K262R or K262Q mutant lentivirus. Scale bars, 5 μm. l, IB analysis of WCL and anti-PD-L1 IPs derived from indicated fractions of MDA-MB-231 cells. m, Fractionation analysis for BT-549 cells treated with 50 μM HDAC2 inhibitor for 6 hrs. n, Fractionation analysis for PD-L1 in MDA-MB-231 WT or HDAC2 KO cells. The Western blots in b-d, f-h, l-n, and IF studies in a, j and k were performed for n=2 independent experiments with similar results. Unprocessed immunoblots are shown in Source Data Extended Data Fig. 3.
Extended Data Fig. 4
Extended Data Fig. 4. Protein interacting network likely mediates PD-L1 nuclear translocation process.
a, Results from mass spectrometry analysis were analyzed for GO term enrichment. Red stars denote pathways associated with protein translocation. n = 2 independent experiments with similar results. P values were calculated using hypergeometric test. b, IB of WCL and anti-HA IPs derived from 293T cells transfected with HA-ins-PD-L1 and mouse Hip1r-GFP, and treated with HDAC2 inhibitor for 6 hrs. c, IB of WCL and anti-Flag IPs derived from 293T cells transfected with PD-L1 WT or glycosylation-deficient 4NQ (N35, N192, N200 and N219) mutant. d, Fractionation analysis for PD-L1 from 293T cells transfected with WT or the glycosylation-deficient 4NQ mutant. e, Schematic diagram depicting the working model for endocytosis of PD-L1 from plasma membrane. f, Fractionation analysis for PD-L1 in Vimentin-low SKBR3 and BT-20 cells. g, Relative abundance of PD-L1 protein in each fraction was quantified and calculated for percentage. Statistics, two-tailed Student’s t-test. h, Fractionation analysis for PD-L1 in CT26 WT and Vim KO clones. i, IB of HCC1937 cells treated with 10 ng/ml Transforming Growth Factor-β1 (TGFβ1) for 14 days. j, Fractionation analysis for PD-L1 in HCC1937 cells treated with 10 ng/ml TGFβ1 for 14 days. k, Fractionation analysis for PD-L1 in MDA-MB-231 cells treated with vehicle or 25 μM Ivermectin (IVM) for 2 hrs. l, A schematic diagram to show the working model for nuclear translocation of PD-L1 from plasma membrane. Western blots in b-d, f, and h-k were performed for n=2 independent experiments with similar results. Unprocessed immunoblots are shown in Source Data Extended Data Fig. 4. Statistical source data are available in Statistical Source Data Extended Data Fig. 4.
Extended Data Fig. 5
Extended Data Fig. 5. Nuclear PD-L1 likely stimulates the gene expression of pro-inflammation pathways.
a, DNA binding assays of purified PD-L1 with biotinylated DNA in vitro. b, c, DNA binding assays of biotinylated DNA and 293T cells transfected with indicated constructs. d, DNA biding assays of transfected 293T cells treated with Acy957. e, Numbers of differentially expressed genes upon PD-L1 KO. f, Top 5 enriched immune response-related GO terms upon Pd-l1 KO in CT26 cells, analyzed by Fisher-exact test with Benjamini-Hochberg correction. g, GSEA signature upon PD-L1 KO in MDA-MB-231 cells. h, Heatmap display of interferon γ genes upon PD-L1 KO in MDA-MB-231 cells. i, Prediction analysis for transcription factors regulating down-regulated genes upon PD-L1 KO in MDA-MB-231 cells. j, GSEA signatures upon Pd-l1 KO in CT26 cells. k, l, GSEA signatures of pathways in CT26 Pd-l1 KO cells restored WT or K262Q mutant Pd-l1. m, qRT-PCR analysis of BT-549 PD-L1 KO cells transfected with PD-L1 WT or K263Q mutants. Data are shown as mean ± s.d. of n=3 independent experiments. Statistics, two-tailed Student’s t-test. n. Hierarchical clustering of ChIP-seq binding profiles and two replicates of PD-L1 binding profiles genome-wide in MDA-MB-231 cells. o. IB of WCL and anti-PD-L1 IPs derived from MDA-MB-231 cells. p, q, IB of WCL and IPs derived from 293T cells transfected with indicated constructs. r, Schematic diagram showing how nuclear PD-L1 enhances the immunotherapy response through affecting expression of immune-related genes. GSEA analyses in g and j-l were performed using Kolmogorov-Smirnov statistic. Biologically independent sequenced samples/group for f-j, n=4; for k and l, n=3. The blots and Western blots in a-d and o-q were performed for n=2 independent experiments with similar results. Unprocessed immunoblots are shown in Source Data Extended Data Fig. 5. Statistical source data are available in Statistical Source Data Extended Data Fig. 5.
Extended Data Fig. 6
Extended Data Fig. 6. PD-L1 expression levels correlate with and regulate immune-checkpoint genes.
a, qRT-PCR analysis of genes upon Pd-l1 KO in CT26 cells. b, IB of MDA-MB-231 cells transfected with control or PD-L1 siRNAs. c, d, IB (c) and qRT-PCR (d) analysis of MDA-MB-231 cells with PD-L1 knockdown by shRNAs. e, IB of WCL derived from breast cancer cell lines. f, g, Pearson correlation (two-tailed) analysis for PD-L1 mRNA (Z-score) with PD-L2 (f) or VISTA (g) in breast cancer cell lines (GSE36139). Red line, linear regression line. h, HDAC2 expression profiled by GEPIA. Tumour (T), red dots; normal tissues (N), green dots. i, Overall survival of patients with high (>70%, red curve) and low (<30%, blue curve) HDAC2 (i) or Vimentin (j) analyzed using Log-rank test by GEPIA. k, Progression-free survival (PFS) of melanoma patients (Riaz2017_PD1 cohort, PMID:29033130) treated with PD-1 mAb (Nivolumab) with high or low VIM expression analyzed using Kaplan-Meier curves by TIDE. Ipi_Naive, ipilimumab-naïve (n=25); Ipi_Prog, progressed on ipilimumab (n=26). l-p, qRT-PCR of MDA-MB-231 cells treated with vehicle or HDAC2 inhibitor. These genes are involved in Type I or III interferon pathways (l), STAT1/2 pathways (m), endogenous retrovirus ERVs (n), double-stranded pattern recognition receptors (o), antigen presenting and presentation via MHC class I (p). q, Schematic diagram to show a possible molecular mechanism of acquired PD-L1/PD-1 blockade resistance caused by nuclear PD-L1 (left), and the potential usage of HDAC2 inhibitor (right). Tumor abbreviations are shown in GEPIA. Western blots b-c and e were performed for n=2 independent experiments with similar results. PCR data a, d and l-p were shown as mean ± s.d. of n=3 independent experiments, analyzed by two-tailed Student’s t-test. Unprocessed immunoblots are shown in Source Data Extended Data Fig. 6. Statistical source data are available in Statistical Source Data Extended Data Fig. 6.
Extended Data Fig. 7
Extended Data Fig. 7. Targeting HDAC2 and inhibiting PD-L1 deacetylation can enhance immunotherapy efficacy.
a, b, Tumour growth (a) and survival curves (b) of nude mice bearing MC 38 tumors treated with control antibody, PD-1 mAb, HDAC2 inhibitor or combined therapy. c, TILs from treated MC38 syngeneic tumours (Control, n=6; PD-1 mAb, n=8; HDAC2i, n=6; Combined, n=8) after stimulation were analyzed for Interferon γ (IFNγ), IL-2 and IL-10. d, Immunofluorescence for PD-L1 and DAPI of MC38 syngeneic tumours treated as indicated. Scale bars, 10 μm. n=4 independent samples per group. e, f, Tumour growth (e) and survival curves (f) of BALB/c mice bearing tumor derived from CT26-Pd-l1 KO cells with re-introduced WT or K262Q Pd-l1, treated with control antibody or PD-1 mAb. Tumour volume was shown as mean ± s.d. Statistics in e, two-tailed Student’s t-test. g, Tumour growth of MC38/K262Q Pd-l1 tumour-bearing C57BL/6 mice treated as indicated. h, A schematic diagram of molecular mechanism underling nuclear translocation of PD-L1 and its contradictory functions in immune response. PD-L1 deacetylated by HDAC2 is translocated into the nucleus via interacting with various key regulatory proteins for endocytosis and nuclear translocation, then transactivates immune responsive in the nucleus to impact tumour sensitivity to PD-1 blockage (the lower left panel with yellow background), as well as controlling various immune checkpoint gene expression to possibly confer resistance to PD-1 blockage treatment (the lower right panel with gray background). Thus, HDAC2 inhibitor will reduce PD-L1 nuclear localization to prevent the emerging resistance to PD-1 blockade treatment. P values in b and f were calculated using Gehan-Breslow-Wilcoxo test, two-sided. Statistical source data are available in Statistical Source Data Extended Data Fig. 7.
Figure 1 |
Figure 1 |. PD-L1 is acetylated at the lysine 263 residue by p300.
a. Immunoblot (IB) analysis of whole-cell lysates (WCL) and anti-PD-L1 immunoprecipitates (IPs) derived from MDA-MB-231 cells. Immunoglobulin G (IgG) served as a negative control. b. IB analysis of WCL and anti-Myc IPs derived from 293T cells transfected with Myc-PD-L1 and HA-tagged p300, GCN5, PCAF, Tip60 or CBP. c. IB analysis of WCL and anti-HA IPs derived from MDA-MB-231 PD-L1 knockout (KO) cells re-introduced HA-ins-PD-L1 (HA-tag was inserted following the signal peptide) and treated with DMSO or indicated concentration of A485 for 4 hrs. d. IB analysis of WCL and anti-PD-L1 IPs derived from MDA-MB-231 cells transduced with shRNAs against p300 or shGFP as negative control. e. IB analysis of WCL and anti-PD-L1 IPs derived from MDA-MB-231 cells transduced with shRNAs against CBP or shGFP as negative control. f. In vitro acetylation assay using purified His-PD-L1 recombinant protein incubated with p300 in the presence or absence of Acetyl-CoA. g. A schematic illustration of PD-L1 protein domains and amino acid residues in the cytoplasmic domain (C-tail). SP, signal peptide; TM, transmembrane domain. h. IB analysis of WCL and anti-HA IPs derived from 293T cells transfected with Myc-p300 and HA-full length (FL) PD-L1 or the deletion mutant of C-tail (263–290 a.a.). i. IB analysis of WCL and GST pull-down products derived from 293T cells transfected with Myc-p300 and GST-C-tail PD-L1 or KR mutants. The western blots in a-f, h and i were performed for n=2 independent experiments with similar results. Unprocessed immunoblots are shown in Source Data Fig. 1.
Figure 2 |
Figure 2 |. PD-L1 is deacetylated predominantly by HDAC2.
a. IB analysis of WCL and GST pull-down products derived from 293T cells transfected with Myc-p300, GST-PD-L1 C-tail in the presence or absence of the SIRT inhibitor, 5 mM NIA, or the HDAC inhibitor, 1 μM TSA, overnight. b. IB analysis of WCL and anti-HA IPs derived from 293T cells transfected with Myc-p300, HA-ins-PD-L1 and/or indicated Flag-tagged deacetylases. c. IB analysis of WCL and anti-HA IPs derived from 293T cells transfected with indicated constructs to examine PD-L1 acetylation levels. d. IB analysis of WCL and anti-Myc IPs derived from 293T cells transfected with HA-p300, Myc-PD-L1 and/or Flag-HDAC2. e. IB analysis of WCL and anti-PD-L1 IPs derived from MDA-MB-231 cells transfected with control siRNA or siRNAs targeting indicated HDACs. f. IB analysis of WCL and anti-PD-L1 IPs derived from MDA-MB-231 cells transduced with shRNAs against HDAC2 or GFP. g. IB analysis of WCL and anti-PD-L1 IPs derived from MDA-MB-231 wild-type (WT) or HDAC2 KO cells. h. IB analysis of WCL and anti-PD-L1 IPs derived from MDA-MB-231 cells treated with the indicated HDAC inhibitors: Santacruzamate A (SCA), 20 μM; ACY1215, 40 μM; ACY957, 20 μM, for 3 hrs. i. IB analysis of WCL and anti-PD-L1 IPs derived from MDA-MB-231 WT or HDAC2 KO cells, treated with or without 50 μM HDAC2 inhibitor (HDAC2i) for 4 hrs. The western blots in a-i were performed for n=2 independent experiments with similar results. Unprocessed immunoblots are shown in Source Data Fig. 2.
Figure 3 |
Figure 3 |. Nuclear translocation of PD-L1 is regulated by K263 acetylation.
a. IB analysis of WCL, cytosol, membrane, and nuclear fractions derived from MDA-MB-231 WT or PD-L1 KO cells, purified using a Cell Signaling Technology kit. b. IB analysis of WCL, cytoplasmic, membrane, nuclear soluble, chromatin bound and cytoskeletal fractions derived from MDA-MB-231 and BT-549 cells, purified using a Thermo Scientific kit. c. Fractionation analysis for PD-L1 in BT-549 PD-L1 KO cells transfected with HA-ins-PD-L1 WT or C-tail deletion (del. C-tail) mutant. d. Immunofluorescence (IF) with anti-HA antibody and DAPI staining of MDA-MB-231 PD-L1 KO cells transduced with HA-ins-PD-L1 WT or its del. C-tail mutant lentivirus. Scale bars, 10 μm; n=2 independent experiments were performed with similar results. e. Fractionation analysis for PD-L1 in BT-549 PD-L1 KO cells transfected with the indicated constructs. f. Fractionation analysis for WT mouse PD-L1 or K262Q (corresponding to K263Q for human PD-L1) mutant from CT26 Pd-l1 KO cells. g. IB analysis of WCL, cytosol, membrane, and nuclear fractions derived from MDA-MB-231 WT or HDAC2 KO cells. h. IB analysis of WCL and anti-HA IPs derived from MDA-MB-231 PD-L1 KO cells transduced with HA-ins-PD-L1 lentivirus. Resulting cells were treated with DMSO or indicated concentration of the HDAC2 inhibitor (HDAC2i) for 4 hrs. i. Fractionation analysis for PD-L1 in MDA-MB-231 cells treated with 50 μM HDAC2 inhibitor for 6 hrs. j. Immunohistochemistry (IHC) analysis of mouse PD-L1 expression and localization in B16F10 primary tumours (subcutaneous injection) and lung metastases (tail vein injection). Scale bars, 50 μm, 20x magnification. k. Quantification of PD-L1 nuclear positive cell rates in j. Data represent the mean ± s.e.m (n=4 mice). P-value was calculated using two-tailed Student’s t-test with Welch’s correction. The western blots in a-c and e-i were performed for n=2 independent experiments with similar results. Unprocessed immunoblots are shown in Source Data Fig. 3. Statistical source data are available in Statistical Source Data Fig. 3.
Figure 4 |
Figure 4 |. PD-L1 interacts with HIP1R to engage Clathrin-dependent endocytosis.
a. Anti-Flag IPs coupled with mass spectrometry analysis to identify PD-L1 interacting proteins in 293T cells, n=2 biologically independent experiments. b. Results from mass spectrometry analysis in a were analyzed for GO term enrichment. Red stars denote pathways associated with protein translocation. n=2 independent experiments with similar results. P values were calculated using hypergeometric test. c. MDA-MB-231 cells were treated with 5 μM Pitstop or 10 μg/ml Fillipin III for 15 min, followed by fractionation analysis. d. IB analysis of WCL and anti-PD-L1 IPs derived from MDA-MB-231 cells. e. IB analysis of WCL and anti-HA IPs derived from 293T cells transfected with mouse Hip1r-GFP and HA-ins-PD-L1 WT or its del. C-tail mutant. f. IB analysis of WCL and anti-HA IPs derived from 293T cells transfected with mouse Hip1r-GFP and HA-ins-PD-L1 WT, K263R or K263Q mutants. g. Fractionation analysis for PD-L1 in MDA-MB-231 WT or HIP1R KO cells. h. IB analysis of WCL and anti-HA IPs derived from 293T cells transfected with HA-ins-PD-L1 and indicated Adaptin constructs. i. Schematic illustration of human and mouse HIP1R protein domains and candidate di-leucine sequences. j. IB of WCL and anti-Flag IPs derived from 293T cells transfected with Flag-tagged Adaptin β2 (AP2B1) and indicated di-leucine sequence deleted constructs. The western blots in c-h and j were performed for n=2 independent experiments with similar results. Unprocessed immunoblots are shown in Source Data Fig. 4.
Figure 5 |
Figure 5 |. PD-L1 nuclear translocation process requires Vimentin and Importin 1α.
a. IB analysis of WCL derived from a panel of breasts cancer cell lines with differently expressed cytoskeletal proteins. b. Fractionation analysis using a kit from Thermo Scientific™ for PD-L1 from Vimentin-low breast cancer cell lines, HCC1937 and HCC1954. c. Fractionation analysis for PD-L1 expression in Vimentin-high breast cancer cell lines, Hs578T and MDA-MB-436. d. IB analysis of WCL and anti-PD-L1 IPs derived from MDA-MB-231 cells. e. IB analysis of WCL and anti-HA IPs derived from MDA-MB-231 PD-L1 KO cells transduced with HA-ins-PD-L1 WT or its del. C-tail mutant virus. f. IB analysis of WCL and anti-HA IPs derived from 293T cells transfected with Flag-tagged Vimentin and HA-ins-PD-L1 WT or K263Q mutant constructs. g. Fractionation analysis for PD-L1 in MDA-MB-231 WT (#30) or Vimentin (VIM) KO single cell clones (#1, 10, 18, 34 and 35). h. IB analysis of WCL and anti-HA IPs derived from 293T cells transfected with HA-ins-PD-L1 and indicated Flag-tagged Importin constructs. i. IB analysis of WCL anti-HA IPs derived from 293T cells transfected with Flag-Importin α1 (IPOA1/KPNA2) and indicated HA-ins-PD-L1 WT or del. C-tail constructs. j. IB analysis of WCL anti-Flag IPs derived from 293T cells transfected with Flag-Importin α1 and indicated HA-ins-PD-L1 WT, K263R or K263Q mutant constructs. The western blots in aj were performed for n=2 independent experiments with similar results. Unprocessed immunoblots are shown in Source Data Fig. 5.
Figure 6 |
Figure 6 |. Nuclear PD-L1 regulates gene expression of immune response and regulatory pathways.
a. Top 10 enriched GO (biological process) terms of down-regulated genes (n=3,292) upon PD-L1 KO in MDA-MB-231 cells (n=4 biologically independent sequenced samples/group) analyzed by modified Fisher’s exact test with Benjamini-Hochberg correction. Immune response-related terms are marked in red. Dot size indicates the ‘Fold enrichment’. b. Down-regulated GSEA signatures upon PD-L1 KO in MDA-MB-231 cells (n=4 biologically independent sequenced samples/group). P-value was calculated using Kolmogorov-Smirnov statistic. c. Heatmap display of the interferon α genes in MDA-MB-231 WT and PD-L1 KO cells. d. qRT-PCR analysis of the indicated genes from MDA-MB-231 WT and PD-L1 KO cells. Data are shown as the mean ± s.d. of n=3 independent experiments. P-values were calculated using a two-tailed Student’s t-test. e. GSEA signatures of ‘Interferon α response’ upon re-expressing mouse WT or K262Q mutant Pd-l1 in Pd-l1 KO CT26 cells (n=3 biologically independent sequenced samples/group), analyzed using Kolmogorov-Smirnov statistic. f. Genomic distribution of HA-tag ChIP-seq peaks in MDA-MB-231 PD-L1 KO cells expressing HA-tagged-PD-L1. g. PD-L1 ChIP-sequencing signal height and position relative to transcription start sites (TSS) for all genes in MDA-MB-231 cells. Two replicates are shown. The line means the average profile of genes; while the shading indicates standard errors (s.e.) of all human hg38 genes (n=58,713). h. ChIP-sequencing density heatmap of PD-L1 enrichment in MDA-MB-231 cells, within 5 kb around TSS. Gene order was arranged from highest to lowest density. i. A pie-chart depicting the fraction of genes with PD-L1 peaks among up-regulated, down-regulated or no change genes upon PD-L1 KO in MDA-MB-231 cells. The exact numbers of genes, percentage and P-values (hypergeometric test) in each group are shown. j. Rank-ordered depiction of the Log2 fold change for each significantly changed gene upon PD-L1 KO. The 5775 genes that have PD-L1 binding peaks are depicted in red. Grey dots indicate genes that have no PD-L1 binding. k. Top enriched motifs in the PD-L1 binding sites (n=50,738) in MDA-MB-231 cells. P-value was calculated using hypergeometric distributions. Statistical source data are available in Statistical Source Data Fig. 6.
Figure 7 |
Figure 7 |. Nuclear PD-L1 regulates gene expression of immune response and regulatory pathways to impact the efficacy of anti-PD-1 immunotherapy.
a. Scatter plot of the transcriptome of MDA-MB-231 cells upon PD-L1 KO. b. qRT-PCR analysis of the indicated genes from MDA-MB-231 WT or PD-L1 KO cells. Data are shown as the mean ± s.d. of n=3 independent experiments. c. qRT-PCR analysis of the indicated genes from MDA-MB-231 cells transfected with control siRNA or PD-L1 siRNAs. Data are shown as the mean ± s.d. of n=3 independent experiments. d. IB analysis of WCL derived from WT or PD-L1 KO MDA-MB-231 and BT-549 cells. The western blots were performed for n=2 independent experiments with similar results. e. Volumes of MC38 syngeneic tumours treated with control antibody (black lines, n=15), anti-PD-1 mAb (blue lines; n=15), the HDAC2 inhibitor Santacruzamate A (orange lines; n=12) or combined therapy (green lines; n=14) were plotted individually. f. Kaplan-Meier survival curves for each treatment group (Control, n=15; PD-1 mAb, n=15; HDAC2i, n=12; combined, n=14). P value was calculated using Gehan-Breslow-Wilcoxo test, two sided. g. Representative dot plots of CD4+ and CD8+ TILs in MC38 syngeneic tumours. h. Proportions of CD8+, CD8+Gran B+, CD4+ and CD4+FOXP3+ T cells out of CD45+CD3+ TILs in MC38 syngeneic tumours treated with control antibody (n=6), anti-PD-1 mAb (n=8), HDAC2 inhibitor (n=6) or combined therapy (n=8). i. The CD8+ T cells to Treg (CD4+FOXP3+) ratio in the treated MC38 tumours from g was calculated. j. TILs from treated MC38 tumours from h were incubated with cell stimulation cocktail for 4 hours, and expression levels (MFI) of TNF-α were examined. k. Survival curves of MC38/K262Q Pd-l1 tumour-bearing C57BL/6 mice treated as indicated. P value was calculated using Gehan-Breslow-Wilcoxo test, two sided. The P-values in b, c and h-j were calculated using a two-tailed Student’s t-test. Each circle in h-j represents a single tumour, shown with the mean value of each group. Unprocessed immunoblots are shown in Source Data Fig. 7. Statistical source data are available in Statistical Source Data Fig. 7.

Comment in

  • The hidden side of PD-L1.
    Jaccard A, Ho PC. Jaccard A, et al. Nat Cell Biol. 2020 Sep;22(9):1031-1032. doi: 10.1038/s41556-020-0568-y. Nat Cell Biol. 2020. PMID: 32839550 No abstract available.

References

    1. Chen DS & Mellman I Elements of cancer immunity and the cancer-immune set point. Nature 541, 321–330 (2017). - PubMed
    1. Baumeister SH, Freeman GJ, Dranoff G & Sharpe AH Coinhibitory Pathways in Immunotherapy for Cancer. Annu Rev Immunol 34, 539–573 (2016). - PubMed
    1. Ribas A & Wolchok JD Cancer immunotherapy using checkpoint blockade. Science 359, 1350–1355 (2018). - PMC - PubMed
    1. Sharma P, Hu-Lieskovan S, Wargo JA & Ribas A Primary, Adaptive, and Acquired Resistance to Cancer Immunotherapy. Cell 168, 707–723 (2017). - PMC - PubMed
    1. Restifo NP, Smyth MJ & Snyder A Acquired resistance to immunotherapy and future challenges. Nat Rev Cancer 16, 121–126 (2016). - PMC - PubMed

Publication types