Clinical Trial
. 2020 Nov;30(11):966-979.
doi: 10.1038/s41422-020-00395-4. Epub 2020 Aug 24.

Manganese is critical for antitumor immune responses via cGAS-STING and improves the efficacy of clinical immunotherapy

Affiliations
Clinical Trial

Manganese is critical for antitumor immune responses via cGAS-STING and improves the efficacy of clinical immunotherapy

Mengze Lv et al. Cell Res. 2020 Nov.

Abstract

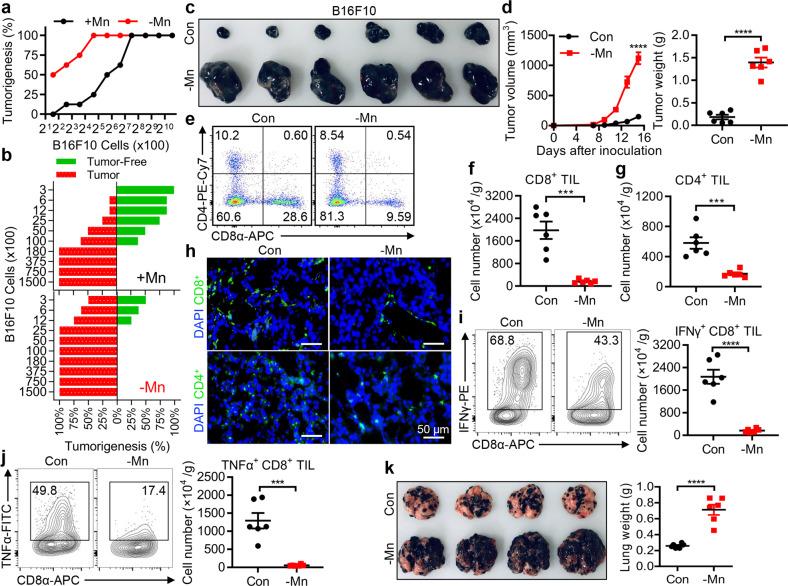
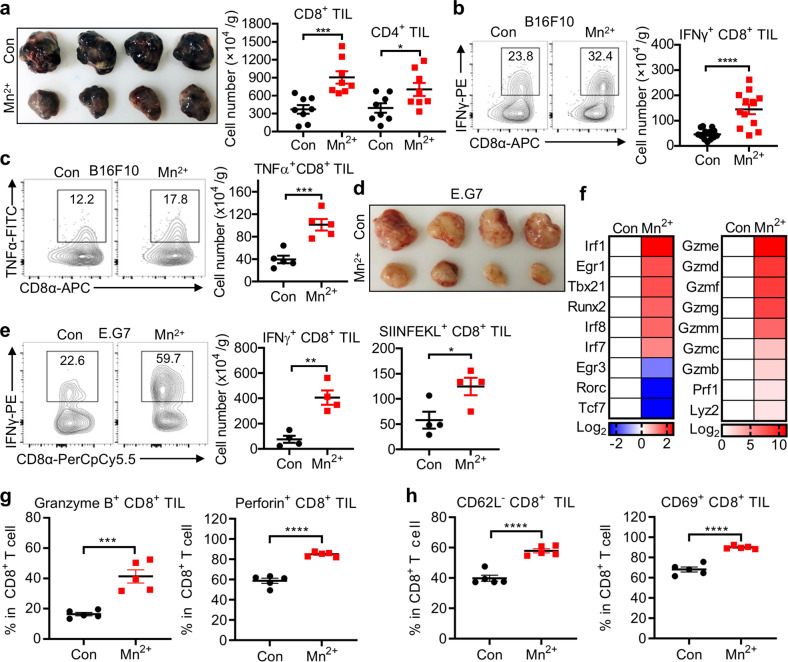
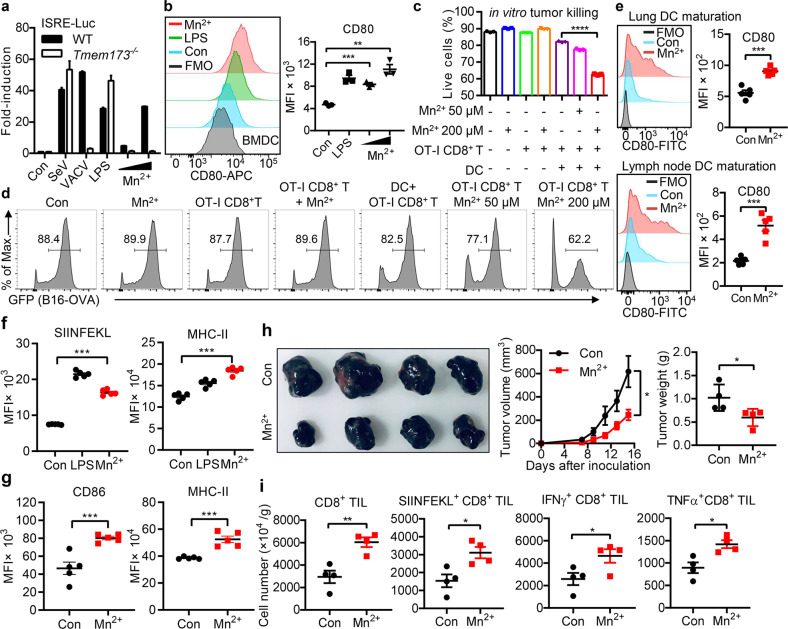
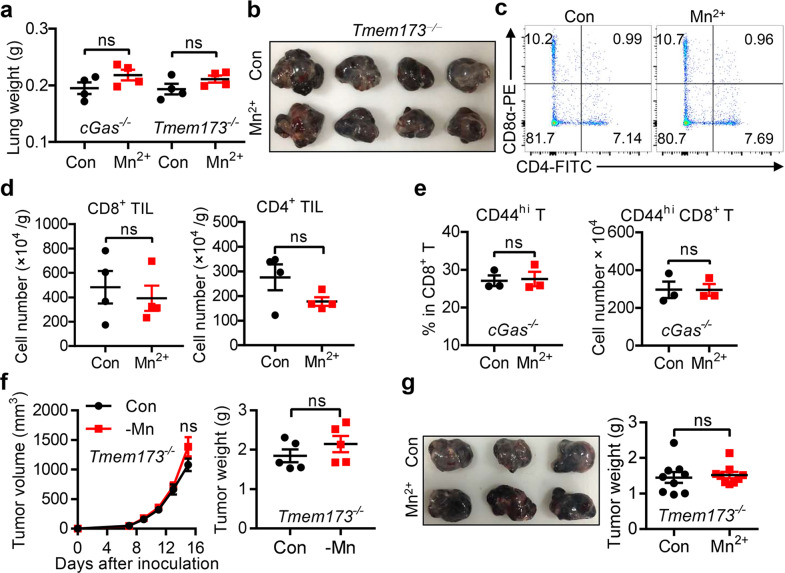
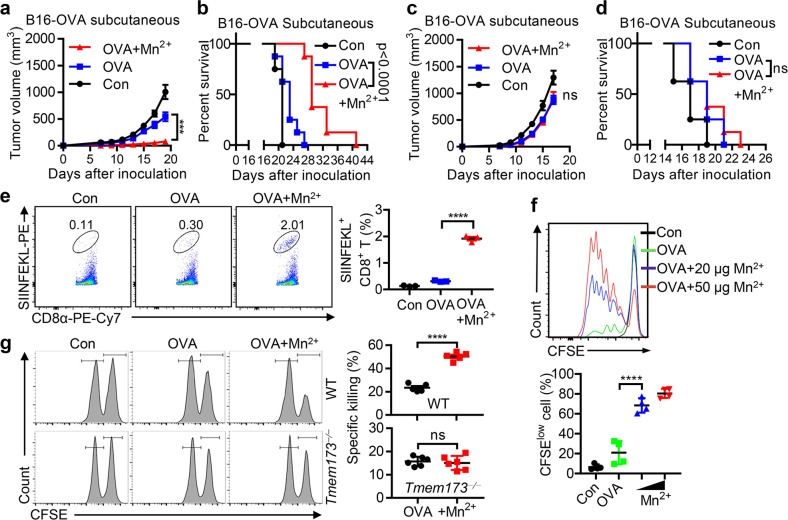
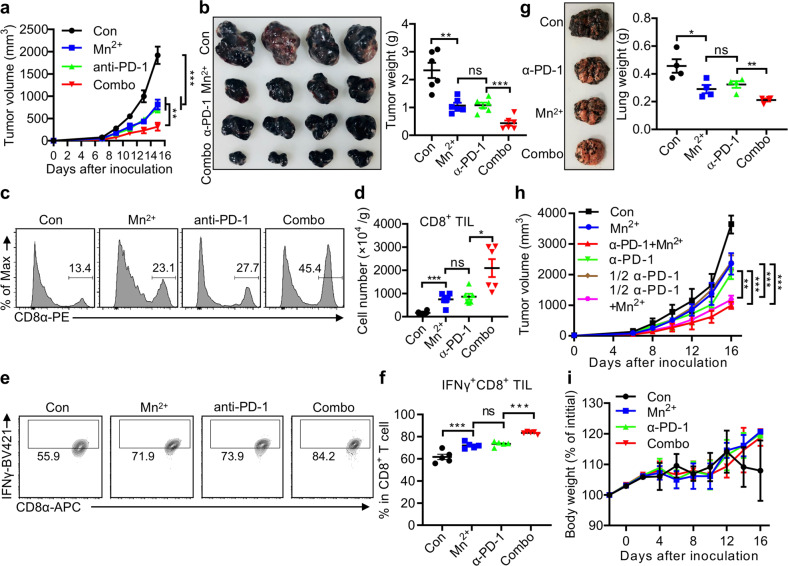
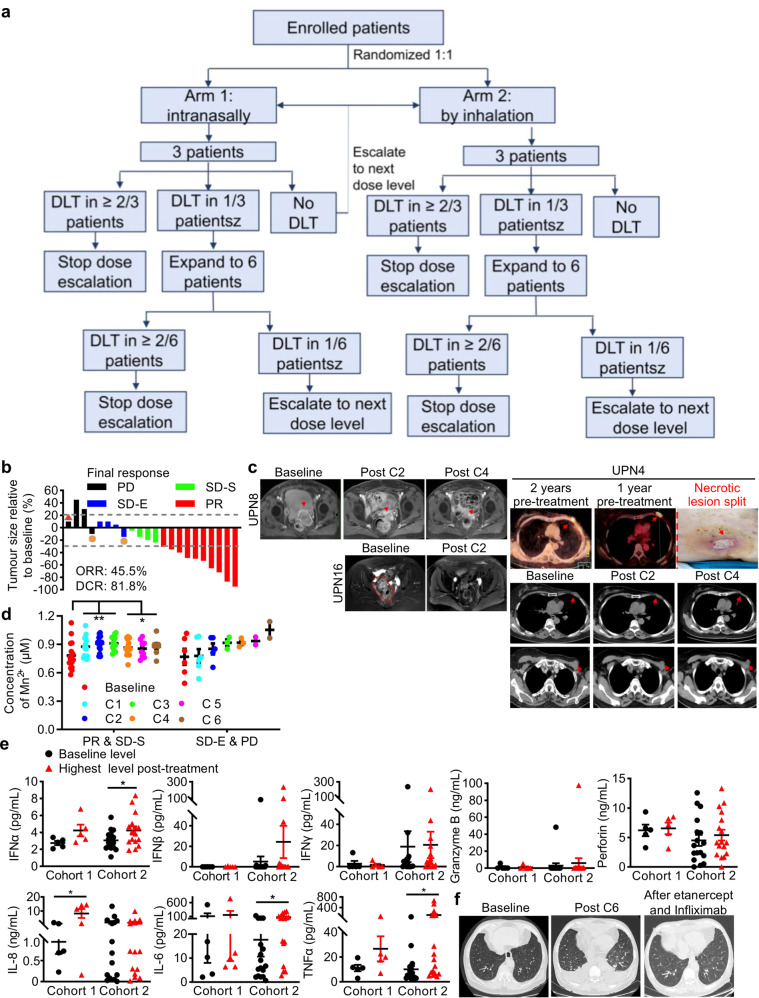
CD8+ T cell-mediated cancer clearance is often suppressed by the interaction between inhibitory molecules like PD-1 and PD-L1, an interaction acts like brakes to prevent T cell overreaction under normal conditions but is exploited by tumor cells to escape the immune surveillance. Immune checkpoint inhibitors have revolutionized cancer therapeutics by removing such brakes. Unfortunately, only a minority of cancer patients respond to immunotherapies presumably due to inadequate immunity. Antitumor immunity depends on the activation of the cGAS-STING pathway, as STING-deficient mice fail to stimulate tumor-infiltrating dendritic cells (DCs) to activate CD8+ T cells. STING agonists also enhance natural killer (NK) cells to mediate the clearance of CD8+ T cell-resistant tumors. Therefore STING agonists have been intensively sought after. We previously discovered that manganese (Mn) is indispensable for the host defense against cytosolic dsDNA by activating cGAS-STING. Here we report that Mn is also essential in innate immune sensing of tumors and enhances adaptive immune responses against tumors. Mn-insufficient mice had significantly enhanced tumor growth and metastasis, with greatly reduced tumor-infiltrating CD8+ T cells. Mechanically, Mn2+ promoted DC and macrophage maturation and tumor-specific antigen presentation, augmented CD8+ T cell differentiation, activation and NK cell activation, and increased memory CD8+ T cells. Combining Mn2+ with immune checkpoint inhibition synergistically boosted antitumor efficacies and reduced the anti-PD-1 antibody dosage required in mice. Importantly, a completed phase 1 clinical trial with the combined regimen of Mn2+ and anti-PD-1 antibody showed promising efficacy, exhibiting type I IFN induction, manageable safety and revived responses to immunotherapy in most patients with advanced metastatic solid tumors. We propose that this combination strategy warrants further clinical translation.


Conflict of interest statement

The authors declare no competing interests.

Figures

Fig. 1
Fig. 1. Mn is essential for immune responses against tumors.
a, b Wild-type (WT) Mn-insufficient (–Mn) and control (+Mn) mice were inoculated with the indicated numbers of B16F10 cells subcutaneously (n = 8). Tumorigenesis was monitored every other day for 90 days (a). Tumor volume above 50 mm3 was defined as tumorigenesis, tumor volume below 50 mm3 after 90 days was recorded as tumor-free (b). c, d Representative images of tumors (c), tumor sizes and tumor weights (d) in WT control (Con) and Mn-insufficient mice (–Mn) (n = 6 per group) after subcutaneous (s.c.) inoculation of 1 × 105 B16F10 cells. e Representative FACS data of the frequency of tumor infiltrating CD8+ T cells of mice as in (c). f, g Quantification of tumor infiltrating CD8+ T cells (f) or CD4+ T cells (g) of the mice as in (a). h B16F10 tumors from (c) were stained with anti-CD8-FITC or anti-CD4-FITC and counterstained with DAPI. Scale bar, 50 μm. i, j Representative FACS data and quantification of tumor infiltrating IFNγ+CD8+ T cells (i) and TNFα+CD8+ T cells (j) of mice as in (c). k Representative images (left) and quantification of lung weights (right) in control (Con) and Mn-insufficient mice (–Mn) (n = 6 per group) at day 21 after intravenous (i.v.) injection of 1 × 105 B16F10 cells. Data represent analyses of the indicated n mice per group, means ± SEM. Data are representative of three independent experiments. ***P < 0.001; ****P < 0.0001.
Fig. 2
Fig. 2. Mn2+ stimulates CD8+ T cell and NK cell activation.
a Representative image of tumors in the WT mice (n = 8 per group) treated with saline or 5 mg/kg MnCl2 intranasally (i.n.) at day 14 after subcutaneous inoculation of 5 × 105 B16F10 cells (left) and quantification of tumor infiltrating CD8+ T cells or CD4+ T cells (right). b, c Representative FACS data of frequency (left) and quantification (right) of tumor infiltrating IFNγ+CD8+ T cells (b, n = 13 per group) or TNFα+CD8+ T cells (c, n = 5 per group) in the WT mice treated with saline or 5 mg/kg MnCl2 i.n. at day 15 after subcutaneous inoculation of 5 × 105 B16F10 cells. d, e Images of tumors (d), representative FACS data of frequency (e, left) and quantification (e, right) of tumor infiltrating IFNγ+CD8+ T or SIINFEKL+CD8+ T cells in the WT mice treated with saline or 5 mg/kg MnCl2 i.n. at day 17 after subcutaneous inoculation of 1 × 106 E.G7 cells (n = 4 per group). f Heatmap of selected genes between CD8+ TILs from the control and Mn2+-treated (i.n.) WT mice. Heatmap was made by calculating log2((Mn2+ FPKM)/(Con FPKM)) and values of genes in the control group were normalized to zero. g, h Quantification of tumor infiltrating Granzyme B+CD8+ and Perforin+CD8+ T cells (g, n = 5 per group) or CD62LCD8+ and CD69+CD8+T cells (h, n = 5 per group) in the WT mice treated with saline or 5 mg/kg MnCl2 i.n. at day 16 after subcutaneous inoculation of 2 × 105 B16F10 cells. Data represent analyses of the indicated n mice per group, means ± SEM. Data are representative of three independent experiments. *P < 0.05; **P < 0.01; ***P < 0.001; ****P < 0.0001.
Fig. 3
Fig. 3. Mn2+ promotes DC maturation and antigen presentation.
a Type I IFN activity in culture media from the WT or Tmem173−⁄− BMDCs treated with SeV, VACV, LPS or the indicated concentrations (200 μM and 400 μM) of MnCl2 for 18 h. b Mean fluorescent intensity (MFI) of CD80 in BMDCs treated with LPS (10 ng/mL) or the indicated concentrations (200 μM and 400 μM) of MnCl2 for 18 h. FMO: Flow Minus One of CD80. c, d CD8+ T cells isolated from spleen of OT-I mice (6–8 weeks old) were mixed with BMDCs at 2:1 ratio and incubated with B16F10-OVA-GFP cells with or without the indicated concentrations of MnCl2 for 24 h. Viability of tumor cells were analyzed by flow cytometry (FACS). e MFI of CD80 in lung DCs (top, MnCl2 i.n.) or inguinal lymph node DCs (bottom, MnCl2 s.c.) from mice (n = 5 per group) treated with 5 mg/kg MnCl2 for 18 h. f B16F10-OVA cells were co-cultured with BMDCs under indicated treatment for 18 h. Expression of the OVA peptide SIINFEKL–MHC-I molecule complex and co-stimulatory molecule MHC-II on the surface of BMDCs was analyzed by FACS. g WT mice were subcutaneously inoculated with 2 × 105 B16F10 cells and treated with saline or 5 mg/kg MnCl2 i.p. Mice (n = 5 per group) were sacrificed on day 16 and tumors were dissected for FACS analysis. The expression of CD86 and MHC-II on tumor-infiltrating DCs was quantified. h Representative images (left) and quantification (right) of tumor sizes and tumor weights in WT mice (n = 4 per group) treated with MnCl2 i.n. and then inoculated with B16F10 s.c. at day 5 and sacrificed at day 20. Experimental protocol was described in Supplementary information, Fig. S4e. i Summary data of CD8+ TILs, SIINFEKL+CD8+ TILs, IFNγ+CD8+ TILs and TNFα+CD8+ TILs in tumors from mice in (h). Data represent analyses of the indicated n mice per group, means ± SEM. Data are representative of three independent experiments. *P < 0.05; **P < 0.01; ***P < 0.001; ****P < 0.0001.
Fig. 4
Fig. 4. The cGAS-STING pathway is required for Mn2+-mediated antitumor immune responses.
a Quantification of lung weights from cGas−⁄− mice (top) or Tmem173−⁄− mice (bottom) with saline or 5 mg/kg MnCl2 (i.n., n = 4 per group) at day 14 after intravenous injection of 2 × 105 B16F10 cells. b Images of tumors in Tmem173−⁄− mice (n = 4 per group) treated with saline or 5 mg/kg MnCl2 i.n. at day 14 after subcutaneous inoculation of 5 × 105 B16F10 cells. c, d Representative FACS data (c) and quantification of tumor infiltrating CD8+ T cells or CD4+ T cells (d) from Tmem173−⁄− mice as in b. e Experimental protocol was described in Supplementary information, Fig. S3e: cGas−⁄− mice (n = 3 per group) were given 5 mg/kg MnCl2 i.p. at the indicated times and sacrificed at day 9. Frequency (left) and cell number (right) of CD44hiCD8+ T from splenic cells in cGas−⁄− mice. f Tumor sizes and tumor weights in Tmem173−⁄− control (Con) and Mn-insufficient mice (–Mn) (n = 5 per group) after subcutaneous inoculation of 5 × 105 B16F10 cells. g Images of tumors (left), tumor weights (right) in Tmem173−⁄− mice (n = 9 per group) treated with saline or 5 mg/kg MnCl2 i.n. at day 14 after subcutaneous inoculation of 5 × 105 B16F10 cells. Data represent analyses of the indicated n mice per group, means ± SEM. Data are representative of three independent experiments. ns, not significant, P > 0.05.
Fig. 5
Fig. 5. Mn2+ shows adjuvant effects on antitumor vaccines.
a, b Tumor sizes in the WT mice (n = 8 per group) pre-immunized with PBS, OVA or OVA plus MnCl2 intramuscularly (i.m.) on day 0, 7 or 14, before 5 × 105 B16F0-OVA subcutaneous inoculation on day 21 (a). The survival of mice was monitored (b). c, d Tumor sizes in Tmem173−⁄− mice (n = 8 per group) pre-immunized with PBS, OVA or OVA plus MnCl2 i.m. on day 0, 7 or 14, before 5 × 105 B16F0-OVA subcutaneous inoculation on day 21 (c). The survival of mice was monitored (d). e Representative figures and summary data of frequency of SIINFEKL+CD8+ T cells in the spleen of immunized (PBS, OVA or OVA plus MnCl2 i.m. on day 0, 7 or 14) mice on day 21. f CD8+ T cell proliferation in inguinal lymph nodes from recipient mice at day 3 after immunization with PBS, OVA or OVA plus MnCl2 s.c. (n = 4 per group). g In vivo CTL assay in WT (top panel) or Tmem173−⁄− mice (bottom panel) 21 d after i.m. (day 0, 7, 14) with OVA (100 μg) with or without MnCl2 (20 μg) (n = 5 per genotype). Data represent analyses of the indicated n mice per group, means ± SEM. Data are representative of three independent experiments. ns, not significant, P > 0.05; *** P < 0.001; **** P < 0.0001.
Fig. 6
Fig. 6. Mn2+ boosts antitumor immunotherapy in mice.
a Tumor sizes of subcutaneous B16F10 implants in mice treated with the isotype antibody (200 μg/mouse i.p.), MnCl2 (5 mg/kg i.n.), anti-PD-1 antibody (200 μg/mouse i.p.) or MnCl2 plus anti-PD-1 antibody (n = 6 per group. Combo, combined treatment with MnCl2 and anti-PD-1 antibody). b Representative image (left), tumor weights (right) of subcutaneous B16F10 implants in mice as in a. c, d Representative FACS figures (c) and quantification (d) of tumor infiltrating CD8+ T cells of mice as in a. e, f Representative FACS figures (e) and quantification (f) of IFNγ+CD8+ TILs of mice as in a. g Representative image (left) and quantification (right) of tumor nodules and lung weights of saline or 5 mg/kg MnCl2 treated mice (i.n., n = 4 per group) at day 15 after intravenous injection of 2 × 105 B16F10 cells. h Tumor sizes of subcutaneous B16F10 implants in mice treated with isotype antibody (200 μg/mouse i.p.), MnCl2 (5 mg/kg i.p.), anti-PD-1 (200 μg/mouse i.p.), 1/2 anti-PD-1 (100 μg/mouse i.p.), or 1/2 anti-PD-1 plus MnCl2 (n = 5 per group). i Body weight changes were followed for 16 days after subcutaneous B16F10 implants in mice treated with MnCl2 (5 mg/kg i.p.), anti-PD-1 antibody (200 μg/mouse i.p.), or MnCl2 plus anti-PD-1 antibody (n = 5 per group). Data represent analyses of the indicated n mice per group, means ± SEM. Data from cells and mice are representative of three independent experiments. ns, not significant, P > 0.05; *P < 0.05; **P < 0.01; ***P < 0.001.
Fig. 7
Fig. 7. Mn2+ augments/revives antitumor immunotherapy in multidrug (immuno)-resistant cancer patients.
a The graphical abstract of clinical trial design. b The best percentage change from baseline in the longest diameters of target lesions. Dashed lines indicated the thresholds regarding progressive disease and partial response per the Response Evaluation Criteria in Solid Tumors (RECIST) v1.1. c Representative cases were shown. Patient UPN4 with refractory metastatic breast cancer achieved PR and experienced necrotic lesion splitting away off chest wall after four cycles of the combined therapy. Two patients with platinum-resistant metastatic ovarian cancer achieved PR and impressive partial remission of frozen pelvis following the administration of Mn2+. d The levels of blood Mn concentration following n = C1–C6 cycles of therapy in patients grouped by clinical response. e The baseline and highest post-treatment expression level of serum cytokines and effector proteins of patients grouped according to the blood Mn concentration. Cohort 1 included the patients with SD-E and PD; cohort 2 included patients achieving PR and SD-S. f Patient UPN1 with refractory colorectal cancer developed acute CRS accompanying hypoxemia resulted from pleural effusion and pulmonary edema, which was resolved by anti-TNFα/TNFαR antibody therapy. DLT, dose limiting toxicity; PR, partial response; SD-S, stable disease with decrease lesion; SD-E, stable disease with enlarged lesion; PD, progressive disease. P values were calculated using paired t-test (SPSS 26). Data represent means ± SEM; *P < 0.05; **P < 0.01.

Comment in

References

    1. Ishida Y, Agata Y, Shibahara K, Honjo T. Induced expression of PD-1, a novel member of the immunoglobulin gene superfamily, upon programmed cell death. EMBO J. 1992;11:3887–3895. - PMC - PubMed
    1. Ahmadzadeh M, et al. Tumor antigen-specific CD8 T cells infiltrating the tumor express high levels of PD-1 and are functionally impaired. Blood. 2009;114:1537–1544. - PMC - PubMed
    1. Freeman GJ, et al. Engagement of the PD-1 immunoinhibitory receptor by a novel B7 family member leads to negative regulation of lymphocyte activation. J. Exp. Med. 2000;192:1027–1034. - PMC - PubMed
    1. Boussiotis VA. Molecular and biochemical aspects of the PD-1 checkpoint pathway. N. Engl. J. Med. 2016;375:1767–1778. - PMC - PubMed
    1. Topalian SL, Drake CG, Pardoll DM. Immune checkpoint blockade: a common denominator approach to cancer therapy. Cancer Cell. 2015;27:450–461. - PMC - PubMed

Publication types

MeSH terms