. 2021 Feb;39(2):225-235.
doi: 10.1038/s41587-020-0643-8. Epub 2020 Aug 24.

Direct DNA crosslinking with CAP-C uncovers transcription-dependent chromatin organization at high resolution

Affiliations

Direct DNA crosslinking with CAP-C uncovers transcription-dependent chromatin organization at high resolution

Qiancheng You et al. Nat Biotechnol. 2021 Feb.

Abstract

Determining the spatial organization of chromatin in cells mainly relies on crosslinking-based chromosome conformation capture techniques, but resolution and signal-to-noise ratio of these approaches is limited by interference from DNA-bound proteins. Here we introduce chemical-crosslinking assisted proximity capture (CAP-C), a method that uses multifunctional chemical crosslinkers with defined sizes to capture chromatin contacts. CAP-C generates chromatin contact maps at subkilobase (sub-kb) resolution with low background noise. We applied CAP-C to formaldehyde prefixed mouse embryonic stem cells (mESCs) and investigated loop domains (median size of 200 kb) and nonloop domains (median size of 9 kb). Transcription inhibition caused a greater loss of contacts in nonloop domains than loop domains. We uncovered conserved, transcription-state-dependent chromatin compartmentalization at high resolution that is shared from Drosophila to human, and a transcription-initiation-dependent nuclear subcompartment that brings multiple nonloop domains in close proximity. We also showed that CAP-C could be used to detect native chromatin conformation without formaldehyde prefixing.


Conflict of interest statement

Competing interests

C.H. is a scientific founder and a member of the scientific advisory board of Accent Therapeutics, Inc. and a shareholder of Epican Genetech. B.R. is a co-founder and a member of the scienceitific advisory board of Arima Genomics Inc.

Figures

Fig. 1 |
Fig. 1 |. CAP-C resolves high-resolution local chromatin structure.
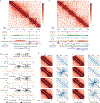
a, Scheme of CAP-C. b, Contact maps at various resolutions (upper panel, CAP-C; bottom panel, in situ Hi-C). HiCRep analysis on contact maps obtained by the two methods at various resolutions (500 kb, HiCRep = 0.966; 50 kb, HiCRep = 0.931; 5 kb, HiCRep = 0.977 and 2 kb, HiCRep = 0.857). Chromatin features resolved at each resolution are shown as a track aligned below each contact map. Compartment A is labeled as green box while compartment B is labeled in orange. TADs are shown as black bars. Contact domains are labeled as blue bars. Loop domains are shown as red bars. c, CAP-C (top) and in situ Hi-C (bottom) contact matrices at 500 bp resolution for Chr4, 129.58–129.65 mb. Histone modifications and ChIP profiles are aligned in the middle. Three domains are detected (black bar) in CAP-C, enveloping Eif3i, Tmem234 and Txlna, respectively. No domains are detected for in situ Hi-C at this resolution. d, Relative contact frequency versus genomic distance curves of CAP-C and in situ Hi-C. The enlarged inset window shows approximately six- to eightfold contact enrichment for CAP-C over in situ Hi-C. G3, G5, G7 represent CAP-C performed with psoralen-functionalized PAMAM dendrimer generation 3, 5 and 7 (with diameters of 3.6, 5.4 and 8.1 nm), respectively. CAP-C merge represents merging of data generated from G3, G5 and G7. e, CAP-C identifies more small-sized domains than in situ Hi-C and the identified domain boundaries correlate well with active histone marks, CTCF and cohesin binding sites. Domains were called by Arrowhead alogrithm (see Methods) and classified into ten groups based on their sizes. f, CAP-C identifies more loops, and the identified loops correlate well with active histone marks, CTCF and cohesin, genome-wide. Loops were called by HiCCUPS and classified into ten groups based on their genomic spans.
Fig. 2 |
Fig. 2 |. CAP-C identifies loop and nonloop domains as two distinct types of chromatin domains.
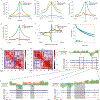
a, Meta-contact map showing intradomain interactions, pie chart showing the frequency of CTCF motif orientations and pie charts showing the fraction of domains and percentage of genome covered by compartments A and B within the loop and nonloop domains. b, Plot of the distribution of domain sizes for nonloop and loop domains. c, Plot of the distribution of the number of protein-coding genes found in nonloop versus loop domains. d, Domains were segregated into left boundaries, domain bodies and right boundaries. The distribution of indicated ChIP–seq signals around left boundaries, domain bodies and right boundaries of nonloop domains (shown as dotted lines) and loop domains (shown as solid lines) are aligned below. Heatmap displaying the reads density distribution of indicated ChIP–seq signals in nonloop and loop domains. Each row represents a domain. e, A logistic regression model was trained using either individual features or all seven features (combined model) to discriminate between loop domains (negative set) and nonloop domains (positive set). The receiver operating characteristic curve is plotted for each regression model. f, A linear regression was performed between domain sizes and transcription rates. Spearman’s correlation coefficient = −0.29 for nonloop domains; −0.20 for loop domains. g,h, Metagene plots of ChIP–seq data for CTCF (g) and RAD21 (h) were centered around a ±1 kb region for mESCs with different perturbations: WT, inhibition of transcription elongation (+Flavopiridol), acute depletion of CTCF (+Auxin), combined acute depletion of CTCF and inhibition of transcription elongation (+Flavopiridol +Auxin). i, Meta-domain analyses showing differential domain contacts. Domains were classified into two main types: loop domain (LD) and nonloop domain (nLD). Each type was further divided into two groups based on their presence in A or B compartments.
Fig. 3 |
Fig. 3 |. Active promoters are involved in chromatin boundary formation.
a,b, Genes were segregated into different contact domains with active promoters on the boundary. Two examples of CAP-C contact matrices (at 1 kb resolution) are shown corresponding to Chr18, 6.42–6.53 mb (a) and Chr13, 40.85–40.96 mb (b). The black line depicts the domains called by Arrowhead. Directionality index (DI), histone modifications and ChIP–seq peaks are shown below each matrix. Epc1 and Gcnt2 are insulated by their active promoters, respectively. c, Genes with alternative promoters were selected and classified into four different types based on the transcription state of their first and second promoters. Numbers of each type are shown inside the corresponding brackets. Directionality index values around each promoter are shown below. d, Interaction counts and the log2 ratio of observed interactions divided by expected interactions for a given genomic distance are shown side by side for each type.
Fig. 4 |
Fig. 4 |. Induction of transcription on nonannotated TSS by DNMTi results in the formation of weak chromatin boundaries and compartment changes.
ad, DNMTi treatment caused formation of weak chromatin boundaries on newly activated TSS loci in HCT116 cells. Induced loci (H3K4me3-induce) were identified based on log2FC of H3K4me3 greater than 1.5-fold than WT. The originally active loci, marked with H3K4me3 ChIP–seq peaks in WT (H3K4me3-WT), were selected as positive controls. Metagene plots of ChIP–seq data for Pol II-S5P (a); H3K4me3 (b); CTCF (c) and SMC3 (d) were centered ±2.5 kb around these loci. e, Directionality index (DI) values were calculated ±100 kb around these loci. f, Autocorrelation between compartment changes and distance was plotted. g,h, DNMTi caused compartment changes in HCT116 cells. The Pearson correlation was plotted for chr22, 16.0–51.3 mb in WT (g) or induced HCT116 cells (h). Regions with compartment changes are highlighted with a black box. i, Compartment changes caused from the B to A transition after DNMTi treatment. Compartment eigenvectors were computed for both WT (marked in green) and induction (marked in orange). Regions with positive eigenvalues represent compartment A, and negative eigenvalues represent compartment B. Pol II-S5P and H3K4me3 ChIP–seq peaks are aligned at bottom for the WT and induction samples. Compartment transition regions are highlighted with a black box. j, Enlarged views of two black boxes highlighting regions with compartment transitions usually coupled with Pol II-S5P ChIP–seq peaks.
Fig. 5 |
Fig. 5 |. CAP-C identifies conserved small-scale chromatin compartmentalization shared among species.
a, SVD was performed on an m rows by n columns data matrix (where m is the number of dendrimer experiments, and n is the number of loci bins across a specified region and resolution) of relative contact frequencies. The eigenvector with the highest eigenvalue yields a ‘dendrimer map’ that shows bifurcated separation (see Methods). A separate SVD analysis on the row sums of a contact matrix yields CAP-C eigenvector (see Methods). Compartment eigenvectors derived from CAP-C and in situ Hi-C are aligned below. Projection onto the selected eigenvector showing G5 and G7 dendrimer experiments enriched for open configurations, while the G3 dendrimer experiment enriched for closed configurations. bd, Close-up of the ‘dendrimer map’ showing fine level of compartment detail for mESC at chr5, 72.0–73.5 mb (b); HepG2 at chr3, 56.7–58.7 mb (c) and Drosophila S2 at chr2L, 21.55–22.25 mb (d). CAP-C eigenvector, compartment eigenvector and indicated ChIP–seq profiles are aligned below each dendrimer map. The species icons were produced using Servier Medical Art by Servier (https://smart.servier.com) and modified under a Creative Commons Attribution 3.0 Unported License (https://creativecommons.org/licenses/by/3.0/).
Fig. 6 |
Fig. 6 |. TICs as a type of nuclear subcompartment.
ac, TICs displayed enhanced interactions after transcription elongation inhibition; each TIC brings two or more active genes together in close proximity. Three of the largest TICs are represented along with their characteristic features. Connected components (genes) are listed for each TIC: Cluster 1 (Pole, Ep400, Golga3, Pgam5, Noc4l, Pxmp2, P2rx2, Mir7026) (a); Cluster 2 (Gigyf2, Sag, Kcnj13, Inpp5f, Atg16l1, Usp40, 3110079O15Rik, Dgkd) (b) and Cluster 3 (Setd5, Fancd2, Tatdn2, Emc3, Thumpd3, Fancd2os, Sec13) (c). Each example is visually represented by a depth-normalized contact map annotated with detected regions (black arrowhead) showing increased interactions between flavopiridol-treated and WT, nonloop domains (marked as green) and loop domains (marked as blue). Differences between flavopiridol-treated and WT heatmaps highlight increased interactions (in red) within detected regions. Pol II-S5P ChIP–seq peaks and Pol II-S5P mediated interactions (loops) are aligned below. d, Upper panel, pie chart showing the proportion of TICs that span protein-coding regions. Bottom panel, pie chart showing the proportion of TICs that span nonloop domains. e, Distribution of the number of gene members per TIC (median, 2 and maximum 7). f, Cumulative density function of genes ranked by reads per million of bulk RNA-seq (TIC median, 81th percentile; random median, 50th percentile). g, Normalized CAP-C interactions per bin at TIC under each treatment (WT, +Auxin/+Flavopiridol, +Flavopiridol only). h, Pol II-S5P ChIP–seq levels at TICs under each treatment. i, Pol II-S5P-mediated loops (PLAC-seq) under each treatment. Boxes in gi indicate the median and interquartile ranges, with whiskers indicating 1.5× the interquartile range. P values were calculated using two-sided Kolmogorov–Smirnov test (no adjustments made for multiple testing).

References

    1. Sexton T & Cavalli G The role of chromosome domains in shaping the functional genome. Cell. 160, 1049–1059 (2015). - PubMed
    1. Pombo A & Dillon N Three-dimensional genome architecture: players and mechanisms. Nat. Rev. Mol. Cell Biol 16, 245–257 (2015). - PubMed
    1. Vian L et al. The energetics and physiological impact of cohesin extrusion. Cell 173, 1165–1178. e1120 (2018). - PMC - PubMed
    1. Dekker J, Rippe K, Dekker M & Kleckner N Capturing chromosome conformation. Science 295, 1306–1311 (2002). - PubMed
    1. Zhao Z et al. Circular chromosome conformation capture (4C) uncovers extensive networks of epigenetically regulated intra- and interchromosomal interactions. Nat. Genet 38, 1341–1347 (2006). - PubMed

Publication types

MeSH terms