. 2020 Oct;2(10):1034-1045.
doi: 10.1038/s42255-020-0261-2. Epub 2020 Aug 24.

Fructose stimulated de novo lipogenesis is promoted by inflammation

Affiliations

Fructose stimulated de novo lipogenesis is promoted by inflammation

Jelena Todoric et al. Nat Metab. 2020 Oct.

Abstract

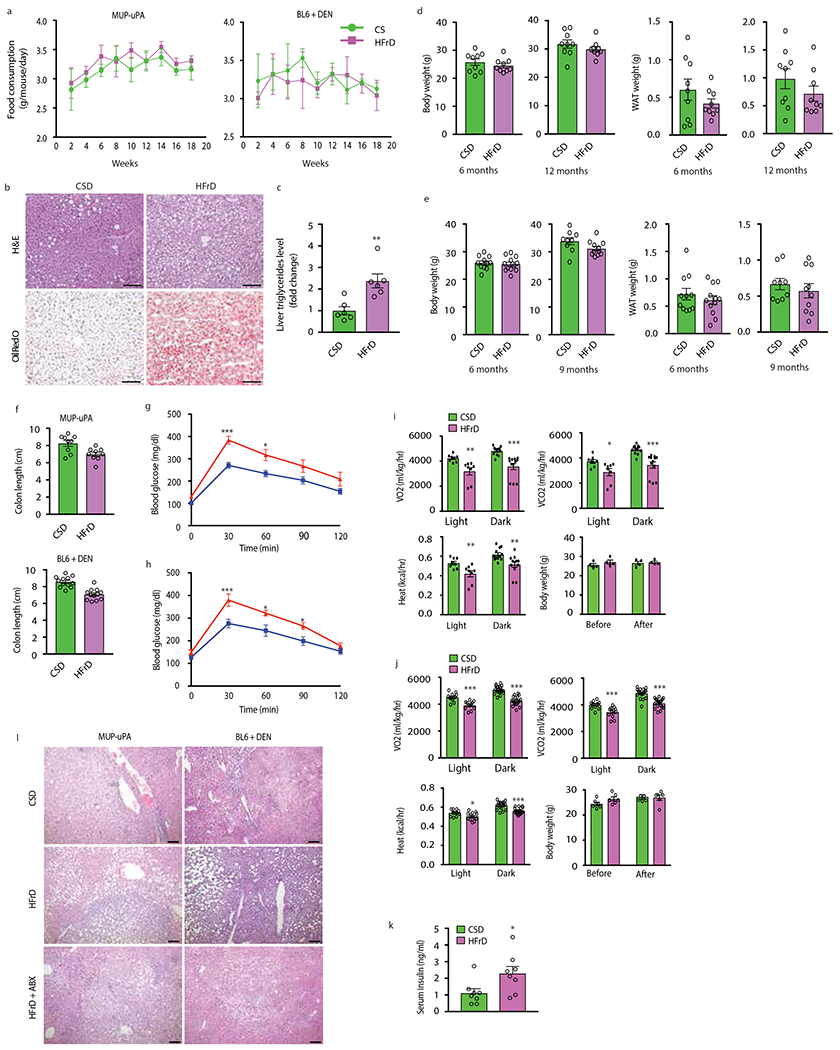
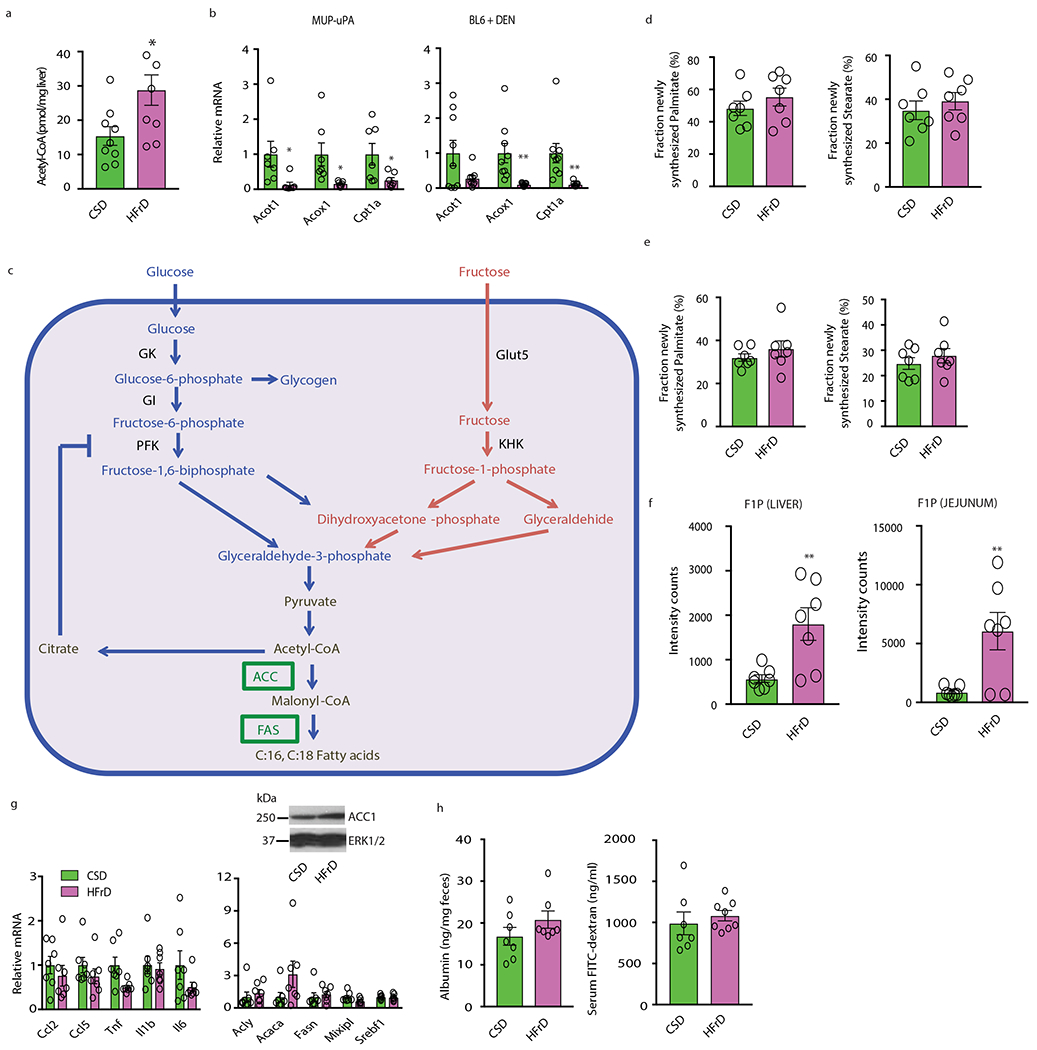
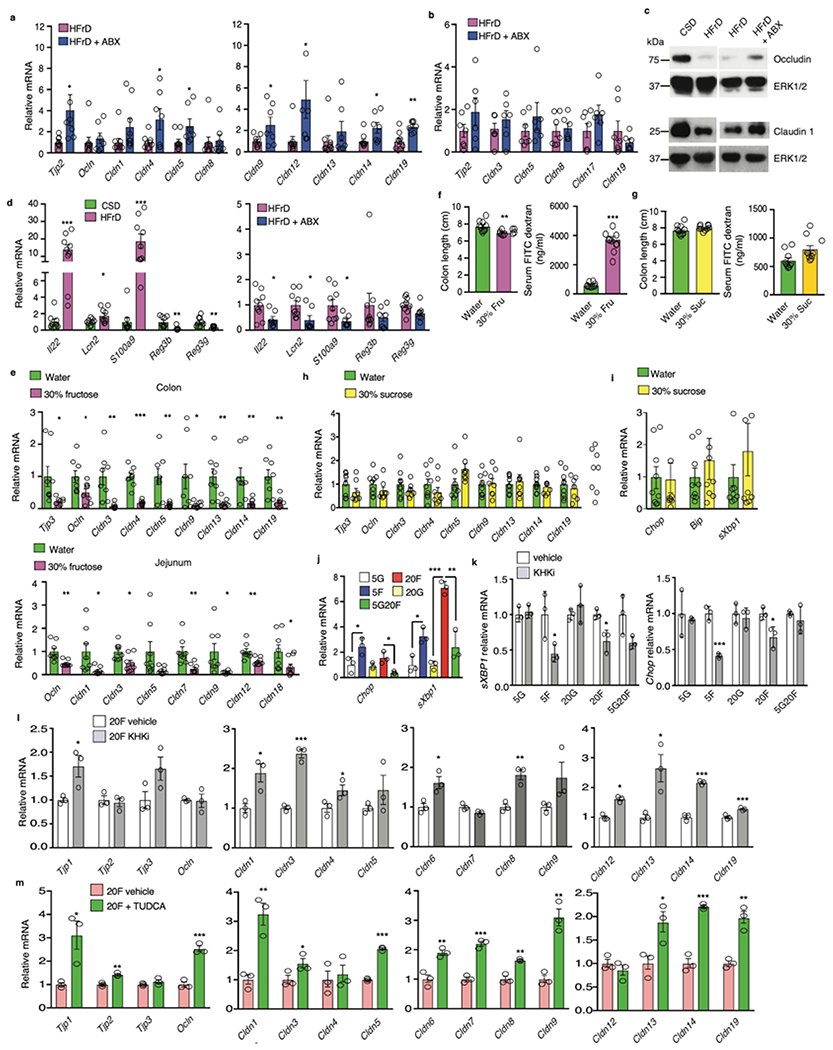
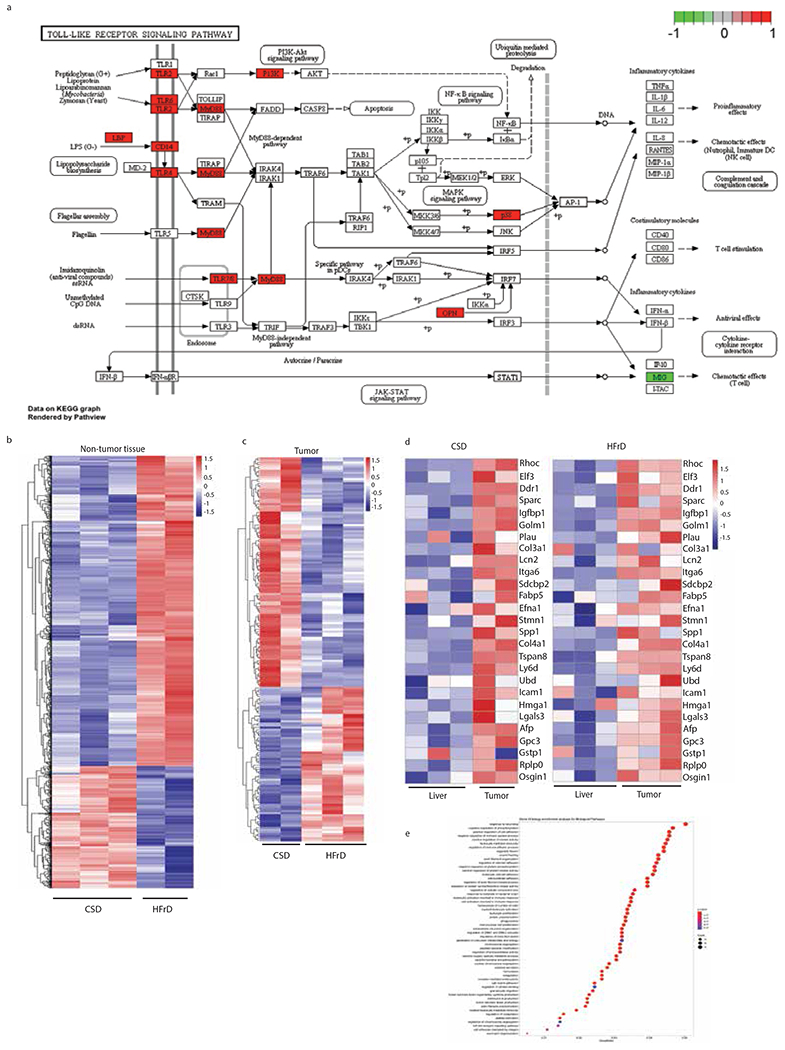
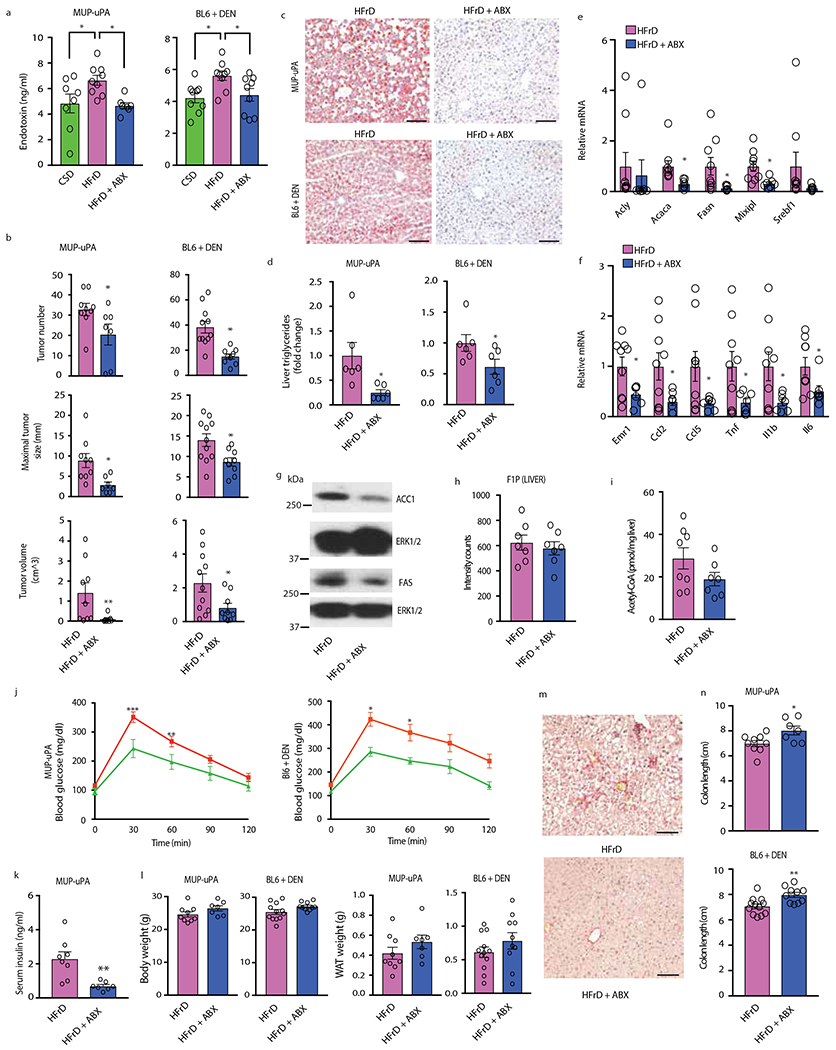
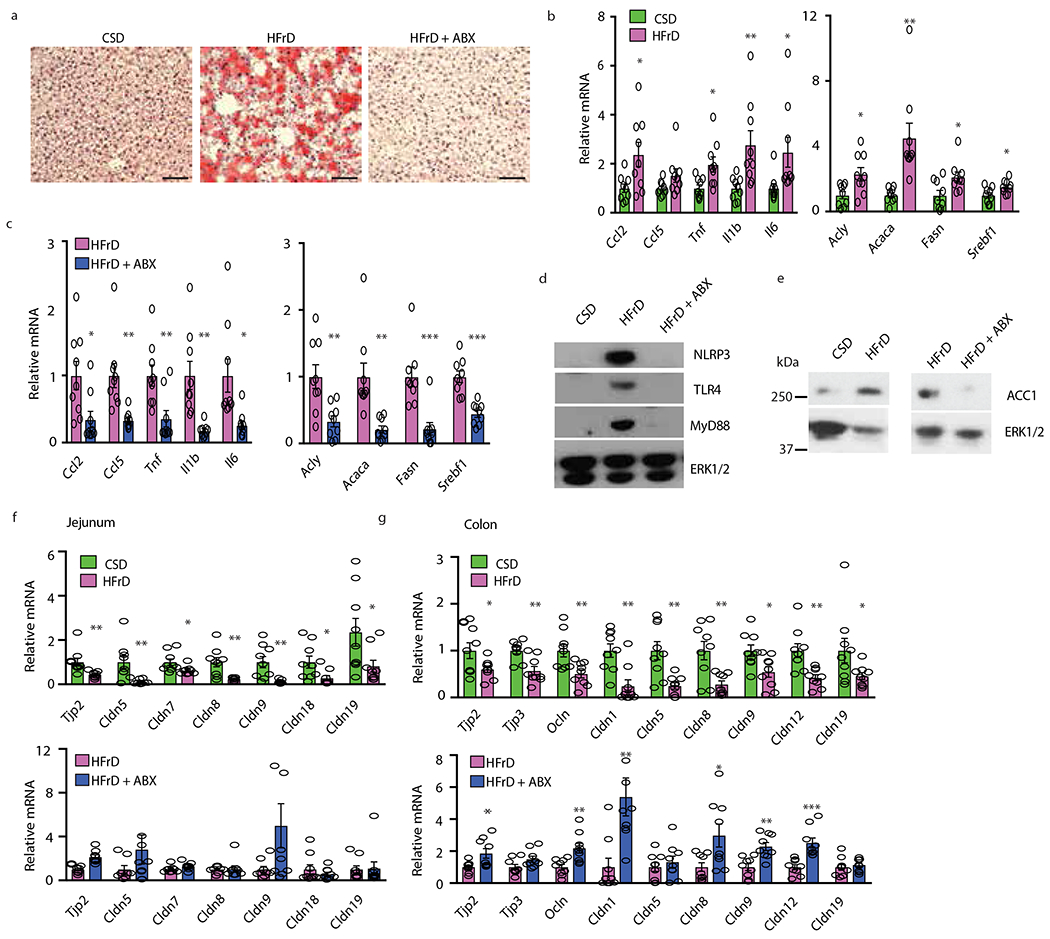
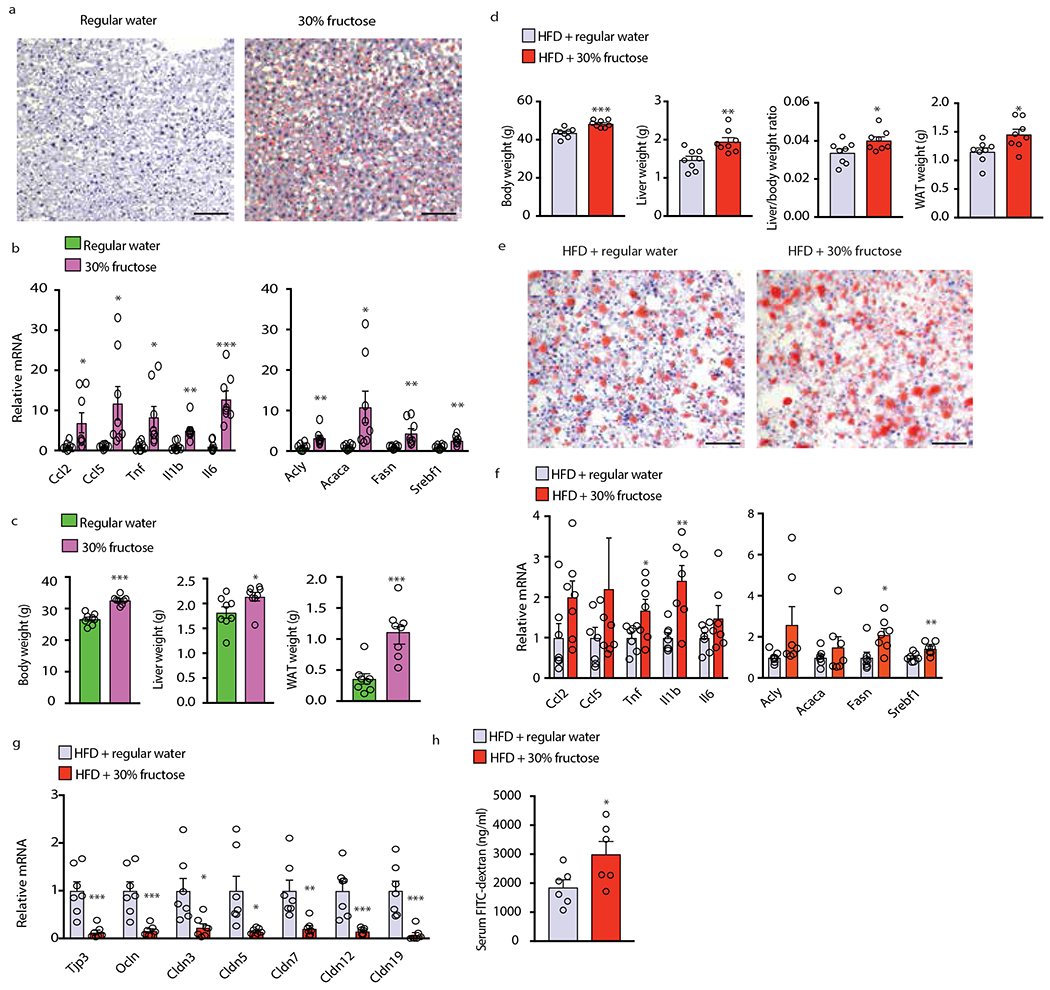
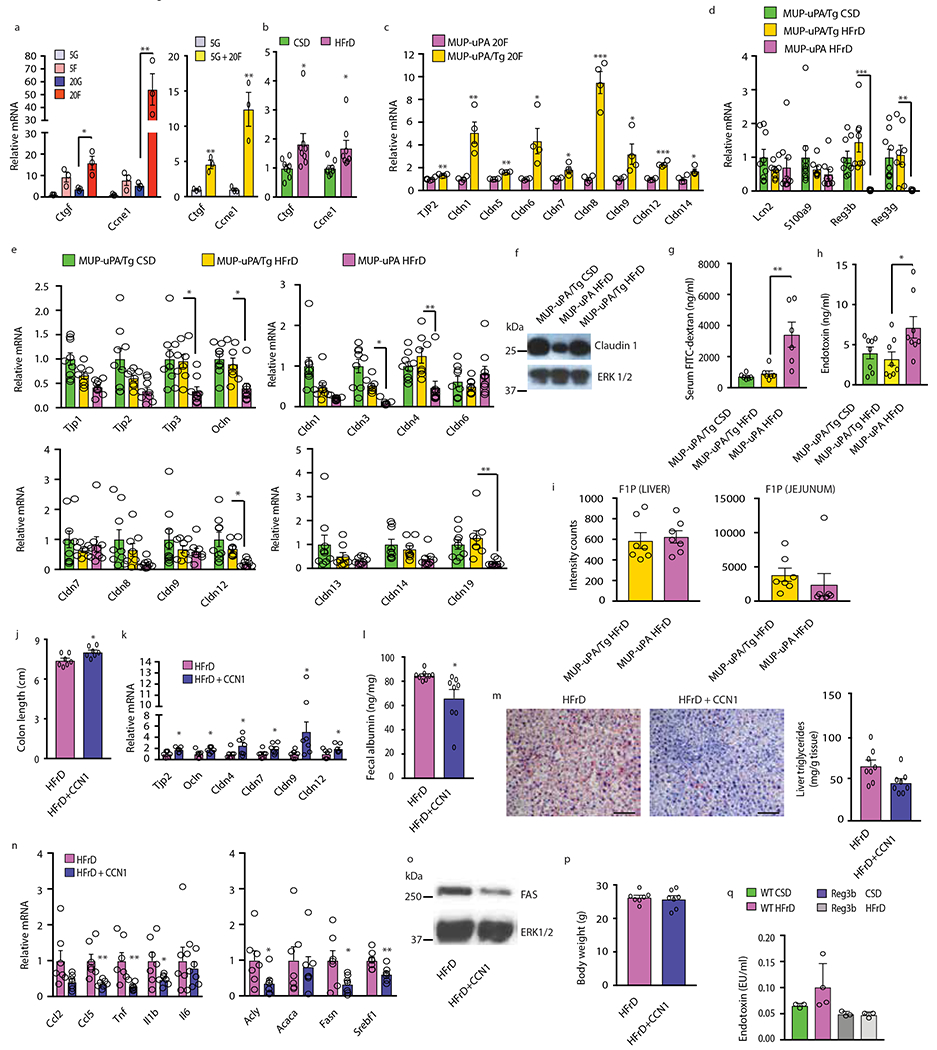
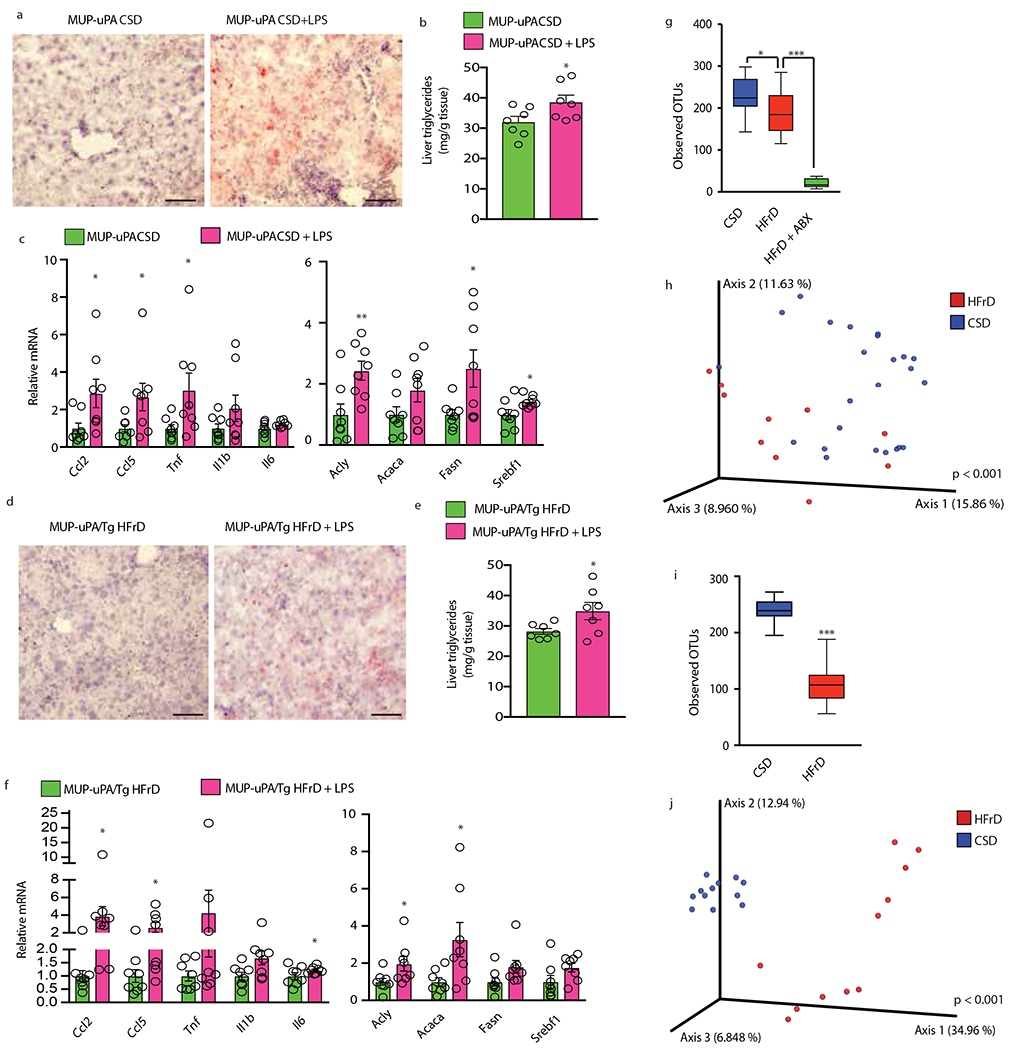
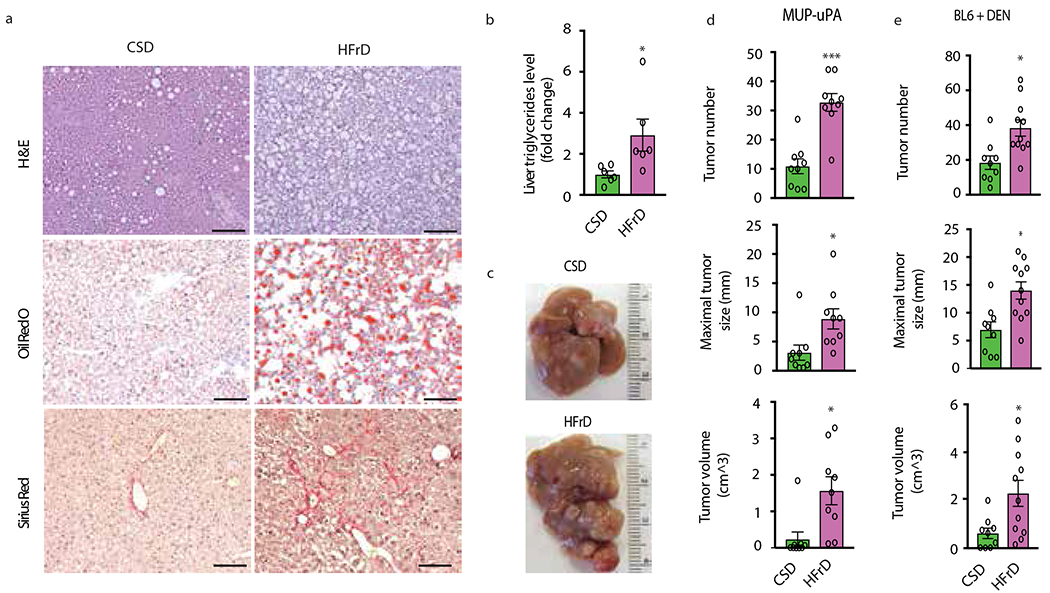
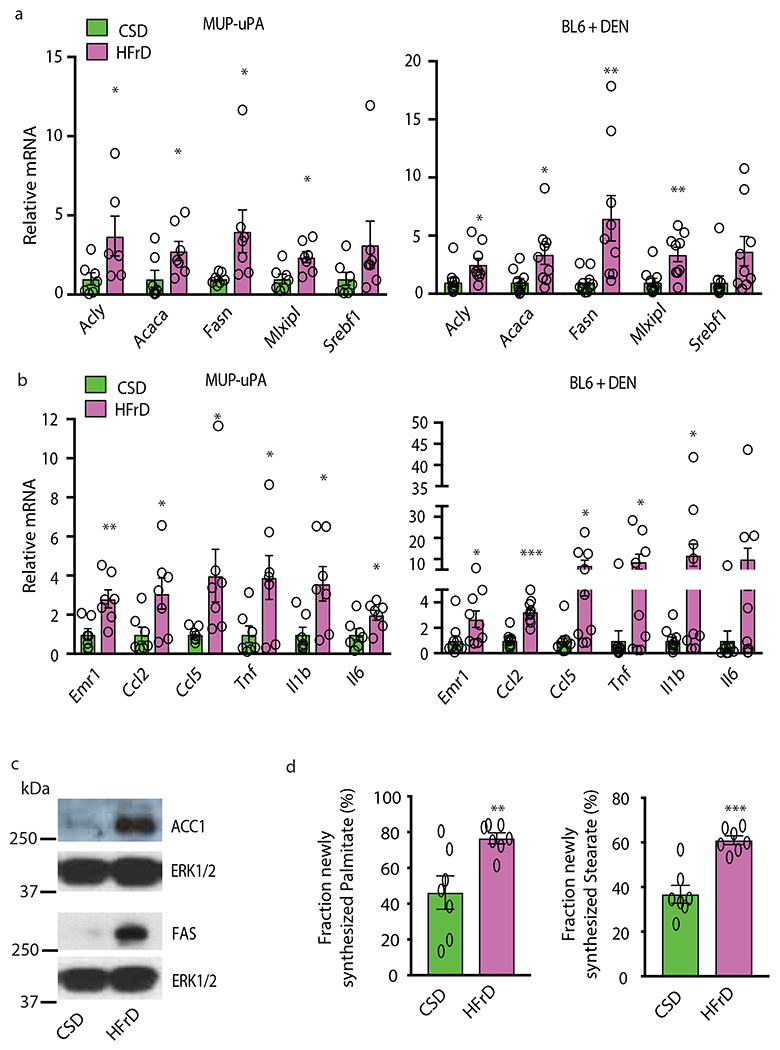
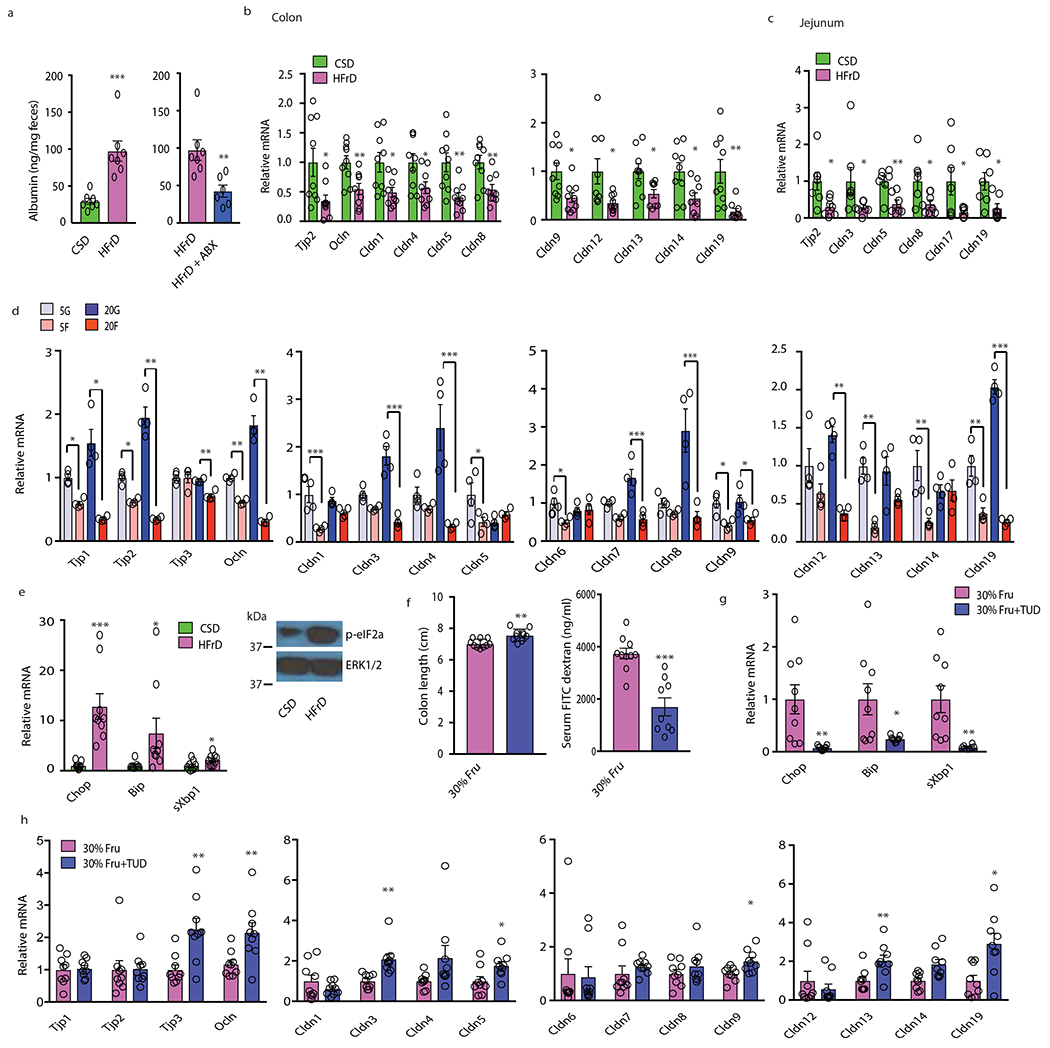
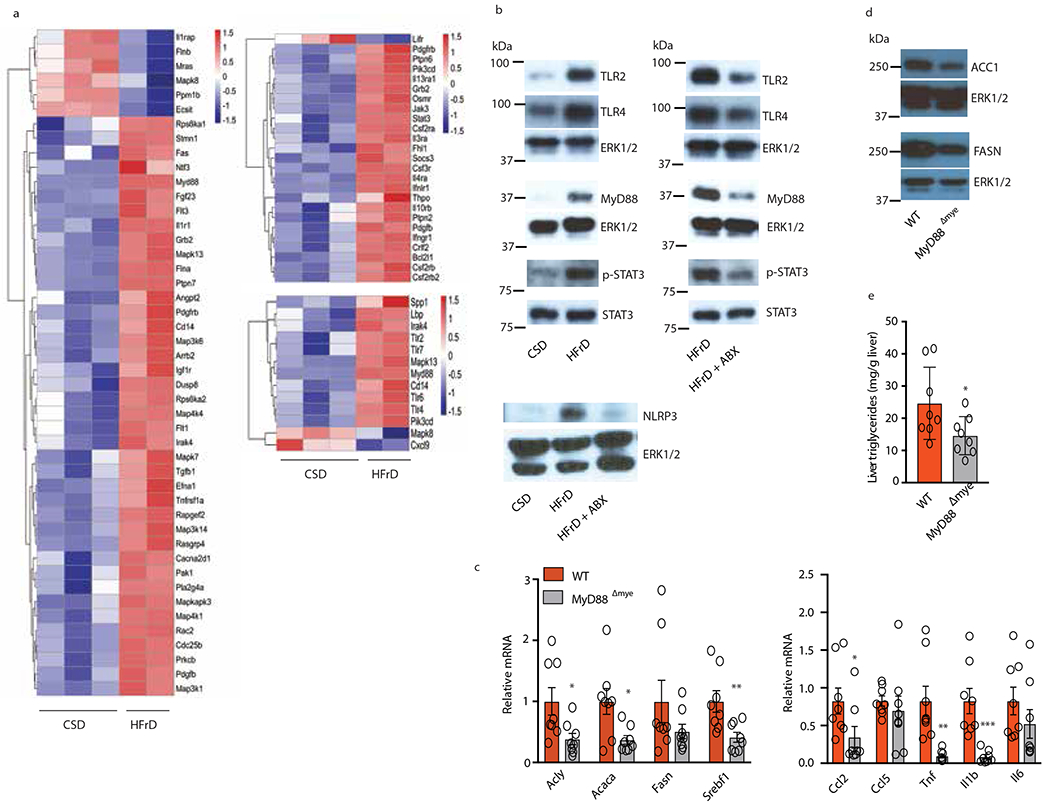
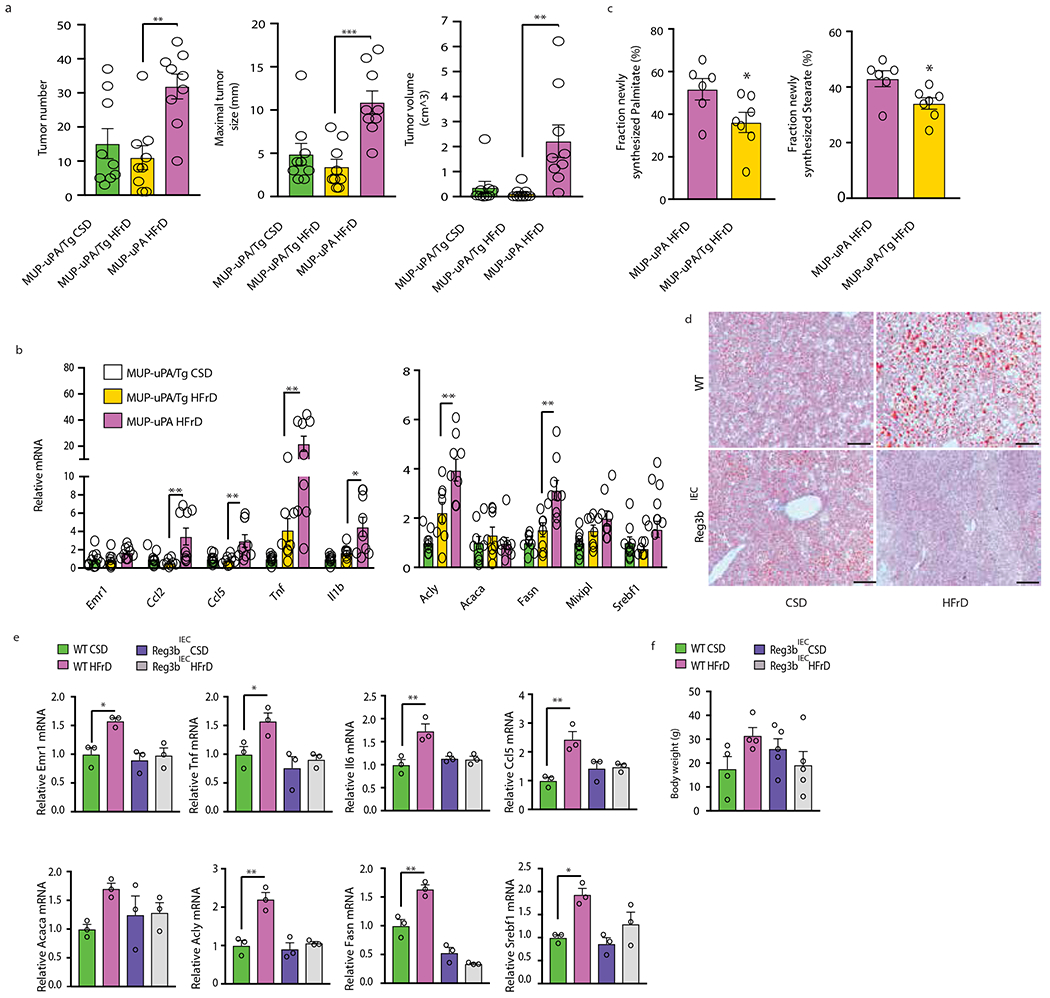
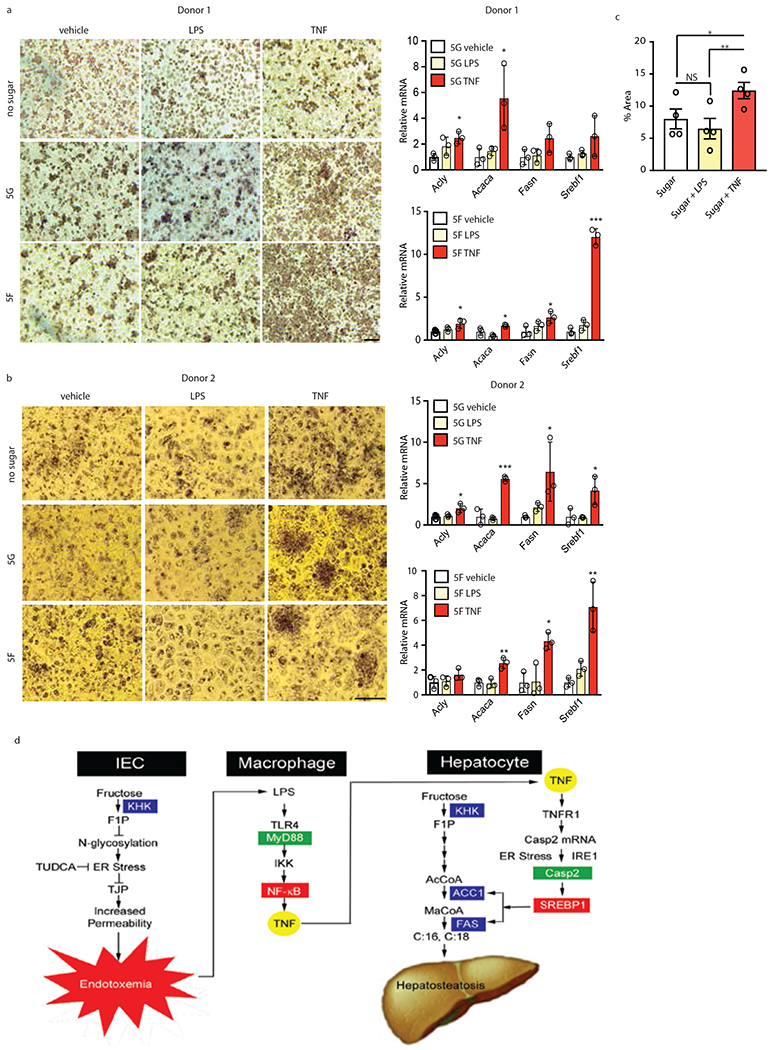
Benign hepatosteatosis, affected by lipid uptake, de novo lipogenesis and fatty acid (FA) oxidation, progresses to non-alcoholic steatohepatitis (NASH) on stress and inflammation. A key macronutrient proposed to increase hepatosteatosis and NASH risk is fructose. Excessive intake of fructose causes intestinal-barrier deterioration and endotoxaemia. However, how fructose triggers these alterations and their roles in hepatosteatosis and NASH pathogenesis remain unknown. Here we show, using mice, that microbiota-derived Toll-like receptor (TLR) agonists promote hepatosteatosis without affecting fructose-1-phosphate (F1P) and cytosolic acetyl-CoA. Activation of mucosal-regenerative gp130 signalling, administration of the YAP-induced matricellular protein CCN1 or expression of the antimicrobial peptide Reg3b (beta) peptide counteract fructose-induced barrier deterioration, which depends on endoplasmic-reticulum stress and subsequent endotoxaemia. Endotoxin engages TLR4 to trigger TNF production by liver macrophages, thereby inducing lipogenic enzymes that convert F1P and acetyl-CoA to FA in both mouse and human hepatocytes.


Conflict of interest statement

Competing Interests Statement

M.K. holds a US patent on the use of MUP-uPA mice to study NASH and HCC (10,034,462 B2) and had received research support from Jansen Pharmaceuticals. All other authors declare no competing interests.

Figures

Extended Data Figure 1.
Extended Data Figure 1.. HFrD stimulates HCC development without affecting body weight or white adipose tissue.
(a) Food consumption by male MUP- uPA and BL6 mice given CSD (MUP-uPA n=4 cages/9 males; BL6 n=5 cages/11 males) or HFrD (MUP-uPA n=4 cages/12 males; BL6 n=5 cages/12 males). (b) Formalin-fixed, paraffin-embedded (FFPE) and frozen liver tissue sections of DEN- challenged BL6 males were stained with H&E or ORO (n=6 per group). Representative images are shown. Scale bars, 100 μm. (c) Total triglycerides in livers of DEN-challenged BL6 males (n=6 per group) are presented as fold-change relative to CSD-fed mice. (d and e) Body and WAT weight of MUP-uPA males (n=9 per group) (d) and DEN- challenged BL6 males (n=11 CSD at 6 months and n=9 CSD at 9 months; n=12 HFrD at 6 months and n=9 HFrD at 12 months) (e) mice given CSD or HFrD were measured at the indicated time points. (f) Colon length in indicated male mice (MUP-uPA n=9, BL6 n=12, per group). (g and h) MUP-uPA males (n=15 per group) (g) or DEN-challenged BL6 males (n = 14 per group) (h) fed HFrD (▴) or CSD (▪) for 5 months were subjected to glucose tolerance tests (GTT). (i and j) CSD- or HFrD- fed MUP-uPA males (n=4 per group) (i) or DEN-challenged BL6 males (n=6 per group) (j) were placed in metabolic cages for two-and-a-half 24-hour cycles composed of two 12-hour light periods and three dark periods. VO2, VCO2, heat production and body weights were measured. (k) Non-fasting serum insulin was measured by ELISA in indicated males (n=8 per group). (l) Liver tumor histology in MUP-uPA and DEN-challenged BL6 males given either CSD, HFrD, or HFrD + Abx cocktail (MUP-uPA n=7, BL6 n=12 per group). FFPE tumor sections were stained with hematoxylin and eosin (H&E). Representative images are shown. Scale bars, 100 μm. Unpaired two-sided Student’s t test was used in panels c to f and k, whereas two-way ANOVA and Sidak’s multiple comparison test were used in panels g-j. Mean ± SEM, *P < 0.05, **P < 0.01, ***P < 0.001.
Extended Data Figure 2.
Extended Data Figure 2.. Fructose effects on DNL and lipogenic enzymes.
(a) Cytosolic acetyl-CoA concentrations in 6-month-old CSD and HFrD fed MUP - uPA males (n=9 CSD group, n=7 HFrD group). (b) Expression of genes encoding FA-oxidizing enzymes in CSD- or HFrD- fed (5 months) MUP-uPA (n=7 per group) and DEN-challenged BL6 male mice (n=9 per group). (c) A metabolic chart comparing pathways through which glucose and fructose are converted to acetyl-CoA in the cytoplasm. GK-glucokinase; KHK-ketohexokinase; GI-glucose isomerase; PFK-phosphofructokinase. Cytoplasmic acetyl-CoA is converted to malonyl-CoA by acetyl-CoA carboxylase (ACC) and malonyl-CoA serves as the building block for synthesis of C16:0 (palmitate) and C18:0 (stearate) by fatty acid synthase (FAS). Expression of ACC1 and FAS is strongly upregulated by prolonged HFrD feeding. (d and e) Measurement of newly synthesized FA in livers (d) and jejunum (e) of MUP-uPA males using D2O as a tracer after a short-term feeding period (48 hours; n=7 per group). (f) Amounts of F1P in liver and jejunum expressed in arbitrary units (48 hours feeding; n=7 per group). (g and h) Expression of inflammatory and lipogenic genes and ACC1 protein in livers (g) and fecal albumin and serum FITC-dextran concentrations (h) in CSD- or HFrD-fed (48 hours) males (n=7 per group). Unpaired two-sided Student’s t test was used in panels a, b and d-h. Mean ± SEM, *P < 0.05, **P < 0.01. Benjamini-Hochberg FDR adjustment for P-values was performed on data in panels b and g.
Extended Data Figure 3.
Extended Data Figure 3.. HFrD feeding downregulates TJP mRNAs and induces ER stress, colonic inflammation and barrier deterioration.
(a and b) Expression of TJP genes in colon (a) and jejunum (b) of MUP- uPA males fed HFrD with (a, n=6 or 7; b, n=6) or without (a, n=9; b, n=7) concomitant Abx treatment. (c) IB analysis of indicated TJPs in colons of above mice (n=9 no Abx, n=7 plus Abx). Representative blots are shown. (d) Expression of Il22 mRNA and IL-22 regulated genes in colons of CSD-, HFrD-, or HFrD + Abx-fed MUP- uPA male mice (n=9 no Abx, n=7 plus Abx). (e and f) BL6 males (e, n=8 per group; f, n=10 per group) were given 30% fructose in drinking water and fed NCD for 5 (e) or 3 (f) months and mRNA amounts of TJP genes in colon and jejunum (e), colon length and FITC-dextran serum levels were measured (f). (g to h) BL6 males were given regular water with or without 30% sucrose and fed NCD for 3 months. Colon length and FITC-dextran serum levels (n=10 per group) (g), colon TJP mRNAs (h) and ER stress marker mRNAs (i) (h and i, n=9 regular water group and n=8 30% sucrose group) were measured. (j) Chop and sXbp1 mRNA amounts in fructose and glucose treated organoids (isolated from 3 different male mice). (j-m) Expression of indicated mRNAs in BL6 enteroids (isolated from 3 different male mice) maintained in media containing the indicated glucose and/or fructose concentrations (mM) and treated with KHK inhibitor (k and l), TUDCA (m) or vehicle. Unpaired two-sided Student’s t test was used in all panels, other than c, to determine Mean ± SEM, *P < 0.05, **P < 0.01, ***P < 0.001. Benjamini-Hochberg FDR adjustment for P-values was performed on data in panels a, b, d, e and h-m. Experiments on enteroids were repeated twice with similar results.
Extended Data Figure 4.
Extended Data Figure 4.. Fructose-induced alterations in the liver transcriptome.
(a) KEGG pathway map of innate immune signaling with HFrD-induced genes indicated in red. (b) Heatmap depicting the entire transcriptome of non-tumor liver tissue from DEN-treated BL6 males kept on CSD (n=3) or HFrD (n=2) for 5 months and analyzed immediately thereafter. (c) Heatmap depicting the entire transcriptome of tumor-bearing liver tissue from DEN-treated BL6 males kept on CSD (n=2) or HFrD (n=3) until 9 months old. (d) Heatmap depicting expression of HCC-related genes in non-tumor and tumor liver tissues from mice described in (b). The color code represents relative mRNA abundance where red shows overexpression and blue shows under expression. (e) Most significant Gene Ontology enrichment terms for Biological Pathways for the genes shown in heatmap (b) comparing DEN-treated BL6 mice fed a CSD or HFrD at 6 months of age. The bigger the dot, the more genes fall in the respective category. The color code represents the adjusted P-value (all are significant and below a cut-off level of 0.01) determined using Benjamini-Hochberg FDR adjustment.
Extended Data Figure 5.
Extended Data Figure 5.. Fructose-induced endotoxemia, hepatosteatosis, HCC, liver fibrosis, glucose intolerance and colonic inflammation are inhibited by antibiotics.
(a) CSD and HFrD-fed MUP-uPA (n=8 CSD, n=9 HFrD, n=7 HFrD+Abx) and DEN- challenged BL6 (n=9 per group) male mice were treated or not with Abx cocktail for 5 months, after which serum endotoxin concentrations were measured. (b) HCC burden in MUP-uPA (n=9 HFrD, n=7 HFrD+Abx) and DEN-challenged BL6 (n=11 HFrD, n=9 HFrD+Abx) males given HFrD alone or HFrD plus Abx cocktail. (c) Hepatosteatosis in MUP-uPA and DEN-challenged BL6 males given HFrD ± Abx for 5 months determined by ORO staining of liver sections (n=6). Scale bars, 100 μm. (d) Liver triglycerides in above mice (n=6 per group). (e-g) Expression of lipogenic (e) and inflammatory (f) genes (n=9 HFrD, n=7 HFrD+Abx) and IB analysis of liver ACC1 and FAS (g). (h, i) Liver F1P abundance (MUP-uPA; n=7 samples from different males per group) (h) and cytosolic acetyl-CoA (n=8 HFrD, n=7 HFrD+Abx samples from different males per group; the HFrD bar is same as in Extended Data Figure 2a). (j, k) glucose tolerance (MUP-uPA, n=10 serum samples from different males per group, BL6, n=7 serum samples from different males per group) (j) and non-fasting serum insulin (n=8 HFrD, n = 7 HFrD+Abx serum samples from different males per group) (k). (l) Total body and white adipose tissue weights in indicated males (MUP-UPA, n = 9 HFrD, n = 7 HFrD+Abx; BL6, n = 12 HFrD, n = 10 HFrD+Abx) (m) Liver fibrosis in HFrD-fed MUP-uPA males was examined by Sirius Red staining (n=7), representative images. (n) Colon length in indicated males (MUP-uPA, n=9 HFrD, n=7 HFrD+Abx; BL6 n=12 HFrD, n=10 HFrD+Abx ; HFrD bars are same as in E.D. Fig. 1f). Scale bars, 100 μm. Unpaired two-sided Student’s t test was used in panels b, d-f, h, I, k, l and n to determine mean ± SEM, whereas panel a was analyzed by one-way ANOVA and Tukey’s multiple comparison test and panel j was analyzed using two-way ANOVA and Sidak’s multiple comparison test. *P < 0.05, **P < 0.01, ***P < 0.001. Benjamini-Hochberg FDR adjustment for P-values was performed on data in panels e and f.
Extended Data Figure 6.
Extended Data Figure 6.. Antibiotics attenuate fructose-induced hepatosteatosis, barrier deterioration and other alterations in BL6 mice.
(a to g) Male BL6 mice were fed CSD or HFrD ± Abx. (a) After five months, liver tissue sections were stained with ORO (n=6 samples from different mice per group). Representative images are shown. Scale bars, 100 μm. (b and c) Inflammatory and DNL-related mRNAs in liver were determined by Q-RT- PCR (n=9 per group). (d and e) Inflammatory and lipogenic proteins in liver lysates were IB analyzed (n=7 protein lysates per group). Representative blots are shown. (f and g) Q-RT-PCR analysis of TJPmRNAs in jejunum (f) and colon (g) (n=9 per group). Two-sided Student’s t test was used to determine mean ± SEM, *P < 0.05, **P < 0.01, ***P < 0.001. Benjamini-Hochberg FDR adjustment for P-values was performed on data in panels b,c,f and g.
Extended Data Figure 7.
Extended Data Figure 7.. Fructose drink enhances hepatosteatosis, expression of liver mRNAs encoding inflammatory cytokines and DNL-related enzymes and barrier deterioration.
(a-c) BL6 males were placed on 30% fructose in drinking water or regular water and NCD for 5 months (n=8 per group). (a) Liver sections were ORO stained and representative images are shown (n=6 sections per group). (b) Liver inflammatory and DNL-related mRNAs were PCR analyzed (n=8 samples per group). (c) Total body, liver and white adipose tissue weights were measured (n=8). (d - h) BL6 males were placed on 30% fructose drink or regular water and HFD for 3 months. Body, liver and WAT weight and liver/body weight ratio were determined (n=8 per group) (d). Liver sections were analyzed by ORO staining (n=6 sections per group). Representative images are shown (e). Liver mRNAs encoding cytokines and DNL-related proteins were measured using Q-RT-PCR (n=7 per group) (f). Expression of TJP mRNAs in colon (n=7 per group) (g) and FITC-dextran in serum (n=6 per group) (h) were also measured. Scale bars, 100 μm. Two-sided Student’s t test was used to determine mean ± SEM, *P < 0.05, **P < 0.01, ***P < 0.001. Benjamini-Hochberg FDR adjustment for P-values was performed on data in panels b,f and g.
Extended Data Figure 8.
Extended Data Figure 8.. Fructose-induced upregulation of YAP target genes and attenuation of TJP mRNA downregulation, barrier deterioration, hepatosteatosis and induction of DNL-related proteins in MUP-uPA/gp130Act and CCN1-treated mice.
(a, b) Expression of indicated mRNAs in BL6 enteroids maintained in media containing the indicated glucose and fructose concentrations (mM) (n=3, enteroids from three male mice; two repeats with similar results). (a) and colonic mucosa of MUP-uPA males (n=8 per group) (b) was measured by Q-RT-PCR. (c) Enteroids from MUP-uPA and MUP- uPA/gp130Act mice (n=4, enteroids from four mice per group) were incubated with 20 mM fructose and mRNAs were measured by Q-RT-PCR. Two repeats with similar results. (d and e) Anti-microbial (d) and TJP (e) mRNAs in colon tissues of MUP-uPA/gp130Act (MUP-uPA/Tg) mice fed CSD (n=9 per group) or HFrD (n=8 per group) compared to MUP-uPA mice fed HFrD for five months (n=9 per group). Asterisks indicate significant changes between MUP-uPA and MUP-uPA/Tg mice fed HFrD. (f) IB of claudin-1 in colons of MUP-uPA/gp130Act and MUP-uPA mice kept on CSD or HFrD. A representative blot is shown. (g) FITC-dextran serum concentrations in indicated mice (n=6 serum samples per group). (h) Serum endotoxin concentrations in indicated mice (n=8 serum samples per group). (i) F1P abundance in liver and jejunum of indicated mice (arbitrary units; n=7 samples per group). (j to p) 6-week-old MUP-uPA males were fed HFrD for 3 months and i.p. injected 2 μg CCN1 or vehicle (PBS) every other day for the last 4 weeks of HFrD feeding. Length (j) and TJP mRNA expression (k) were determined on excised colons (n=7 per group). Fecal albumin was measured by ELISA (n=8 serum samples per group) (l). Liver ORO staining (n=6 tissue samples) and triglyceride concentrations (n=8 samples per group) (m), inflammatory and lipogenic gene expression (n=7 per group) (n) and FAS protein amounts (n=7 per group), representative blots (o). (p) Body weight at the end of the CCN1 treatment course (n=7 males per group). (q) Serum endotoxin in indicated mice (n=3 per group). Scale bars, 100 μm. In panels a, d, e, g, h and q one-way ANOVA with Tukey’s multiple comparison test was used to determine mean ± SEM. Two-sided Student’s t test was used to determine mean ± SEM in panels b, c, i-n, and p. *P < 0.05, **P < 0.01, ***P < 0.001. Benjamini-Hochberg FDR adjustment for P-values was performed on data in panels c, k and n.
Extended Data Figure 9.
Extended Data Figure 9.. Low-dose LPS treatment stimulates hepatosteatosis and increases lipogenic and inflammatory gene expression and effect of fructose on microbiome diversity.
(a to c) Six-week-old MUP-uPA males were fed CSD and given daily i.p. injections of LPS (0.25 mg/kg) or vehicle (PBS). (a) ORO staining of liver sections (n = 7 per group; scale bars-100 μm), representative images are shown. (b) Liver triglycerides in above mice (n=7 per group). (c) Q-RT-PCR analysis of lipogenic and inflammatory mRNAs (n=8 per group). (d to f) Six-week-old MUP-uPA/Tg males were fed HFrD and received daily i.p. injections of LPS or PBS. (d) ORO staining of liver sections (n=7 per group; scale bars-100 μm), representative images are shown. (e) Liver triglycerides (n = 7 per group). (f) Relative mRNA amounts of lipogenic and inflammatory genes (n = 8 per group). (g and i) Relative abundance of significantly differing taxa. Significance was determined by ANCOM. Box-plots of observed operational taxonomic units (OTUs) α-diversity indices comparing stool samples of MUP-uPA (g) and MUP-uPA/Tg (i) mice treated as indicated. (h and j) Principal coordinate analysis of microbiome data using unweighted UniFrac distances; difference between CSD and HFrD was significant in both MUP-uPA (h) (pseudo-F statistic = 2.88, P < 0.001, n = 10 and 24) and MUP-uPA/Tg (j) (pseudo-F statistic = 9.19, P < 0.001, n = 11 and 12) mice as determined by PERMANOVA. Two-sided Student’s t test was used to determine mean ± SEM in panels b, c, e and f. *P < 0.05, **P < 0.01, ***P < 0.001. Benjamini-Hochberg FDR adjustment for P-values was performed on data in panels c and f.
Figure 1.
Figure 1.. High-fructose diet induces hepatosteatosis and tumorigenesis.
(a) MUP-uPA male mice were fed CSD or HFrD starting at 6 weeks of age. After 5 months, formalin-fixed, paraffin-embedded (FFPE) and frozen sections of non-tumor liver tissue were H&E or Oil Red O (ORO) stained to reveal general histology and lipid droplets (n = 6 males per group). Collagen deposition was visualized by Sirius Red staining of frozen sections. Scale bars, 100 μm. (b) Liver samples were analyzed for total triglyceride (TG) content (n=6 males per group), which is presented as fold- change relative to CSD-fed mice. (c) Representative liver morphology of CSD- and HFrD-fed MUP-uPA mice (n=9 and 11 males for the CSD and HFrD groups, respectively). (d) HCC development in CSD- or HFrD-fed MUP-uPA mice (n=9). (e) HCC in DEN- challenged BL6 mice fed CSD (n=9 males per group) or HFrD (n=11 males per group). Panels b, d and e show mean ± SEM determined by two-sided Student’s t test, *P < 0.05, ***P < 0.001.
Figure 2.
Figure 2.. HFrD induces inflammation, lipogenic gene expression and de novo lipogenesis.
(a and b) Expression of lipogenic (a) and inflammatory (b) genes in MUP-uPA males (n=7 per group) and DEN-challenged BL6 (n=10 per CSD and n=9 per HFrD group) males fed CSD or HFrD for 5 months starting at 6 weeks. (c) Immunoblot (IB) analysis of ACC1 and FAS in livers of above MUP-uPA mice (representative of n=7). (d) Measurement of newly synthesized fatty acids in livers of above MUP-uPA mice using deuterated water (D2O) as a tracer (n =7 per group). Panels a, b and d show mean ± SEM determined by two-sided Student’s t test, *P < 0.05, **P < 0.01, ***P < 0.001. Benjamini-Hochberg FDR adjustment for P-value was performed on data presented in panels a and b.
Figure 3.
Figure 3.. Fructose causes barrier deterioration, decreased tight junction protein expression and ER stress.
(a) Fecal albumin concentrations in MUP-uPA male mice kept on CSD (n=7), HFrD (n=7) or HFrD ± Abx (n=6). (b to c) Tight junction mRNAs in colonic (b) and jejunal (c) mucosa of CSD (b, n=9; c, n =7) or HFrD-fed (5 months; b, n = 9; c, n = 7) MUP-uPA males. (d) Tight junction mRNAs in BL6 enteroids incubated with 5 mM or 20 mM glucose (G) or fructose (F) (n=4 different mice). This experiment has been performed 2 times with similar results. (e) Expression of inflammatory and ER stress markers in colonic mucosa of above mice (n=9 each group) and a representative phospho-eIF2α blot of mucosal lysates (n=6 per group). (f) Colon length and serum FITC-dextran in male mice given 30% fructose drink and treated −/+ TUDCA (n=10 for -TUDCA and n=9 for +TUDCA group). (g) Mucosal ER stress marker mRNAs in above mice (n=9 per group). (h) Tight junction mRNAs in colonic mucosa of above mice (n=9 per group). Panels a-c, e-h show mean ± SEM determined by two-sided Student’s t test. In panel d mean ± SEM were determined by one-way ANOVA and Tuckey’s multiple - comparison test. *P < 0.05, **P < 0.01, ***P < 0.001. Benjamini-Hochberg FDR adjustment for P-value was performed on data presented in panels b-c, e and g-h.
Figure 4.
Figure 4.. HFrD-induced upregulation of liver TLR and cytokine signaling and role of myeloid MyD88.
(a) Heatmaps depicting differential expression of genes related to inflammation wound healing and innate immunity in livers of CSD- or HFrD-fed (5 months) male MUP-uPA mice (CSD, n=3; HFrD, n=2). (b) IB analysis of TLRs, MyD88, phosphorylated and total STAT3 and NLRP3 in livers of 6-month-old MUP-uPA mice fed CSD or HFrD or HFrD ± Abx for 5 months (n=7 per group). (cand d) Expression of lipogenic and inflammatory genes (n=8 per group) and representative IB analysis of ACC1 and FAS (n=6) (d) in livers of male Myd88Δmye and W mice fed HFrD for 5 months. (e) Liver triglyceride content in above mice (n=8; mg/g tissue). Panels c and e show mean ± SEM determined by two-sided Student’s t test and Benjamini-Hochberg FDR adjustment for P-values *P < 0.05, **P < 0.01.
Figure 5.
Figure 5.. Activated gp130 suppresses fructose-induced hepatic tumorigenesis, DNL and lipogenic and inflammatory gene expression.
(a) HCC burden in CSD- or HFrD-fed MUP-uPA/gp130Act (MUP-uPA/Tg) and HFrD-fed MUP-uPA males (n=9 per group). (b) Liver lipogenic and inflammatory mRNAs in MUP-uPA/gp130Act males fed CSD or HFrD and MUP-uPA males fed HFrD (MUP-uPA/Tg CSD, n=9; MUP-uPA/Tg HFrD, n=8 and MUP-uPA HFrD n=9). (c) Liver fatty acid synthesis in MUP-uPA (n=6) and MUP-uPA/gp130Act (n=7) males administered D2O as a tracer. (d to f) Control FVB and mice overexpressing the antimicrobial protein Reg3β in intestinal epithelial cells were fed CSD or HFrD for 3 months. (d) Frozen liver sections were ORO stained to reveal lipid droplets (n=3 per group). Scale bars, 100 μm. (e) Relative mRNA amounts of liver lipogenic and inflammatory genes (n=3 per group) and (f) body weight (n=4 per group) in above mice. Panels a, b and e-f show mean ± SEM determined by one-way ANOVA and Tuckey’s multiple- comparison test. Panel c used two-sided Student’s t test. *P < 0.05.
Figure 6.
Figure 6.. TNF stimulates lipid droplet accumulation and lipogenic enzyme induction in human hepatocytes and schematic summary of the mechanism by which fructose intake stimulates hepatic DNL and steatosis.
(a-c) Human hepatocytes isolated from two healthy donors were placed in sugar-free medium or in the presence of 5 mM fructose or glucose. LPS or TNF were added as indicated and 2 days later the cells were evaluated by ORO staining (a, b) for lipid accumulation, which was quantitated by image analysis (c; n=4 separate biological samples, 2 of which incubated with fructose and 2 incubated with glucose) and qRT-PCR for DNL-related mRNAs (a, b; n = 3 technical samples per each experiment), mean ± SEM by one-way ANOVA and Tukey’s multiple comparison test. (d) Schematic summary. In IEC dietary fructose is converted to F1P by KHK. F1P inhibits protein N-glycosylation triggering ER stress and intestinal inflammation to downregulate tight junction proteins (TJP) and trigger barrier deterioration and endotoxemia. Endotoxin (LPS) reaches the liver via the portal vein and engages TLR4 on macrophages to activate NF-κB via the adaptor protein MyD88 and induce TNF expression and secretion. TNF engages TNFR1 on hepatocytes to induce caspase-2 (Casp2) mRNA whose translation is stimulated by ER stress-activated IRE1. Casp2 activates SREBP1 to induce ACC1 and FAS, thereby priming the liver to convert KHK-generated F1P to FA (C:16/C:18), giving rise to hepatosteatosis.

Comment in

References

    1. Spengler EK & Loomba R Recommendations for Diagnosis, Referral for Liver Biopsy, and Treatment of Nonalcoholic Fatty Liver Disease and Nonalcoholic Steatohepatitis. Mayo Clin Proc 90, 1233–1246 (2015). - PMC - PubMed
    1. Stickel F & Hellerbrand C Non-alcoholic fatty liver disease as a risk factor for hepatocellular carcinoma: mechanisms and implications. Gut 59, 1303–7 (2010). - PubMed
    1. Tilg H & Moschen AR Evolution of inflammation in nonalcoholic fatty liver disease: the multiple parallel hits hypothesis. Hepatology 52, 1836–1846 (2010). - PubMed
    1. Fukui H Increased Intestinal Permeability and Decreased Barrier Function: Does It Really Influence the Risk of Inflammation? Inflamm. Intest. Dis 1, 135–145 (2016). - PMC - PubMed
    1. Lebeaupin C et al. Endoplasmic reticulum stress signalling and the pathogenesis of non-alcoholic fatty liver disease. J. Hepatol 69, 927–947 (2018). - PubMed

Publication types

MeSH terms