. 2020 Nov;21(11):1430-1443.
doi: 10.1038/s41590-020-0764-8. Epub 2020 Aug 24.

The angiocrine Rspondin3 instructs interstitial macrophage transition via metabolic-epigenetic reprogramming and resolves inflammatory injury

Affiliations

The angiocrine Rspondin3 instructs interstitial macrophage transition via metabolic-epigenetic reprogramming and resolves inflammatory injury

Bisheng Zhou et al. Nat Immunol. 2020 Nov.

Abstract

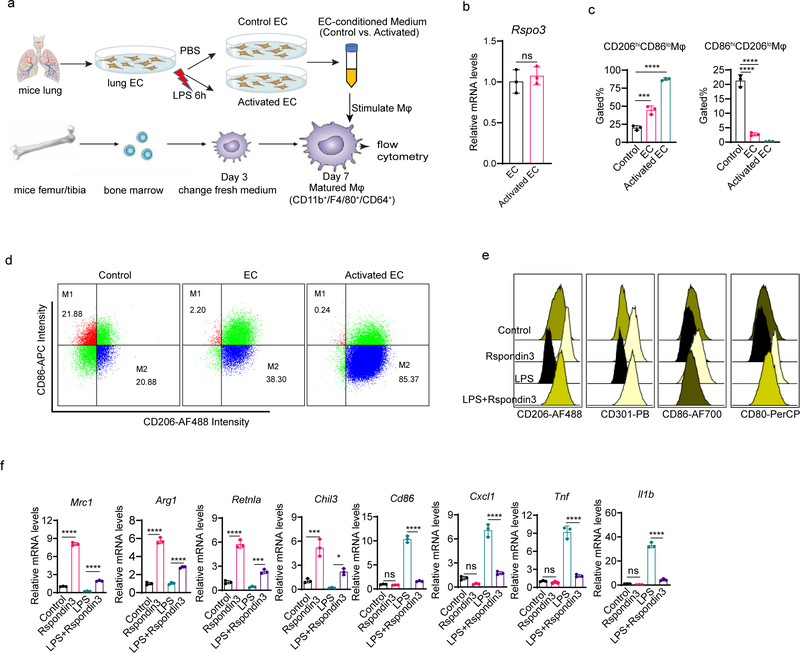
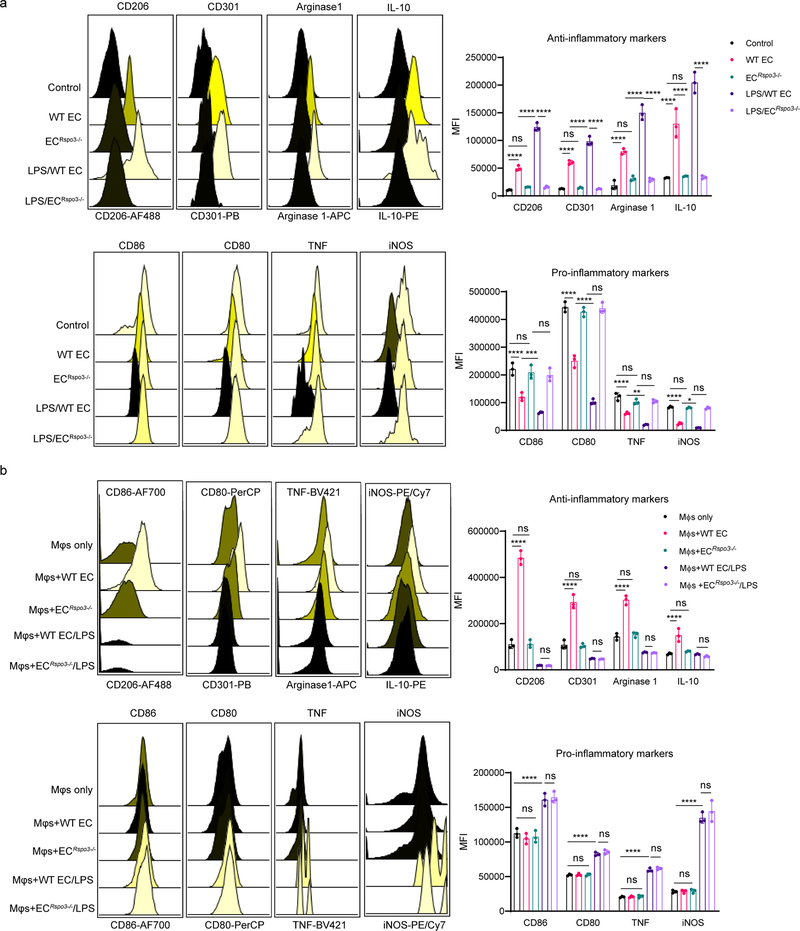
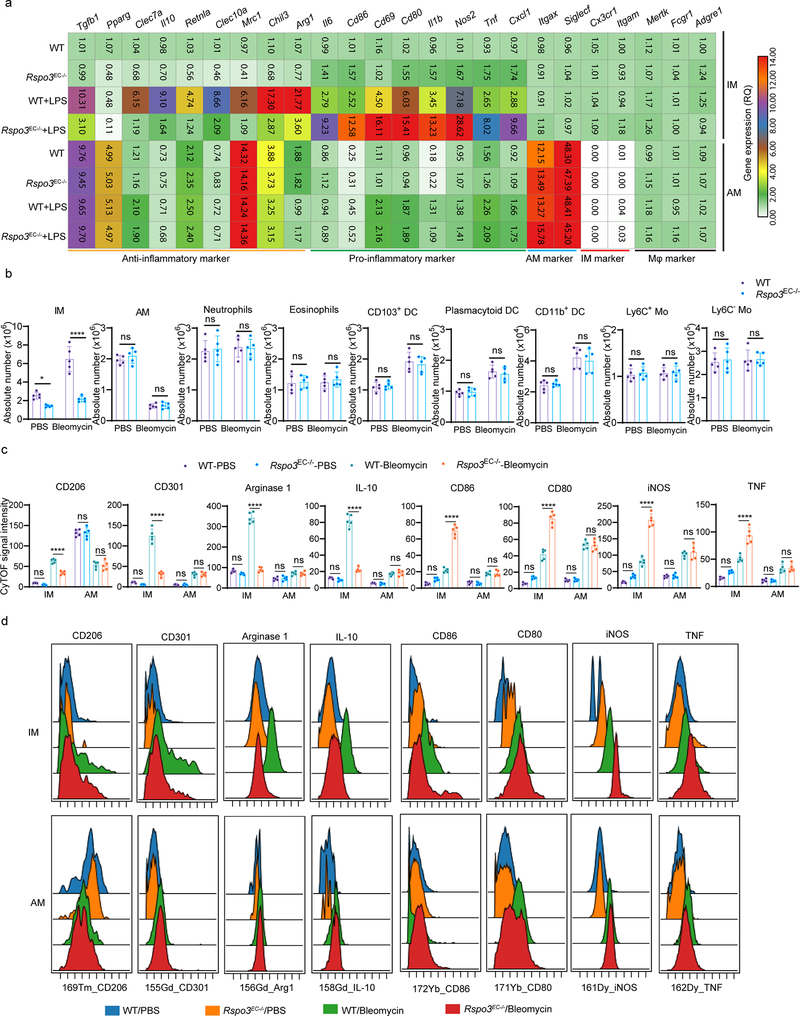
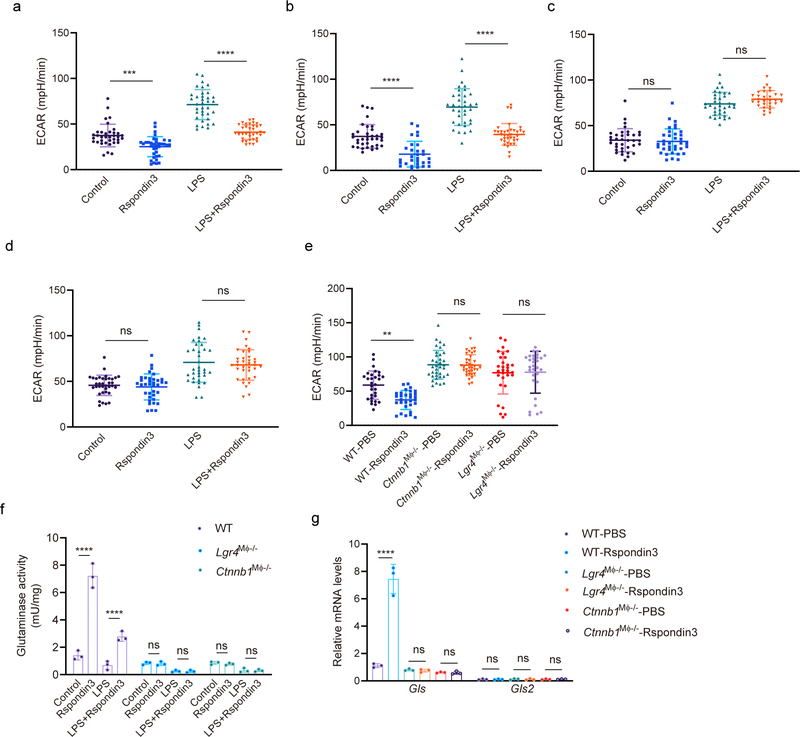
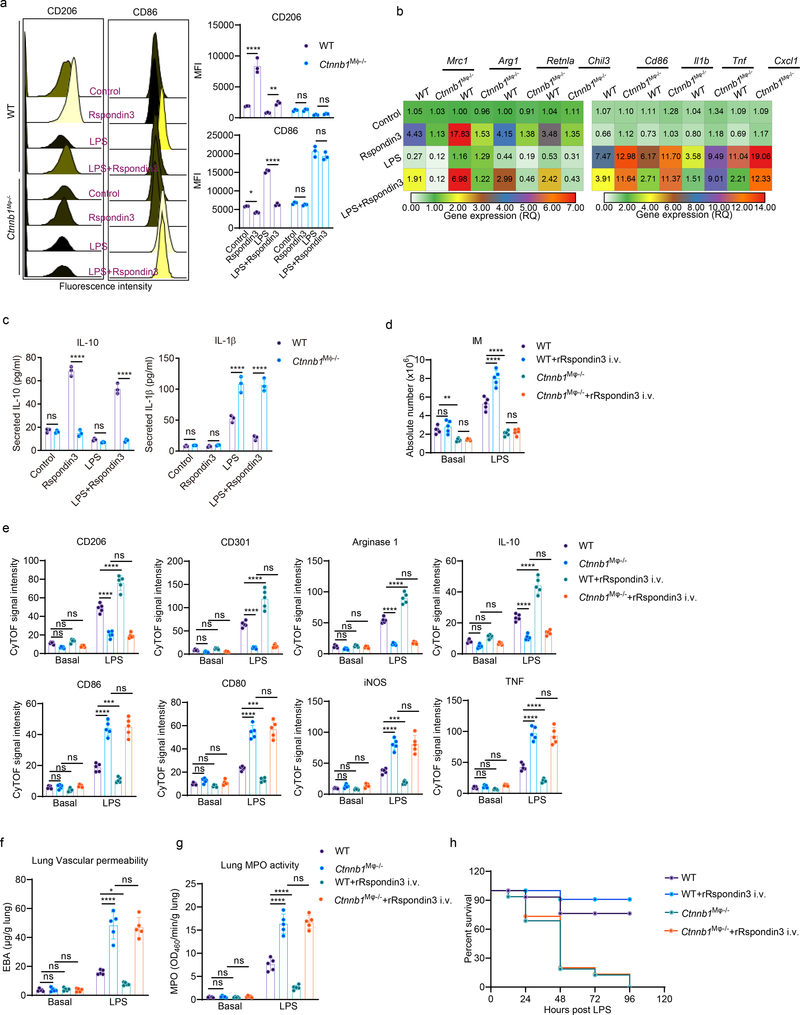
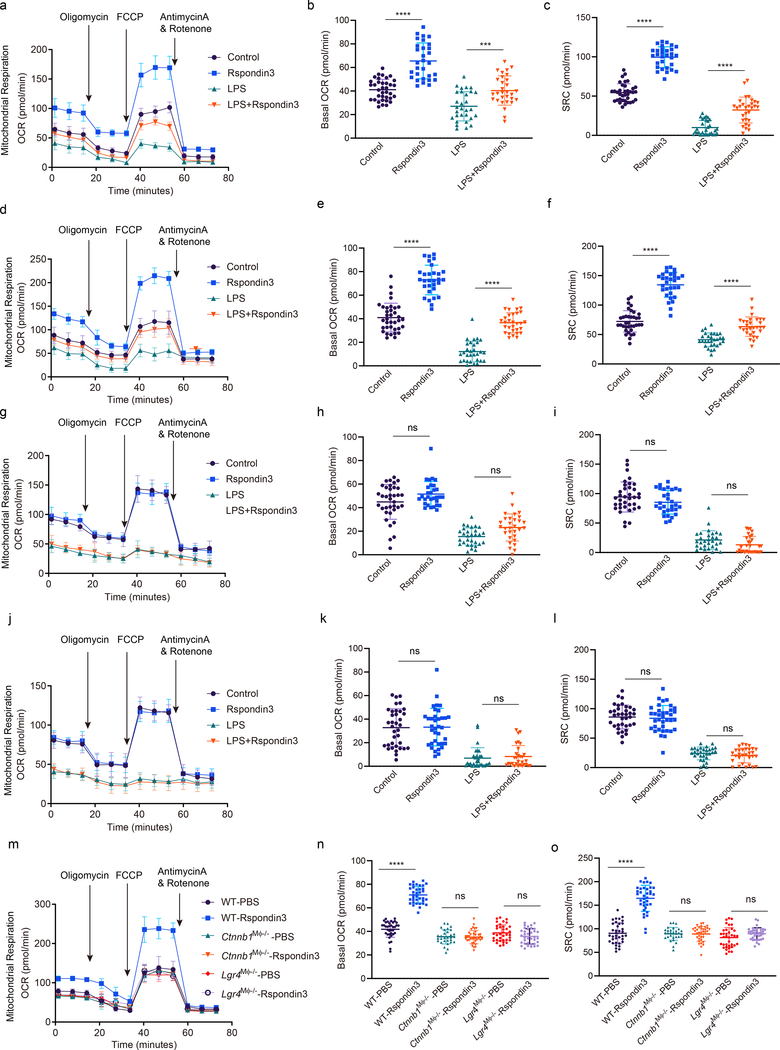
Macrophages demonstrate remarkable plasticity that is essential for host defense and tissue repair. The tissue niche imprints macrophage identity, phenotype and function. The role of vascular endothelial signals in tailoring the phenotype and function of tissue macrophages remains unknown. The lung is a highly vascularized organ and replete with a large population of resident macrophages. We found that, in response to inflammatory injury, lung endothelial cells release the Wnt signaling modulator Rspondin3, which activates β-catenin signaling in lung interstitial macrophages and increases mitochondrial respiration by glutaminolysis. The generated tricarboxylic acid cycle intermediate α-ketoglutarate, in turn, serves as the cofactor for the epigenetic regulator TET2 to catalyze DNA hydroxymethylation. Notably, endothelial-specific deletion of Rspondin3 prevented the formation of anti-inflammatory interstitial macrophages in endotoxemic mice and induced unchecked severe inflammatory injury. Thus, the angiocrine-metabolic-epigenetic signaling axis specified by the endothelium is essential for reprogramming interstitial macrophages and dampening inflammatory injury.


Conflict of interest statement

Competing Interests Statement

The authors declare no competing interests.

Figures

Extended Data Fig. 1:
Extended Data Fig. 1:. Endothelial cells instruct macrophage phenotype transition via Rspondin3.
(a) Schematic of investigation of the angiocrine effects of ECs on macrophages; (b) mRNA levels of Rspo3 in ECs with or without activated by LPS was measured by qPCR; n=3 samples per group (mean ± sd), two-sided unpaired Student’s t-test was determined using GraphPad Prism. ns P=0.5417. (c) Alternatively activated (M2) and classically activated (M1) macrophages measured by flow cytometry from three independent experiments with n=3 samples per group (mean ± sd); Statistical significance was determined by one-way ANOVA with Tukey’s multiple comparisons test using GraphPad Prism with individual P values (left to right) are ***P=0.0006, ****P<0.0001, ****P<0.0001, ****P<0.0001. (d) Representative flow cytometry plots from three independent repeats showing ratios of M1 (CD86hiCD206lo) and M2 (CD206hiCD86lo) populations in BMDMs treated with control medium, EC-conditioned medium (EC), or activated EC conditioned medium (Activated EC) for 24h, respectively; (e) Represented overlaid flow cytometry histograms from three independent repeats showing the MFI of the anti-inflammatory markers (CD206, CD301) and pro-inflammatory markers (CD86, CD80) in BMDMs stimulated with Rspondin3, LPS alone or in combination for 24h; (f) Gene expression levels of anti-inflammatory maker genes (Mrc1, Arg1, Retnla, Chil3) and pro-inflammatory marker genes (Cd86, Cxcl1, Il1b, Tnf) as measured by qPCR in BMDMs treated with Rspondin3, LPS alone or in combination for 24h from three independent experiments with n=3 samples per group (mean ± sd); Statistical significance was determined by one-way ANOVA with Tukey’s multiple comparisons test using GraphPad Prism with individual P values (left to right) are ****P<0.0001, ****P<0.0001, ****P<0.0001, ****P<0.0001, ****P<0.0001, ***P=0.0003, ***P=0.0001, *P=0.0126, ns: P=0.9486, ****P<0.0001, ns P=0.2351, ****P<0.0001, ns P=0.9462, ****P<0.0001, ns P=0.8783, ****P<0.0001.
Extended Data Fig. 2:
Extended Data Fig. 2:. Rspondin3 regulates macrophage phenotype transition via an angiocrine manner.
(a) Levels of anti-inflammatory markers (CD206, CD301, Arginase 1, IL-10) and pro-inflammatory markers (CD86, CD80, TNF, iNOS) measured by flow cytometry in BMDMs incubated with the EC conditioned medium collected from lung ECs isolated from wildtype mice (WT EC), Rspo3EC−/− mice (ECRspo3−/−) at baseline or endotoxemia conditions (LPS i.p., 12 mg/kg for 24h) (LPS/WT EC, LPS/ ECRspo3−/−), respectively; Data are representative of three independent experiments with n=3 samples per group (mean ± sd), statistical significance was determined by two-way ANOVA with Tukey’s multiple comparisons test using GraphPad Prism with individual P values (left to right) are: CD206 (****P<0.0001, ns P=0.9405, ***P=0.0002, ****P<0.0001), CD301 (****P<0.0001, ns P=0.9991, ****P<0.0001, ****P<0.0001), Arginase1 (****P<0.0001, ns P=0.4164, ****P<0.0001, ****P<0.0001), IL-10 (****P<0.0001, ns P=0.9933, ****P<0.0001, ****P<0.0001), CD86 (****P<0.0001, ns P=0.8224, ***P=0.0001, ns P= 0.9075), CD80 (****P<0.0001, ****P<0.0001, ns P=0.7688), TNF (****P<0.0001, ns P=0.4519, **P=0.0061, ns P=0.9997), iNOS (****P<0.0001, ns P=0.9996, ns P=0.6726, ns P>0.9999). (b) Levels of anti-inflammatory markers (CD206, CD301, Arginase 1, IL-10) and pro-inflammatory markers (CD86, CD80, TNF, iNOS) measured by flow cytometry in BMDMs co-cultured in-contact with the ECs from wildtype mice (WT EC), or Rspo3EC−/− mice (ECRspo3−/−) at basal conditions or mice challenged with sublethal LPS (WT EC/LPS, ECRspo3−/−/LPS), respectively; Data are representative of three independent experiments with n=3 samples per group (mean ± s.d), with each dot representing an individual sample. Statistical significance was determined by two-way ANOVA with Tukey’s multiple comparisons test using GraphPad Prism with individual P values (left to right) are CD206 (****P<0.0001, ns P>0.9999, ns P>0.9999), CD301 (****P<0.0001, ns P=0.9977, ns P=0.9998), Arginase1 (****P<0.0001, ns P=0.9328, ns P=0.9998), IL-10 (****P<0.0001, ns P=0.8989, ns P=0.9393), CD86 (ns P=0.8308, ****P<0.0001, ns P=0.9600), CD80 (ns P>0.9999, ****P<0.0001, ns P=0.9679), TNF (ns P=0.9997, ****P<0.0001, ns P=0.9903), iNOS (ns P= 0.9996, ****P<0.0001, ns P= 0.2748).
Extended Data Fig. 3:
Extended Data Fig. 3:. Rspondin3 regulates lung interstitial macrophage phenotype transition following acute lung injury.
(a) Absolute cell number of lung myeloid cells including neutrophils, eosinophils, Ly6C+ Mo, Ly6C- Mo, CD103+ DC, plasmacytoid DC and CD11b+ DC in WT and Rspo3EC−/− mice with or without rRspondin3 i.v. under baseline conditions and post sublethal LPS challenge for 24h or 48h as measured by CyTOF (data are representative of three independent experiments with n=5 mice per group). Graphs show the mean ± s.d, with each dot representing an individual mouse. Statistical significance was determined by two-way ANOVA with Tukey’s multiple comparisons test using GraphPad Prism with individual P values (left to right) are: neutrophils (ns P>0.9999, ns P=0.9995, ns P=0.9991, ****P<0.0001, ****P<0.0001, ****P<0.0001, ns P=0.9864, ns P=0.2420, ns P=0.6898), eosinophils (ns P>0.9710, ns P>0.9789, ns P>0.9865), Ly6C+ Mo (ns P>0.9933, ****P<0.0001, ns P=0.8936, ns P=0.7754, ns P>0.9878), Ly6C Mo (ns P>0.9942, ****P<0.0001, ns P=0.9059, ns P=0.7988, ns P>0.9807), CD103+ DC (ns P>0.9676, ns P>0.1488, ns P>0.8806), plasmacytoid DC (ns P>0.9445, ns P>0.2290, ns P>0.9786), CD11b+ DC (ns P>0.9377, ns P>0.2463, ns P>0.9941); (b) Levels of anti-inflammatory markers (CD206, CD301, RELMα, Arginase 1, IL-10) and pro-inflammatory markers (CD86, CD80, iNOS, TNF, CD69) in lung IM in WT and Rspo3EC−/− mice with or without rRspondin3 i.v. under basal and post sublethal LPS challenge for 24h or 48h measured by CyTOF (data are representative of three independent experiments with five mice per group). Graphs show the mean ± s.d, with each dot representing an individual mouse. Statistical significance was determined by two-way ANOVA with Tukey’s multiple comparisons test using GraphPad Prism with individual P values (left to right) are: CD206 (ns P>0.4229, ****P<0.0001, ****P<0.0001, **P=0.0095, ****P<0.0001, ****P<0.0001, ****P<0.0001), CD301 (ns P>0.2041, ***P=0.0002, **P=0.0049, *P=0.0439, ****P<0.0001, ****P<0.0001, ****P<0.0001), RELMα (ns P=0.4547, **P=0.0023, ns P=0.6850, **P=0.0028, ****P<0.0001, ns P=0.1014, ****P<0.0001, ****P<0.0001, ****P<0.0001), Arginase 1 (ns P=0.1315, ns P=0.0640, ns P=0.2260, ****P<0.0001, ****P<0.0001, ****P<0.0001, ****P<0.0001, ****P<0.0001, ****P<0.0001), IL-10 (ns P=0.0847, ns P=0.5465, ns P=0.3525, **P=0.0037, *P=0.0448, *P=0.0217, ****P<0.0001, ****P<0.0001, ****P<0.0001), CD86 (ns P>0.7231, ****P<0.0001, ****P<0.0001, ****P<0.0001, ****P<0.0001, ****P<0.0001, ****P<0.0001), CD80 (ns P>0.9697, ****P<0.0001, ****P<0.0001, ****P<0.0001, ****P<0.0001, ****P<0.0001, ****P<0.0001), iNOS (ns P>0.9568, ****P<0.0001, ****P<0.0001, ****P<0.0001, ****P<0.0001, ****P<0.0001, ****P<0.0001), TNF (ns P>0.9977, ****P<0.0001, ****P<0.0001, ****P<0.0001, ****P<0.0001, ****P<0.0001, ****P<0.0001), CD69 (ns P>0.9790, ****P<0.0001, ****P<0.0001, ****P<0.0001, ****P<0.0001, **P=.0015, ****P<0.0001). (c) Heatmap for the levels of anti-inflammatory markers (CD206, CD301, RELMα, Arginase 1, IL-10) and pro-inflammatory markers (CD86, CD80, iNOS, TNF, CD69) in lung AM in WT and Rspo3EC−/− mice with or without rRspondin3 i.v. under baseline conditions and post sublethal LPS challenge for 24h or 48h as measured by CyTOF (Data are representative of three independent experiments with n = 5 mice per group, shown as fold change by the mean CyTOF signal intensity normalized to Control group); (d) Wnt signaling activities in mice lung myeloid populations determined by CyTOF using Wnt reporter mice (TCF/Lef:H2B-GFP transgenic mice) with or without rRspondin3 i.v. (Data are representative of three independent experiments with five mice per group). Graphs show the mean ± s.d, with each dot representing an individual mouse. Statistical significance was determined by two-way ANOVA with Sidak’s multiple comparisons test using GraphPad Prism with individual P values (left to right) are: ns P>0.9999, ns P=0.9301, ns P>0.9999, ****P<0.0001, ns P=0.9992, ns P>0.9999, ns P>0.9999, ns P>0.9999, ns P>0.9999.
Extended Data Fig. 4:
Extended Data Fig. 4:. Rspondin3 regulates lung interstitial macrophage phenotype transition following acute lung injury.
(a) Gene expression profiling performed by qPCR to evaluate the expression of macrophage marker genes, anti-inflammatory and pro-inflammatory genes in sorted IM and AM from WT and Rspo3EC−/− mice lungs under baseline conditions and endotoxemia. Heatmap shows the fold change of gene levels as normalized to WT IM at basal conditions (Data are representative of three independent experiments, n=3 samples per group); (b) Lung myeloid populations analyzed by CyTOF in WT and Rspo3EC−/− mice subjected to bleomycin induced acute lung injury and basal conditions (Data are representative of three independent experiments with five mice per group). Graphs show the mean ± s.d, with each dot representing an individual mouse. Statistical significance was determined by two-way ANOVA with Sidak’s multiple comparisons test using GraphPad Prism with individual P values (left to right) are: IM (*P=0.0487, ****P<0.0001), AM (ns P<0.3554, ns P<0.9932), neutrophils (ns P=0.9329, ns P=0.9798), eosinophils (ns P=0.9557, ns P=0.7925), Ly6C+ Mo (ns P=0.8486, ns P=0.9777), Ly6C Mo (ns P=0.9040, ns P=0.9863), CD103+ DC (ns P=0.9526, ns P=0.7602), plasmacytoid DC (ns P=0.9410, ns P=0.7104), CD11b+ DC (ns P=0.9613, ns P=0.7995); (c) Levels of the anti-inflammatory markers (CD206, CD301, Arginase 1, IL-10) and pro-inflammatory markers (CD86, CD80, iNOS, TNF) in IM in WT and Rspo3EC−/− mice under baseline conditions and post bleomycin injury for 5 days as measured by CyTOF (Data are representative of three independent experiments with n=5 mice per group). Graphs show the mean ± s.d, with each dot representing an individual mouse. Statistical significance was determined by two-way ANOVA with Tukey’s multiple comparisons test using GraphPad Prism with individual P values (left to right) are: CD206 (ns P=0.7843, ****P<0.0001, ns P>0.9999, ns P=0.9642), CD301 (ns P=0.5538, ****P<0.0001, ns P>0.9999, ns P>0.9999), Arginase 1 (ns P=0.3438, ****P<0.0001, ns P=0.9857, ns P=0.9963), IL-10 (ns P=0.6175, ****P<0.0001, ns P=0.9926, ns P=0.9502), CD86 (ns P=0.0553, ****P<0.0001, ns P=0.9178, ns P=0.9983), CD80 (ns P=0.0882, ****P<0.0001, ns P=0.9978, ns P=0.9970), iNOS (ns P=0.1009, ****P<0.0001, ns P=0.9991, ns P=0.7604), TNF (ns P=0.0736, ****P<0.0001, ns P=0.9997, ns P=0.9979); (d) Representative overlaid CyTOF histograms showing the CyTOF signal intensity of the anti-inflammatory markers (CD206, CD301, Arginase 1, IL-10) and pro-inflammatory markers (CD86, CD80, TNF, iNOS) in IM and AM in WT and Rspo3EC−/− mice at baseline conditions or 5 days after bleomycin i.t. for data in (e).
Extended Data Fig. 5:
Extended Data Fig. 5:. Macrophage expressed receptor LGR4 is required for Rspondin3-induced macrophage phenotype transition.
(a) Gene expression levels of anti-inflammatory marker genes (Mrc1, Arg1, Retnla, Chil3) and pro-inflammatory marker genes (Cd86, Il1b, Tnf, Cxcl1) measured by qPCR in BMDMs with or without Lgr4 depletion at basal conditions, or treated with Rspondin3, LPS alone or combination of both for 24h from three independent experiments with n=3 samples per group (mean ± sd); Statistical significance was determined by two-way ANOVA with Sidak’s multiple comparisons test using GraphPad Prism with individual P values (left to right) are: Mrc1 (ns P=0.9997, ****P<0.0001, ns P>0.9999, *P=0.0488), Arg1 (ns P=0.9708, ****P<0.0001, ns P=0.3532, ****P<0.0001), Retnla (ns P=0.7211, ****P<0.0001, ns P=0.9663, ****P<0.0001), Chil3 (ns P=0.6858, ****P<0.0001, ns P=0.6939, ***P=0.0001), Cd86 (ns P=0.3993, *P=0.0419, ****P<0.0001, ****P<0.0001), Il1b (ns P=0.8936, ns P=0.8526, ****P<0.0001, ****P<0.0001), Tnf (ns P>0.9999, ns P=0.3417, ****P<0.0001, ****P<0.0001), Cxcl1 (ns P=0.9976, ns P=0.9584, ****P<0.0001, ****P<0.0001). (b) mRNA levels of Lgr4 in sorted IM and AM measured by qPCR; n=3 samples per group (mean ± sd), two-sided unpaired t-test was determined using GraphPad Prism. **P=0.0012. (c) Levels of LGR4 in myeloid populations in mice lung evaluated by CyTOF (Data are representative of three independent experiments with n=5 mice per group). Graphs show the mean ± s.d, with each dot representing an individual mouse. Statistical significance was determined by ordinary one-way ANOVA with Dunnett’s multiple comparisons test using GraphPad Prism. ****P<0.0001. (d) Levels of LGR4 in IM in WT and Lgr4Mφ−/− mice with or without rRspondin3 i.v. under baseline conditions and post sublethal LPS challenge for 24h measured by CyTOF (Data are representative of three independent experiments with n=5 mice per group). Graphs show the mean ± s.d, with each dot representing an individual mouse. Statistical significance was determined by two-way ANOVA with Tukey’s multiple comparisons test using GraphPad Prism with individual P values (left to right) are: ****P<0.0001, ****P<0.0001, ****P<0.0001, ****P<0.0001.
Extended Data Fig. 6:
Extended Data Fig. 6:. β-catenin is required for Rspondin3-induced macrophage phenotype transition.
Levels of anti-inflammatory marker genes (Mrc1, Arg1, Retnla, Chil3) and pro-inflammatory marker genes (Cd86, Il1b, Tnf, Cxcl1) measured by qPCR in BMDMs from Ctnnb1Mφ−/− and WT mice at basal condition, or treated with Rspondin3, LPS alone or combination of both for 24h; Data are representative of three independent experiments with n=3 samples per group (mean ± sd); Statistical significance was determined by two-way ANOVA with Tukey’s multiple comparisons test using GraphPad Prism with individual P values (left to right) are: Mrc1 (ns P>0.9999, ****P<0.0001, ns P>0.9999, ****P<0.0001), Arg1 (ns P>0.9999, ****P<0.0001, ns P>0.9999, ****P<0.0001), Retnla (ns P>0.9999, ****P<0.0001, ns P=0.9716, ****P<0.0001), Chil3 (ns P=0.9998, ****P<0.0001, ns P=0.8135, ****P<0.0001), Cd86 (ns P>0.9999, ns P=0.9878, ****P<0.0001, ****P<0.0001), Il1b (ns P=0.9999, ns P=0.9946, ****P<0.0001, ****P<0.0001), Tnf (ns P=0.9854, ns P=0.9426, ****P<0.0001, ****P<0.0001), Cxcl1 (ns P>0.9999, ns P=0.9975, ****P<0.0001, ****P<0.0001).
Extended Data Fig. 7:
Extended Data Fig. 7:. Rspondin3 mediated increase in mitochondrial respiration through glutamine metabolism.
(a) Basal extracellular acidification rate (ECAR) measured in macrophages stimulated with Rspondin3, LPS alone or in combination for 24h with complete DMEM medium containing 10 mM glucose, 2 mM glutamine, 2 mM sodium pyruvate as substrate; Data are representative of three independent experiments, with 10–12 samples per group. Graphs show the mean ± s.d, with each dot representing an individual sample per time point. Statistical significance was determined by ordinary one-way ANOVA with Tukey’s multiple comparisons test using GraphPad Prism, P values are ***P=0.0003, ****P<0.0001. (b) Basal ECAR measured in macrophages stimulated with Rspondin3, LPS alone or in combination with only 2 mM glutamine as substrate; Data are representative of three independent experiments, with 10–12 samples per group. Graphs show the mean ± s.d, with each dot representing an individual sample per time point. Statistical significance was determined by ordinary one-way ANOVA with Tukey’s multiple comparisons test using GraphPad Prism, P values are ****P<0.0001, ****P<0.0001. (c) Basal ECAR measured in BMDMs stimulated with Rspondin3, LPS alone or in combination with only 10 nM free fatty acid as palmitate bound to BSA added as substrate; Data are representative of three independent experiments, with 10–12 samples per group. Graphs show the mean ± s.d, with each dot representing an individual sample per time point. Statistical significance was determined by ordinary one-way ANOVA with Tukey’s multiple comparisons test using GraphPad Prism, P values are ns P=0.9681, ns P=0.3389. (d) Basal ECAR measured in BMDMs stimulated with Rspondin3, LPS alone or in combination with only10 mM glucose as substrate; Data are representative of three independent experiments, with 10–12 samples per group. Graphs show the mean ± s.d, with each dot representing an individual sample per time point. Statistical significance was determined by ordinary one-way ANOVA with Tukey’s multiple comparisons test using GraphPad Prism, P values are ns P=0.9694, ns P=0.9000. (e) Basal ECAR measured in WT, Lgr4Mφ−/− and Ctnnb1Mφ−/− macrophages stimulated with or without Rspondin3 with only 2 mM glutamine as substrate; Data are representative of three independent experiments, graphs show the mean ± s.d, with each dot representing an individual sample per time point. Statistical significance was determined by ordinary one-way ANOVA with Tukey’s multiple comparisons test using GraphPad Prism, P values are **P=0.0041, ns P>0.9999, ns P>0.9999. (f) Glutaminase activity measured in WT, Lgr4Mφ−/− and Ctnnb1Mφ−/− BMDMs under basal, or stimulated with Rspondin3, LPS alone or in combination. Data are representative of three independent experiments (mean ± sd); Statistical significance was determined by two-way ANOVA with Tukey’s multiple comparisons test using GraphPad Prism. P values (left to right) are ****P<0.0001, ****P<0.0001, ns P=0.9995, ns P>0.9999, ns P=0.9881, ns P>0.9999. (g) Relative gene expression of glutaminase genes – Gls and Gls2 in WT, Lgr4Mφ−/− and Ctnnb1Mφ−/− BMDMs with or without Rspondin3 stimulation measured by qPCR; Data are representative of three independent experiments, n=3 samples from three individual mice per group (mean ± sd), statistical significance was determined by two-way ANOVA with Tukey’s multiple comparisons test using GraphPad Prism. P values are ns P>0.9999, ****P<0.0001.
Extended Data Fig. 8:
Extended Data Fig. 8:. Rspondin3 induces TET2-mediated DNA hydroxymethylation of anti-inflammatory genes.
(a) hMeDIP performed on WT, Lgr4Mφ−/−, Ctnnb1Mφ−/− and Tet2Mφ−/− BMDMs treated with Rspondin3, LPS alone or combination of both, and qPCR with primers targeting the proximal promoters of the indicated genes were used to detect the enrichment of 5hmC; Data are representative of three independent experiments, n=3 samples per group (mean ± sd); Statistical significance was determined by two-way ANOVA with Tukey’s multiple comparisons test using GraphPad Prism. P values (left to right) are: Chil3 (****P<0.0001, ****P<0.0001, ns P>0.9999, ns P>0.9999, ns P=0.9998, ns P>0.9999, ns P=0.9983, ns P>0.9999), Retnla (****P<0.0001, ****P<0.0001, ns P>0.9999, ns P>0.9999, P>0.9999, ns P>0.9999, ns P>0.9999, ns P>0.9999). (b) ChIP with an anti-H3K4me3 antibody were performed on WT, Lgr4Mφ−/−, Ctnnb1Mφ−/− and Tet2Mφ−/− BMDMs treated with Rspondin3, LPS alone or in combination, and qPCR with primers targeting the proximal promoters of the indicated genes were used to detect the enrichment of H3K4me3; Data are representative of three independent experiments, n=3 samples per group (mean ± sd); Statistical significance was determined by two-way ANOVA with Tukey’s multiple comparisons test using GraphPad Prism. P values (left to right) are: Chil3 (****P<0.0001, ****P<0.0001, ns P=0.9920, ns P>0.9999, ns P=0.9883, ns P=0.9843, ns P=0.6545, ns P>0.9900), Retnla (****P<0.0001, ****P<0.0001, ns P=0.9998, ns P>0.9999, P=0.9992, ns P>0.9999, ns P=0.8940, ns P=0.9994). (c) Bar figure showing levels of anti-inflammatory markers and pro-inflammatory markers in lung IM in WT and Tet2Mφ−/− mice with or without rRspondin3 i.v. under basal and post-sublethal LPS challenge for 24h as measured by CyTOF (data are representative of three independent experiments with five mice per group). Graphs show the mean ± s.d, with each dot representing an individual mouse. Statistical significance was determined by two-way ANOVA with Tukey’s multiple comparisons test using GraphPad Prism with individual P values (left to right) are: CD206 (****P<0.0001, ****P<0.0001, ns P=0.9618), CD301 (**P=0.0015, ****P<0.0001, ns P=0.9723), Arginase 1 (****P<0.0001, ****P<0.0001, ns P=0.9945), IL-10 (**P=0.0019, ****P<0.0001, ns P=0.8873), CD86 (****P<0.0001, ***P=0.0002, ns P=0.9799), CD80 (****P<0.0001, ns P=0.1255, ns P=0.8631), iNOS (****P<0.0001, ns P=0.6380, ns P=0.8866), TNF (****P<0.0001, **P=0.0012, ns P=0.8863). (d) Absolute cell number for IM in WT and Tet2Mφ−/− mice with or without rRspondin3 i.v. under basal conditions and post sublethal LPS challenge for 24h measured by CyTOF (Data are representative of three independent experiments with five mice per group). Graphs show the mean ± s.d, with each dot representing an individual mouse. Statistical significance was determined by two-way ANOVA with Tukey’s multiple comparisons test using GraphPad Prism with individual P values (left to right) are ns P>0.4182, ****P<0.0001, ****P<0.0001, ns P=0.9444; (e) Representative confocal images for immunofluorescent staining with anti-TET2 and anti-β-catenin antibodies performed on BMDMs stimulated with Rspondin3 or PBS from three independent repeats, and quantified data are shown (right) with n=5 samples per group (mean ± sd); Statistical significance was determined by two-tailed unpaired t test using GraphPad Prism. **** P<0.0001. (f) Representative confocal images for in situ proximity ligation assay (PLA) with anti-TET2 and anti-β-catenin antibodies to detect interactions were performed on BMDMs stimulated with Rspondin3 or PBS (three independent repeats), and quantified data are shown (right) with n=5 samples per group (mean ± sd); Statistical significance was determined by two-tailed unpaired t test using GraphPad Prism. **** P<0.0001. (g) Model: The angiocrine-metabolic-epigenetic axis regulates lung IM phenotypic transition. Lung ECs release Rspondin3, which binds to its cell surface receptor-LGR4 in IM and activates β-catenin leading to increased α-ketoglutarate concentration through activation of glutaminolysis, followed by induction of TET2 mediated epigenetic reprograming. TET2 mediated DNA hydroxymethylation increases expression of anti-inflammatory genes in IM and prevents inflammatory lung injury.
Figure 1.
Figure 1.. Endothelial cells instruct macrophage phenotype transition via the angiocrine factor Rspondin3.
(a) Levels of anti-inflammatory markers (CD206, CD301, Arginase 1, IL-10) and pro-inflammatory markers (CD86, CD80, TNF, iNOS) in BMDMs incubated with control medium, normal murine lung EC-conditioned medium (EC) or LPS-activated murine lung EC-conditioned medium (Activated EC) as measured by flow cytometry. Left: representative overlaid flow cytometry histograms showing mean fluorescence intensity (MFI), right: quantified data from three independent experiments with n=3 samples per group (mean ± sd); Statistical significance was determined by two-way ANOVA with Dunnett’s multiple comparisons test using GraphPad Prism with individual P values (left to right) are: CD206 (*P=0.0249, ****P<0.0001), CD301 (****P<0.0001, ****P<0.0001), Arginase 1 (****P<0.0001, ****P<0.0001), IL-10 (****P<0.0001, ****P<0.0001), CD86 (****P<0.0001, ****P<0.0001), CD80 (ns P=0.0889, ****P<0.0001), TNF (****P<0.0001, ****P<0.0001), iNOS (****P<0.0001, ****P<0.0001). (b) Top ranked secreted proteins identified by a proteomics-based secretome assay using conditioned medium collected from LPS-activated murine lung ECs (normalized to total spectra); (c) ELISA measurements for Rspondin3 concentrations in EC supernatants from either LPS activated or control EC from three independent repeats; n=6 samples per group (mean ± sd), two-sided unpaired Student’s t-test was determined using GraphPad Prism. ****P<0.0001. (d) Levels of anti-inflammatory markers (CD206, CD301, Arginase1, IL-10) and pro-inflammatory markers (CD86, CD80, TNF, iNOS) as measured by flow cytometry in BMDMs stimulated with Rspondin3 (40 ng/ml), LPS (100 ng/ml) alone, or combination of both for 24h from three independent experiments with n=3 samples per group (mean ± sd); Statistical significance was determined by two-way ANOVA with Tukey’s multiple comparisons test using GraphPad Prism with individual P values (left to right) are: CD206 (****P<0.0001, ****P<0.0001), CD301 (****P<0.0001, ****P<0.0001), Arginase 1(****P<0.0001, ****P<0.0001), IL-10 (****P<0.0001, ****P<0.0001), CD86 (ns P=0.1457, ****P<0.0001), CD80 (ns P=0.1576, ****P<0.0001), TNF (****P<0.0001, ****P<0.0001), iNOS (****P<0.0001, ****P<0.0001). (e) Heatmap representing fold changes of anti-inflammatory cytokines and pro-inflammatory cytokines measured by ELISA in supernatants from BMDMs treated with Rspondin3, LPS alone or combination of both for 24h from three independent experiments; (f) Heatmap representing gene expression levels (mean RQ value) of anti-inflammatory maker genes (Mrc1, Arg1, Retnla, Chil3, Pparg, Il10) and pro-inflammatory marker genes (Cd86, Cxcl1, Il1b, Tnf, Il6, Nos2) as measured by qPCR in BMDMs treated with Rspondin3, LPS alone or combination of both for 24h from three independent experiments.
Figure 2.
Figure 2.. Rspondin3 mediates lung interstitial macrophage (IM) phenotype transition and prevents inflammatory lung injury.
(a) Identifying lung macrophages as well as other myeloid cells by mass cytometry (CyTOF): resident macrophages were identified by CD45+F4/80+Ly6GLy6CCD64+MerTK+, IM and AM were further identified by CD11b+SiglecF and CD11bSiglecF+ respectively; other myeloid populations were identified as: Ly6C+ monocyte (Ly6C+ Mo: CD45+Ly6GLy6C+CD11b+CD24MHCIISiglecFCD206), Ly6C monocyte (Ly6C Mo: CD45+Ly6GLy6CCD11b+CD24MHCIISiglecFCD206), Neutrophils (CD45+Ly6G+CD11b+F4/80), CD103+ DC (CD45+Ly6GCD11c+CD11bCD24+CD64Ly6CSiglecFCD103+BST2), plasmacytoid DC (CD45+Ly6GCD11c+CD11bCD24+CD64Ly6C+SiglecFCD103BST2+), CD11b+ DC (CD45+Ly6GCD11c+CD11b+CD24+CD64Ly6CSiglecFCD103BST2), and Eosinophils (CD45+Ly6GLy6CCD11b+CD24+SiglecF+CD11cMHCIICD64); (b) Absolute cell number for lung IM and AM in WT and Rspo3EC−/− mice with or without rRspondin3 i.v. (0.25 mg/kg) under basal conditions and following post-sublethal LPS challenge (12 mg/kg, i.p.) for 24h or 48h as measured by CyTOF (data are representative of three independent experiments with five mice per group). Graphs show the mean ± s.d. with each dot representing an individual mouse. Statistical significance was determined by two-way ANOVA with Tukey’s multiple comparisons test using GraphPad Prism with individual P values (left to right) are: IM (ns P=0.3306, ns P=0.5741, ns P=0.2460, ****P<0.0001, ****P<0.0001, ****P<0.0001, ****P<0.0001, ****P<0.0001, ****P<0.0001), AM (ns P=0.8041, ns P=0.9768, ns P=0.9902, ns P=0.9835, ns P=0.7590, ns P=0.9409, ns P=0.9998, ns P=0.9862, ns P=0.9844). (c) Heatmap showing levels of the anti-inflammatory markers (upper panel) and pro-inflammatory markers (lower panel) in lung IM in WT and Rspo3EC−/− mice with or without rRspondin3 i.v. under basal and post-sublethal LPS challenge for 24h or 48h as measured by CyTOF (n = 5 mice per group with three independent repeats, shown as fold changes by the mean CyTOF signal intensity normalized to control group); (d) Lung vascular permeability was measured by using the albumin-Evans blue dye tracer (EBA) in WT and Rspo3EC−/− mice with or without rRspondin3 i.v. under basal and post-sublethal LPS challenge for 24h or 48h (data are representative of three independent experiments with five mice per group). Graphs show the mean ± s.d, with each dot representing an individual mouse. Statistical significance was determined by two-way ANOVA with Tukey’s multiple comparisons test using GraphPad Prism with individual P values (left to right) are: ns P=0.9997, ns P=0.9996, ****P<0.0001, ****P<0.0001, ****P<0.0001, ****P<0.0001, ****P<0.0001, ****P<0.0001; (e) Myeloperoxidase (MPO) activity of flushed lung samples from WT and Rspo3EC−/− mice with or without rRspondin3 i.v. under basal and post-sublethal LPS challenge for 24h or 48h (data are representative of three independent experiments with five mice per group). Graphs show the mean ± s.d, with each dot representing an individual mouse. Statistical significance was determined by two-way ANOVA with Tukey’s multiple comparisons test using GraphPad Prism with individual P values (left to right) are: ns P=0.9774, ns P=0.9715, ****P<0.0001, ****P<0.0001, ****P<0.0001, ****P<0.0001, *P=0.0250, ****P<0.0001; (f) Survival curves for WT and Rspo3EC−/− mice with or without rRspondin3 i.v. during endotoxemia conditions (n = 16 mice for each group).
Figure 3.
Figure 3.. LGR4 expressed in macrophages is required for Rspondin3-induced macrophage phenotype transition.
(a) Representative flow cytometry overlay histogram and quantified data for the levels of anti-inflammatory marker CD206 and pro-inflammatory marker CD86 in BMDMs with or without (siNC, nontarget control siRNA) Lgr4 depletion at basal condition, or treated with Rspondin3, LPS alone or combination for both for 24h from three independent experiments with n=3 samples per group (mean ± sd); Statistical significance was determined by two-way ANOVA Tukey’s multiple comparisons using GraphPad Prism. P values (left to right) are: CD206 (****P<0.0001, ****P<0.0001, ns P=0.9520, ns P=0.8256), CD86 (*P=0.0286, ****P<0.0001, ns P=0.9252, ns P=0.0619). (b) Heatmap representing the expression levels (mean RQ value) of anti-inflammatory maker genes (Mrc1, Arg1, Retnla, Chil3) and pro-inflammatory marker genes (Cd86, Cxcl1, Il1b, Tnf) measured by qPCR in BMDMs with or without Lgr4 depletion treated with Rspondin3, LPS alone or combination of both for 24h from three independent experiments; (c) Concentrations of the anti-inflammatory cytokine IL-10 and pro-inflammatory cytokine IL-1β in supernatants of BMDMs with or without Lgr4 depletion measured by ELISA from three independent experiments with n=3 samples per group (mean ± sd); Statistical significance was determined by two-way ANOVA Sidak’s multiple comparisons using GraphPad Prism. P values (left to right) are IL-10: ns P=0.9995, ****P<0.0001, ns P=0.9643, ****<0.0001; IL-1β: ns P=0.9908, ns P=0.1029, ****<0.0001, ****<0.0001. (d) Wnt signaling activity in BMDMs as measured by TOP-Flash reporter assays from three repeats with three samples per group (mean ± sd); Statistical significance was determined by two-way ANOVA Sidak’s multiple comparisons using GraphPad Prism. P values (left to right) are ****P<0.0001, ns P>0.9999. (e) Absolute cell number of IM in WT and Lgr4Mφ−/− mice with or without rRspondin3 i.v. under basal and after sublethal LPS challenge for 24h measured by CyTOF (data are representative of three independent experiments with five mice per group). Graphs show the mean ± s.d, with each dot representing an individual mouse. Statistical significance was determined by two-way ANOVA with Tukey’s multiple comparisons test using GraphPad Prism with individual P values (left to right) are: ns P=0.5877, ns P=0.3916, ns P=0.3806, **P=0.0055, ****P<0.0001, ns=0.9983; (f) Levels of the anti-inflammatory and pro-inflammatory markers in IMs in WT and Lgr4Mφ−/− mice with or without rRspondin3 i.v. under basal and post-sublethal LPS challenge for 24h measured by CyTOF (data are representative of three independent experiments with five mice per group). Graphs show the mean ± s.d, with each dot representing an individual mouse. Statistical significance was determined by two-way ANOVA with Tukey’s multiple comparisons test using GraphPad Prism with individual P values (left to right) are: CD206 (ns P=0.1062, ns P=0.7861, ns P=0.9854, ****P<0.0001, ****P<0.0001, ns P=0.9719), CD301 (ns P=0.9222, ns P=0.7557, ns P=.9865, **P=0.0027, ****P<0.0001, ns P=0.9810), Arginase 1 (ns P=0.1902, ns P=0.5609, ns P=0.9958, ****P<0.0001, ****P<0.0001, ns P=0.9608), IL-10 (ns P=0.1421, ns P=0.6669, ns P=0.9775, ****P<0.0001, ****P<0.0001, ns P=0.8189), CD86 (ns P=0.2238, ns P>0.9999, ns P>0.9999, ****P<0.0001, ***P=0.0009, ns P=0.5211), CD80 (ns P=0.3158, ns P=0.9885, ns P=0.9998, ****P<0.0001, **P=0.0062, ns P=0.9579), iNOS (ns P=0.2172, ns P=0.9996, ns P=0.9930, ****P<0.0001, **P=0.0020, ns P=0.9150), TNF (ns P=0.2758, ns P=0.9947, ns P>0.9999, ****P<0.0001, ****P<0.0001, ns P=0.9986). (g) Active β-catenin (non-phospho) levels in IM in WT and Lgr4Mφ−/− mice with or without rRspondin3 i.v. under basal and post-sublethal LPS challenge for 24h as measured by CyTOF (data are representative of three independent experiments with five mice per group). Graphs show the mean ± s.d, with each dot representing an individual mouse. Statistical significance was determined by two-way ANOVA with Tukey’s multiple comparisons test using GraphPad Prism with individual P values (left to right) are: ns P=0.1588, ****P<0.0001, ns P>0.9999, ***P=0.0001, ****P<0.0001, ns P=0.9971. (h) Lung vascular permeability was measured by using the albumin-Evans blue dye tracer in WT and Lgr4Mφ−/− mice with or without rRspondin3 i.v. under basal conditions and post-sublethal LPS challenge for 24h (data are representative of three independent experiments with five mice per group). Graphs show the mean ± s.d, with each dot representing an individual mouse. Statistical significance was determined by two-way ANOVA with Tukey’s multiple comparisons test using GraphPad Prism with individual P values (left to right) are ns P>0.9910, ****P<0.0001, ****P<0.0001, ns P=0.8521. (i) MPO activity of flushed lung samples from WT and Lgr4Mφ−/− mice with or without rRspondin3 i.v. under basal and post-sublethal LPS challenge for 24h (data are representative of three independent experiments with five mice per group). Graphs show the mean ± s.d, with each dot representing an individual mouse. Statistical significance was determined by two-way ANOVA with Tukey’s multiple comparisons test using GraphPad Prism with individual P values (left to right) are ns P>0.9990, ****P<0.0001, ****P<0.0001, ns P=0.5800.
Figure 4.
Figure 4.. β-catenin signals Rspondin3-induced macrophage phenotype transition.
(a) Representative flow cytometry overlay histograms and quantified data for the levels of the anti-inflammatory marker CD206 and pro-inflammatory marker CD86 shown by MFI in BMDMs from WT and Ctnnb1Mφ−/− mice at the baseline condition, or treated with Rspondin3, LPS alone or combination of both for 24h from three independent experiments with n=3 samples per group (mean ± sd); Statistical significance was determined by two-way ANOVA Tukey’s multiple comparisons using GraphPad Prism. P values (left to right) are: CD206 (****P<0.0001, **P=0.0029, ns P=0.9982, ns P=0.9765), CD86 (*P=0.0318, ****P<0.0001, ns P=0.8020, ns P=0.1195). (b) Heatmap representing gene expression levels (shown as mean RQ value) of anti-inflammatory marker genes (Mrc1, Arg1, Retnla, Chil3) and pro-inflammatory marker genes (Cd86, Cxcl1, Il1b, Tnf) measured by qPCR in BMDMs from WT and Ctnnb1Mφ−/− mice in the baseline condition, or treated with Rspondin3, LPS alone or combination of both for 24h from three independent repeats; (c) Concentrations of the anti-inflammatory cytokine IL-10 and pro-inflammatory cytokine IL-1β in supernatants measured by ELISA in BMDMs from WT and Ctnnb1Mφ−/− mice at the baseline condition, or treated with Rspondin3, LPS alone or combination of both for 24h from three independent experiments with n=3 samples per group (mean ± sd); Statistical significance was determined by two-way ANOVA Sidak’s multiple comparisons using GraphPad Prism. P values (left to right) are IL-10: ns P=0.9742, ****P<0.0001, ns P=0.7458, ****<0.0001; IL-1β: ns P=0.9995, ns P=0.9936, ****P<0.0001, ****P<0.0001. (d) Absolute cell number for IM in WT and Ctnnb1Mφ−/− mice with or without rRspondin3 i.v. under basal state and post-sublethal LPS challenge for 24h measured by CyTOF (data are representative of three independent experiments with five mice per group). Graphs show the mean ± s.d, with each dot representing an individual mouse. Statistical significance was determined by two-way ANOVA with Tukey’s multiple comparisons test using GraphPad Prism with individual P values (left to right) are: ns P=0.6725, **P=0.0069, ns P=0.9991, ****P<0.0001, ****P<0.0001, ns P=0.9595; (e) Levels of anti-inflammatory markers (CD206, CD301, Arginase 1, IL-10) and pro-inflammatory markers (CD86, CD80, iNOS, TNF) in lung IM in WT and Ctnnb1Mφ−/− mice with or without rRspondin3 i.v. under basal and post-sublethal LPS challenge for 24h as measured by CyTOF (data are representative of three independent experiments with five mice per group). Graphs show the mean ± s.d, with each dot representing an individual mouse. Statistical significance was determined by two-way ANOVA with Tukey’s multiple comparisons test using GraphPad Prism with individual P values (left to right) are: CD206 (ns P=0.2099, ns P=0.7433, ns P=0.9536, ****P<0.0001, ****P<0.0001, ns P=0.9178), CD301 (ns P=0.8729, ns P=0.9144, ns P=.9998, ****P<0.0001, ****P<0.0001, ns P=0.8828), Arginase 1 (ns P=0.3580, ns P=0.9857, ns P=0.6133, ****P<0.0001, ****P<0.0001, ns P=0.8287), IL-10 (ns P=0.1331, ns P=0.2284, ns P=0.6216, ****P<0.0001, ****P<0.0001, ns P=0.1970), CD86 (ns P=0.9977, ns P=0.7760, ns P=0.9908, ****P<0.0001, ***P=0.0008, ns P=0.9614), CD80 (ns P=0.6493, ns P=0.8283, ns P=0.8780, ****P<0.0001, ***P=0.0008, ns P=0.7463), iNOS (ns P=0.8586, ns P=0.9763, ns P=0.9937, ****P<0.0001, ***P=0.0004, ns P=0.9994), TNF (ns P=0.9677, ns P=0.8926, ns P=0.9740, ****P<0.0001, ****P<0.0001, ns P=0.7855). (f) Lung vascular permeability as measured in WT and Ctnnb1Mφ−/− mice with or without rRspondin3 i.v. under basal and post-sublethal LPS challenge for 24h (data are representative of three independent experiments with five mice per group). Graphs show the mean ± s.d, with each dot representing an individual mouse. Statistical significance was determined by two-way ANOVA with Tukey’s multiple comparisons test using GraphPad Prism with individual P values (left to right) are ns P=0.9997, ns P=0.9973, ns P=0.9998, ****P<0.0001, *P=0.0254, ns P=0.9603. (g) MPO activity of flushed lung samples from WT and Ctnnb1Mφ−/− mice with or without rRspondin3 i.v. under basal and post-sublethal LPS challenge for 24h (data are representative of three independent experiments with five mice per group). Graphs show the mean ± s.d, with each dot representing an individual mouse. Statistical significance was determined by two-way ANOVA with Tukey’s multiple comparisons test using GraphPad Prism with individual P values (left to right) are ns P=0.9996, ns P=0.9997, ns P>0.9999, ****P<0.0001, ****P<0.0001, ns P=0.9195. (h) Survival curve for WT and Ctnnb1Mφ−/− mice with or without rRspondin3 i.v. following sublethal LPS challenge (n = 16 mice for each group).
Figure 5.
Figure 5.. Rspondin3 increases mitochondrial respiration through glutamine metabolism.
(a) Mitochondrial oxygen consumption rate (OCR) measured in BMDMs stimulated with Rspondin3, LPS alone or combination of both for 24h with complete DMEM medium containing 10 mM glucose, 2 mM glutamine, 2 mM sodium pyruvate as substrate; Data are representative of three independent experiments, n=10–12 samples per group, graphs show the mean ± s.d. (b) Bar figure for basal OCR in (a); Data are representative of three independent experiments, with 10–12 samples per group. Graphs show the mean ± s.d, with each dot representing an individual sample per time point. Statistical significance was determined by ordinary one-way ANOVA with Tukey’s multiple comparisons test using GraphPad Prism, P values are ****P<0.0001, ***P=0.0003. (c) Bar figure for spare respiratory capacity (SRC) in (a); Data are representative of three independent experiments, with 10–12 samples per group. Graphs show the mean ± s.d, with each dot representing an individual sample per time point. Statistical significance was determined by ordinary one-way ANOVA with Tukey’s multiple comparisons test using GraphPad Prism, P values are ****P<0.0001, ****P<0.0001. (d) OCR measured in BMDMs stimulated with Rspondin3, LPS alone or combination of both for 24h with only 2 mM glutamine as substrate; Data are representative of three independent experiments, n=10–12 samples per group, graphs show the mean ± s.d. (e) Bar figure for basal OCR from (d); Data are representative of three independent experiments, with 10–12 samples per group. Graphs show the mean ± s.d, with each dot representing an individual sample per time point. Statistical significance was determined by ordinary one-way ANOVA with Tukey’s multiple comparisons test using GraphPad Prism, P values are ****P<0.0001, ****P<0.0001. (f) Bar figure for SRC in (d); Data are representative of three independent experiments, with 10–12 samples per group. Graphs show the mean ± s.d, with each dot representing an individual sample per time point. Statistical significance was determined by ordinary one-way ANOVA with Tukey’s multiple comparisons test using GraphPad Prism, P values are ****P<0.0001, ****P<0.0001. (g) OCR measured in BMDMs stimulated with Rspondin3, LPS alone or combination of both for 24h with only 10 nM free fatty acid as palmitate bound to BSA added as substrate; Data are representative of three independent experiments, n=10–12 samples per group, graphs show the mean ± s.d. (h) Bar figure for basal OCR from (g); Data are representative of three independent experiments, with 10–12 samples per group. Graphs show the mean ± s.d, with each dot representing an individual sample well per time point. Statistical significance was determined by ordinary one-way ANOVA with Tukey’s multiple comparisons test using GraphPad Prism, P values are ns P=0.1000, ns P=0.0528. (i) Bar figure for SRC in (g); Data are representative of three independent experiments, with 10–12 samples per group. Graphs show the mean ± s.d, with each dot representing an individual sample per time point. Statistical significance was determined by ordinary one-way ANOVA with Tukey’s multiple comparisons test using GraphPad Prism, P values are ns P=0.2595, ns P=0.3785. (j) OCR measured in BMDMs stimulated with Rspondin3, LPS alone or combination of both with only 10 mM glucose as substrate; Data are representative of three independent experiments, n=10–12 samples per group, graphs show the mean ± s.d. (k) Bar figure for basal OCR in (j); Data are representative of three independent experiments, with 10–12 samples per group. Graphs show the mean ± s.d, with each dot representing an individual sample per time point. Statistical significance was determined by ordinary one-way ANOVA with Tukey’s multiple comparisons test using GraphPad Prism, P values are ns P=0.9992, ns P=0.9773. (l) Bar figure for SRC in (j); Data are representative of three independent experiments, with 10–12 samples per group. Graphs show the mean ± s.d, with each dot representing an individual sample per time point. Statistical significance was determined by ordinary one-way ANOVA with Tukey’s multiple comparisons test using GraphPad Prism, P values are ns P=0.9556, ns P=0.8668. (m) OCR measurements in WT, Lgr4Mφ−/− and Ctnnb1Mφ−/− BMDMs stimulated with or without Rspondin3 in the medium with only 2 mM glutamine as substrate; Data are representative of three independent experiments, n=10–12 samples per group, graphs show the mean ± s.d. (n, o) Bar figure for basal OCR (n) and SRC (o) for (m); Data are representative of three independent experiments, with 10–12 samples per group. Graphs show the mean ± s.d, with each dot representing an individual well per time point. Statistical significance was determined by ordinary one-way ANOVA with Tukey’s multiple comparisons test using GraphPad Prism, P values are ****P<0.0001, ns P>0.9999, ns P=0.4223, ****P<0.0001, ns P>0.9999, ns P=0.5107.
Figure 6.
Figure 6.. Rspondin3 induces TET2-mediated DNA hydroxymethylation of anti-inflammatory genes.
(a) α-ketoglutarate to succinate ratios measured in WT, Lgr4Mφ−/− and Ctnnb1Mφ−/− BMDMs treated with Rspondin3, LPS alone or combination of both; Data are representative of three independent experiments, n=3 samples per group (mean ± sd); Statistical significance was determined by two-way ANOVA with Tukey’s multiple comparisons test using GraphPad Prism. P values (left to right) are ****P<0.0001, ****P<0.0001, ns P=0.9985, ns P=0.9999, ns P=0.9937, ns P>0.9999. (b) Nuclear extracts from WT, Lgr4Mφ−/−, Ctnnb1Mφ−/− and Tet2Mφ−/− BMDMs treated with Rspondin3, LPS alone or combination of both were used for TET activity measurement; Data are representative of three independent experiments, n=3 samples per group (mean ± sd); Statistical significance was determined by two-way ANOVA with Tukey’s multiple comparisons test using GraphPad Prism. P values (left to right) are ****P<0.0001, ****P<0.0001, ns P=0.9988, ns P=0.9953, ns P=0.9760, ns P=0.9998, ns P>0.9999, ns P=0.9989. (c) Genomic DNA prepared from WT, Lgr4Mφ−/− , Ctnnb1Mφ−/− and Tet2Mφ−/− BMDMs treated with Rspondin3, LPS alone or combination of both were used for measurement of levels of 5-hydroxymethylcytosine (5hmC); Data are representative of three independent experiments, n=3 samples per group (mean ± sd); Statistical significance was determined by two-way ANOVA with Tukey’s multiple comparisons test using GraphPad Prism. P values (left to right) are ****P<0.0001, ****P<0.0001, ns P>0.9999, ns P=0.9998, ns P=0.9937, ns P>0.9999, ns P>0.9999, ns P>0.9999. (d) Hydroxymethylated DNA immunoprecipitation (hMeDIP) with an anti-5hmC antibody were performed using genomic DNA prepared from WT, Lgr4Mφ−/− , Ctnnb1Mφ−/− and Tet2Mφ−/− BMDMs treated with Rspondin3, LPS alone or combination of both, and qPCR with primers targeting proximal promoters of the indicated genes were used to detect enrichment of 5hmC; Data are representative of three independent experiments, n=3 samples per group (mean ± sd); Statistical significance was determined by two-way ANOVA with Tukey’s multiple comparisons test using GraphPad Prism. P values (left to right) are: Mrc1 (****P<0.0001, ***P=0.0004, ns P>0.9999, ns P>0.9999, ns P>0.9999, ns P>0.9999, ns P>0.9999, ns P>0.9999), Arg1 (****P<0.0001, ****P<0.0001, ns P=0.9996, ns P>0.9999, P>0.9999, ns P>0.9999, ns P>0.9999, ns P>0.9999). (e) Chromatin immunoprecipitation (ChIP) with an anti-H3K4me3 antibody performed on WT, Lgr4Mφ−/− , Ctnnb1Mφ−/−, and Tet2Mφ−/− BMDMs treated with Rspondin3, LPS alone or combination of both, and qPCR with primers targeting the proximal promoters of the indicated genes were used to detect the enrichment of H3K4me3; Data are representative of three independent experiments, n=3 samples per group (mean ± sd); Statistical significance was determined by two-way ANOVA with Tukey’s multiple comparisons test using GraphPad Prism. P values (left to right) are: Mrc1 (****P<0.0001, ****P<0.0001, ns P>0.9999, ns P>0.9999, ns P=0.9933, ns P>0.9999, ns P=0.9985, ns P=0.9996), Arg1 (****P<0.0001, ****P<0.0001, ns P=0.9996, ns P>0.9933, ns P=0.9947, ns P>0.9999, ns P>0.9999, ns P>0.9999). (f) Heatmap of levels of anti-inflammatory markers and pro-inflammatory markers in lung IM in WT and Tet2Mφ−/− mice with or without rRspondin3 i.v. under basal conditions and post-sublethal LPS challenge for 24h as measured by CyTOF from three independent repeats (n = 5 mice per group, shown as the mean CyTOF signal intensity); (g) Lung vascular permeability measured by the EBA assay in WT and Tet2Mφ−/− mice with or without rRspondin3 i.v. under basal and post-sublethal LPS challenge for 24h (data are representative of three independent experiments with five mice per group). Graphs show the mean ± s.d, with each dot representing an individual mouse. Statistical significance was determined by two-way ANOVA with Tukey’s multiple comparisons test using GraphPad Prism with individual P values (left to right) are ns P>0.9215, ****P<0.0001, **P=0.0044, ns P=0.9554. (h) MPO activity of flushed lung samples from WT and Tet2Mφ−/− mice with or without rRspondin3 i.v. under basal and post-sublethal LPS challenge for 24h (data are representative of three independent experiments with five mice per group). Graphs show the mean ± s.d, with each dot representing an individual mouse. Statistical significance was determined by two-way ANOVA with Tukey’s multiple comparisons test using GraphPad Prism with individual P values (left to right) are ns P>0.9872, ****P<0.0001, *P=0.0147, ns P=0.9134.

Comment in

References

    1. Ginhoux F, Schultze JL, Murray PJ, Ochando J & Biswas SK New insights into the multidimensional concept of macrophage ontogeny, activation and function. Nat Immunol 17, 34–40 (2016). - PubMed
    1. Wynn TA & Vannella KM Macrophages in Tissue Repair, Regeneration, and Fibrosis. Immunity 44, 450–462 (2016). - PMC - PubMed
    1. Murray PJ & Wynn TA Protective and pathogenic functions of macrophage subsets. Nat Rev Immunol 11, 723–737 (2011). - PMC - PubMed
    1. Salome B & Magen A Dysregulation of lung myeloid cells in COVID-19. Nat Rev Immunol (2020). - PMC - PubMed
    1. Byrne AJ, Mathie SA, Gregory LG & Lloyd CM Pulmonary macrophages: key players in the innate defence of the airways. Thorax 70, 1189–1196 (2015). - PubMed

Methods-only References

    1. Di A et al. The TWIK2 Potassium Efflux Channel in Macrophages Mediates NLRP3 Inflammasome-Induced Inflammation. Immunity 49, 56–65 e54 (2018). - PMC - PubMed
    1. Liu M et al. Sox17 is required for endothelial regeneration following inflammation-induced vascular injury. Nature communications 10, 2126 (2019). - PMC - PubMed
    1. Nepal S et al. STAT6 induces expression of Gas6 in macrophages to clear apoptotic neutrophils and resolve inflammation. Proc Natl Acad Sci U S A 116, 16513–16518 (2019). - PMC - PubMed
    1. Luo YL et al. Macrophage-Specific in Vivo Gene Editing Using Cationic Lipid-Assisted Polymeric Nanoparticles. ACS Nano 12, 994–1005 (2018). - PubMed
    1. Ficz G et al. Dynamic regulation of 5-hydroxymethylcytosine in mouse ES cells and during differentiation. Nature 473, 398–402 (2011). - PubMed

Publication types

LinkOut - more resources