. 2020 Oct;26(10):1654-1662.
doi: 10.1038/s41591-020-1009-y. Epub 2020 Aug 24.

A population-based phenome-wide association study of cardiac and aortic structure and function

Affiliations

A population-based phenome-wide association study of cardiac and aortic structure and function

Wenjia Bai et al. Nat Med. 2020 Oct.

Abstract

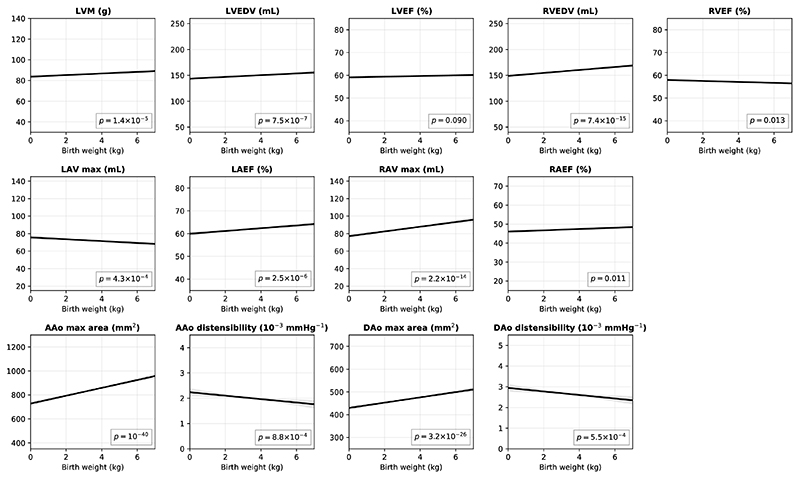
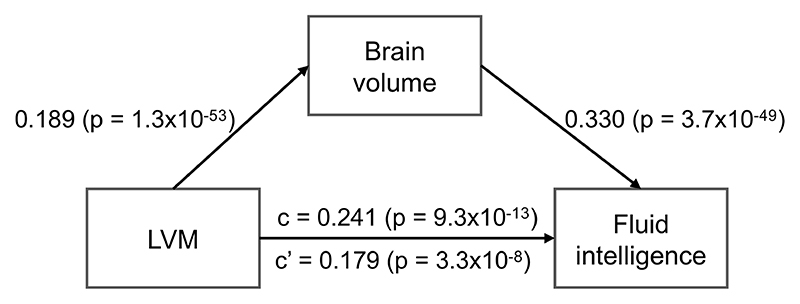
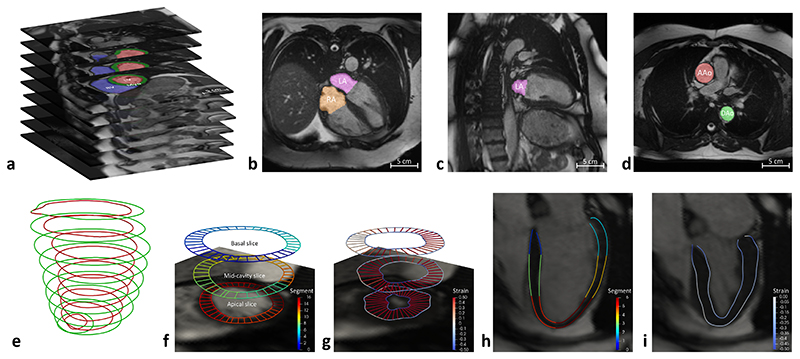
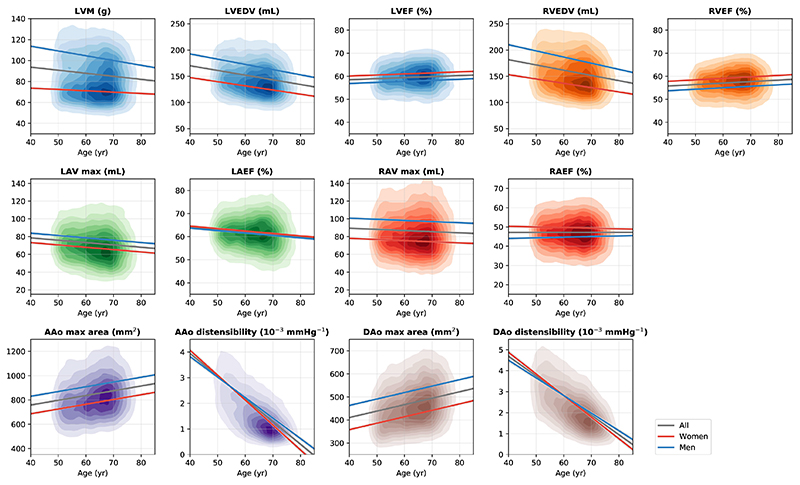
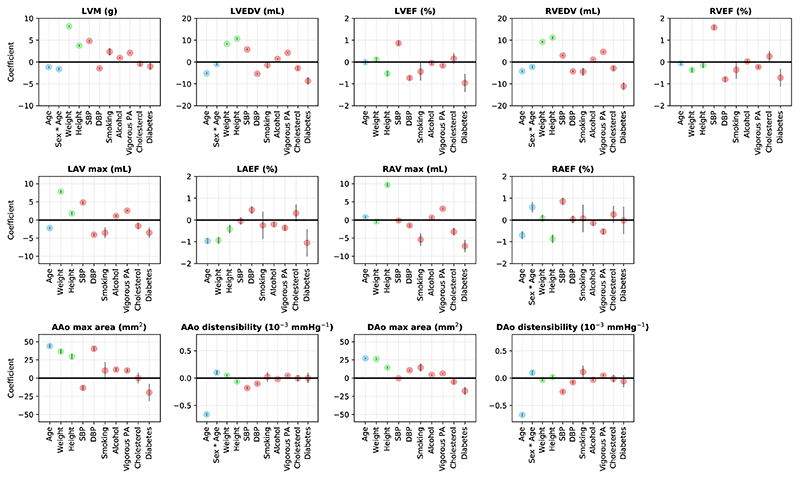
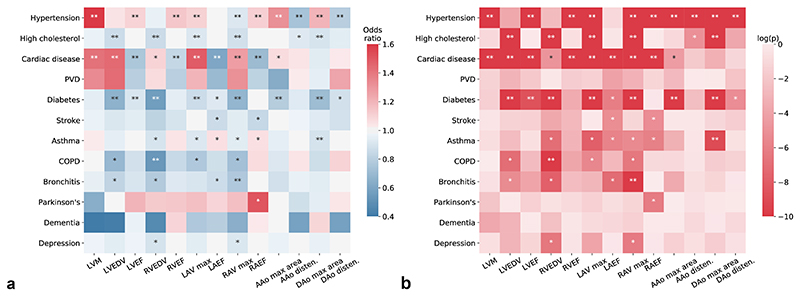
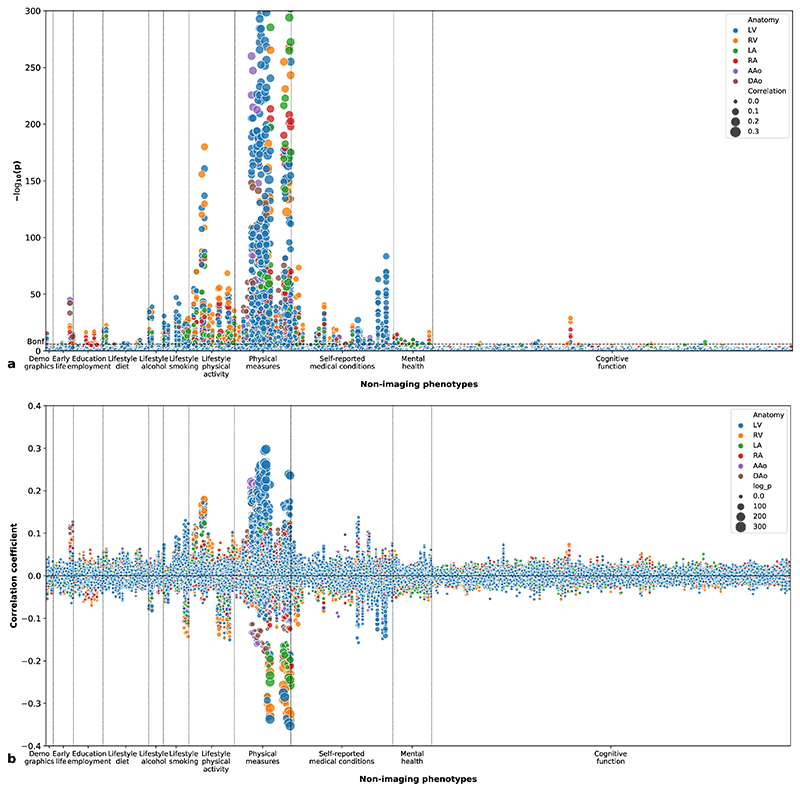
Differences in cardiac and aortic structure and function are associated with cardiovascular diseases and a wide range of other types of disease. Here we analyzed cardiovascular magnetic resonance images from a population-based study, the UK Biobank, using an automated machine-learning-based analysis pipeline. We report a comprehensive range of structural and functional phenotypes for the heart and aorta across 26,893 participants, and explore how these phenotypes vary according to sex, age and major cardiovascular risk factors. We extended this analysis with a phenome-wide association study, in which we tested for correlations of a wide range of non-imaging phenotypes of the participants with imaging phenotypes. We further explored the associations of imaging phenotypes with early-life factors, mental health and cognitive function using both observational analysis and Mendelian randomization. Our study illustrates how population-based cardiac and aortic imaging phenotypes can be used to better define cardiovascular disease risks as well as heart-brain health interactions, highlighting new opportunities for studying disease mechanisms and developing image-based biomarkers.


Conflict of interest statement

Competing interests statement

S.E.P. acknowledges consultancy fees from Circle Cardiovascular Imaging Inc., Calgary, Alberta, Canada. D.R. acknowledges consultancy fees from Circle Cardiovascular Imaging Inc., Calgary, Alberta, Canada, Heartflow, Redwood City, CA, USA and IXICO PLC, London, UK. P.M.M. acknowledges consultancy fees from Roche, Adelphi Communications, Celgene and Biogen. He has received honoraria or speakers’ honoraria from Novartis, Biogen and Roche and has received research or educational funds from Biogen, Novartis, GlaxoSmithKline and Nodthera. He is a member of the Scientific Advisory Board to the Board of Ipsen Pharmaceuticals. The remaining authors declare no competing interests.

Figures

Extended Data Figure 1
Extended Data Figure 1. The conditional plots of imaging phenotypes against birth weight.
The dark line denotes the conditional plot of an imaging phenotype against birth weight, with other variables (sex, age, sex * age, weight, height, SBP, DBP, current smoking status, alcohol intake, vigorous PA frequency, high cholesterol and diabetes) set to their mean. The grey area denotes the 95% confidence interval. n = 12,169 subjects were analysed with available birth weight information. The p-values were calculated from two-sided t-tests.
Extended Data Figure 2
Extended Data Figure 2. Mediation model for LVM, brain volume and fluid intelligence score.
The relationship between LVM and fluid intelligence score (path c) is 26% (difference between c and c’) mediated by total brain volume. n = 18,369 subjects were analysed with available fluid intelligence information. The values are depicted as regression coefficient (two-sided t-test p-value) for standardised imaging phenotypes.
Figure 1
Figure 1. Automated CMR image analysis pipeline.
a) LV and RV volumes are derived from short-axis image segmentation (red: LV cavity; green: myocardium; blue: RV cavity). b, c) LA and RA volumes are derived from long-axis image segmentation (purple: LA cavity; orange: RA cavity), as illustrated using a 4 chamber view (b) and a 2 chamber view (c). d) AAo and DAo cross-sectional areas are derived from aortic image segmentation (red: AAo; green: DAo). e) Myocardial wall thickness is measured using the distance between LV endocardial contour (red) and epicardial contour (green). f) For measurement of myocardial wall thickness, three short-axis image slices are selected, including a basal slice at 25% of the LV length (the distance from the mitral annular plane to the apex of the LV), a mid-cavity slice at 50% and an apical slice at 75% of the LV length. The endocardial and epicardial contours are divided into 16 AHA segments, which are coded by different colors, as indicated by the color bar. g) Motion tracking is performed on short-axis image slices, warping the contours to each time frame across a cardiac cycle. Circumferential and radial strains (color-coded on the contours) are calculated using the change of length of the line segments. h) On the long-axis 4 chamber view image, the endocardial and epicardial contours are divided into 6 segments (coded by different colors). i) Motion tracking is performed on the long-axis 4 chamber view image. Longitudinal strain is calculated using the change of length of the line segments.
Figure 2
Figure 2. Associations of selected imaging phenotypes with sex and age.
Each graph displays a kernel density plot of an imaging phenotype plotted against age, as well as the linear regression lines for the whole population (gray), for women (red) and for men (blue). n = 23,415 subjects were included in the analysis. Detailed regression coefficients and association p-values can be found in Supplementary Table 7.
Figure 3
Figure 3. Regression coefficients for cardiac and aortic imaging phenotypes on demographics (blue), anthropometrics (green) and cardiovascular risk factors (red).
For continuous variables, the coefficient describes the effect per standard deviation of the variable. For binary variables, the coefficient describes the effect with a change in the variable from 0 to 1. The gray bars denote the 95% confidence interval. n = 19,988 subjects were included in the analysis.
Figure 4
Figure 4. Associations of cardiac and aortic imaging phenotypes with common diseases.
(a) Odds ratio for an imaging phenotype as a risk factor for a common disease as the outcome. Sex, age, weight and height were adjusted in a logistic regression analysis. n = 25,743 subjects were included in the analysis. (b) The corresponding p-values (two-sided t-test) for odds ratios shown in (a). *: reaching the FDR threshold (pFDR = 0.017 for α = 0.05); **: reaching the Bonferroni threshold (pBonf = 3.2 ×10⁴ for α = 0.05).
Figure 5
Figure 5. Phenome-wide association study.
(a) Manhattan plot showing the p-values (two-sided t-test) for correlations between imaging phenotypes and non-imaging phenotypes. The height of each data point denotes the negative logarithm of the univariate correlation p-value between one imaging phenotype and one non-imaging phenotype. The area of the data point denotes the absolute value of the Pearson’s correlation coefficient. The colour of the data point denotes the anatomical structure of the imaging phenotype. The Bonferroni threshold for multiple comparisons (α = 0.05) is shown as a dashed horizontal line. n = 26,893 subjects were included in the analysis. (b) Plot showing the Pearson’s correlation coefficients between imaging phenotypes and non-imaging phenotypes. The height of each data point denotes the correlation coefficient and the area denotes the negative logarithm of the p-value (two-sided t-test).

References

    1. Ponikowski P, et al. 2016 ESC Guidelines for the diagnosis and treatment of acute and chronic heart failure. Eur J Hear Fail. 2016;18:891–975. - PubMed
    1. Erbel R, et al. 2014 ESC Guidelines on the diagnosis and treatment of aortic diseases. Eur Hear J. 2014;35:2873–2926. - PubMed
    1. Watz H, et al. Decreasing cardiac chamber sizes and associated heart dysfunction in COPD. Chest. 2010;138:32–38. - PubMed
    1. Alonso-Gonzalez R, et al. Abnormal lung function in adults with congenital heart disease: Prevalence, relation to cardiac anatomy, and association with survival. Circulation. 2013;127:882–890. - PubMed
    1. Gansevoort RT, et al. Chronic kidney disease and cardiovascular risk: epidemiology, mechanisms, and prevention. The Lancet. 2013;382:339–352. - PubMed

Publication types

MeSH terms