. 2020 Oct;26(10):1636-1643.
doi: 10.1038/s41591-020-1051-9. Epub 2020 Aug 24.

An inflammatory cytokine signature predicts COVID-19 severity and survival

Affiliations

An inflammatory cytokine signature predicts COVID-19 severity and survival

Diane Marie Del Valle et al. Nat Med. 2020 Oct.

Abstract

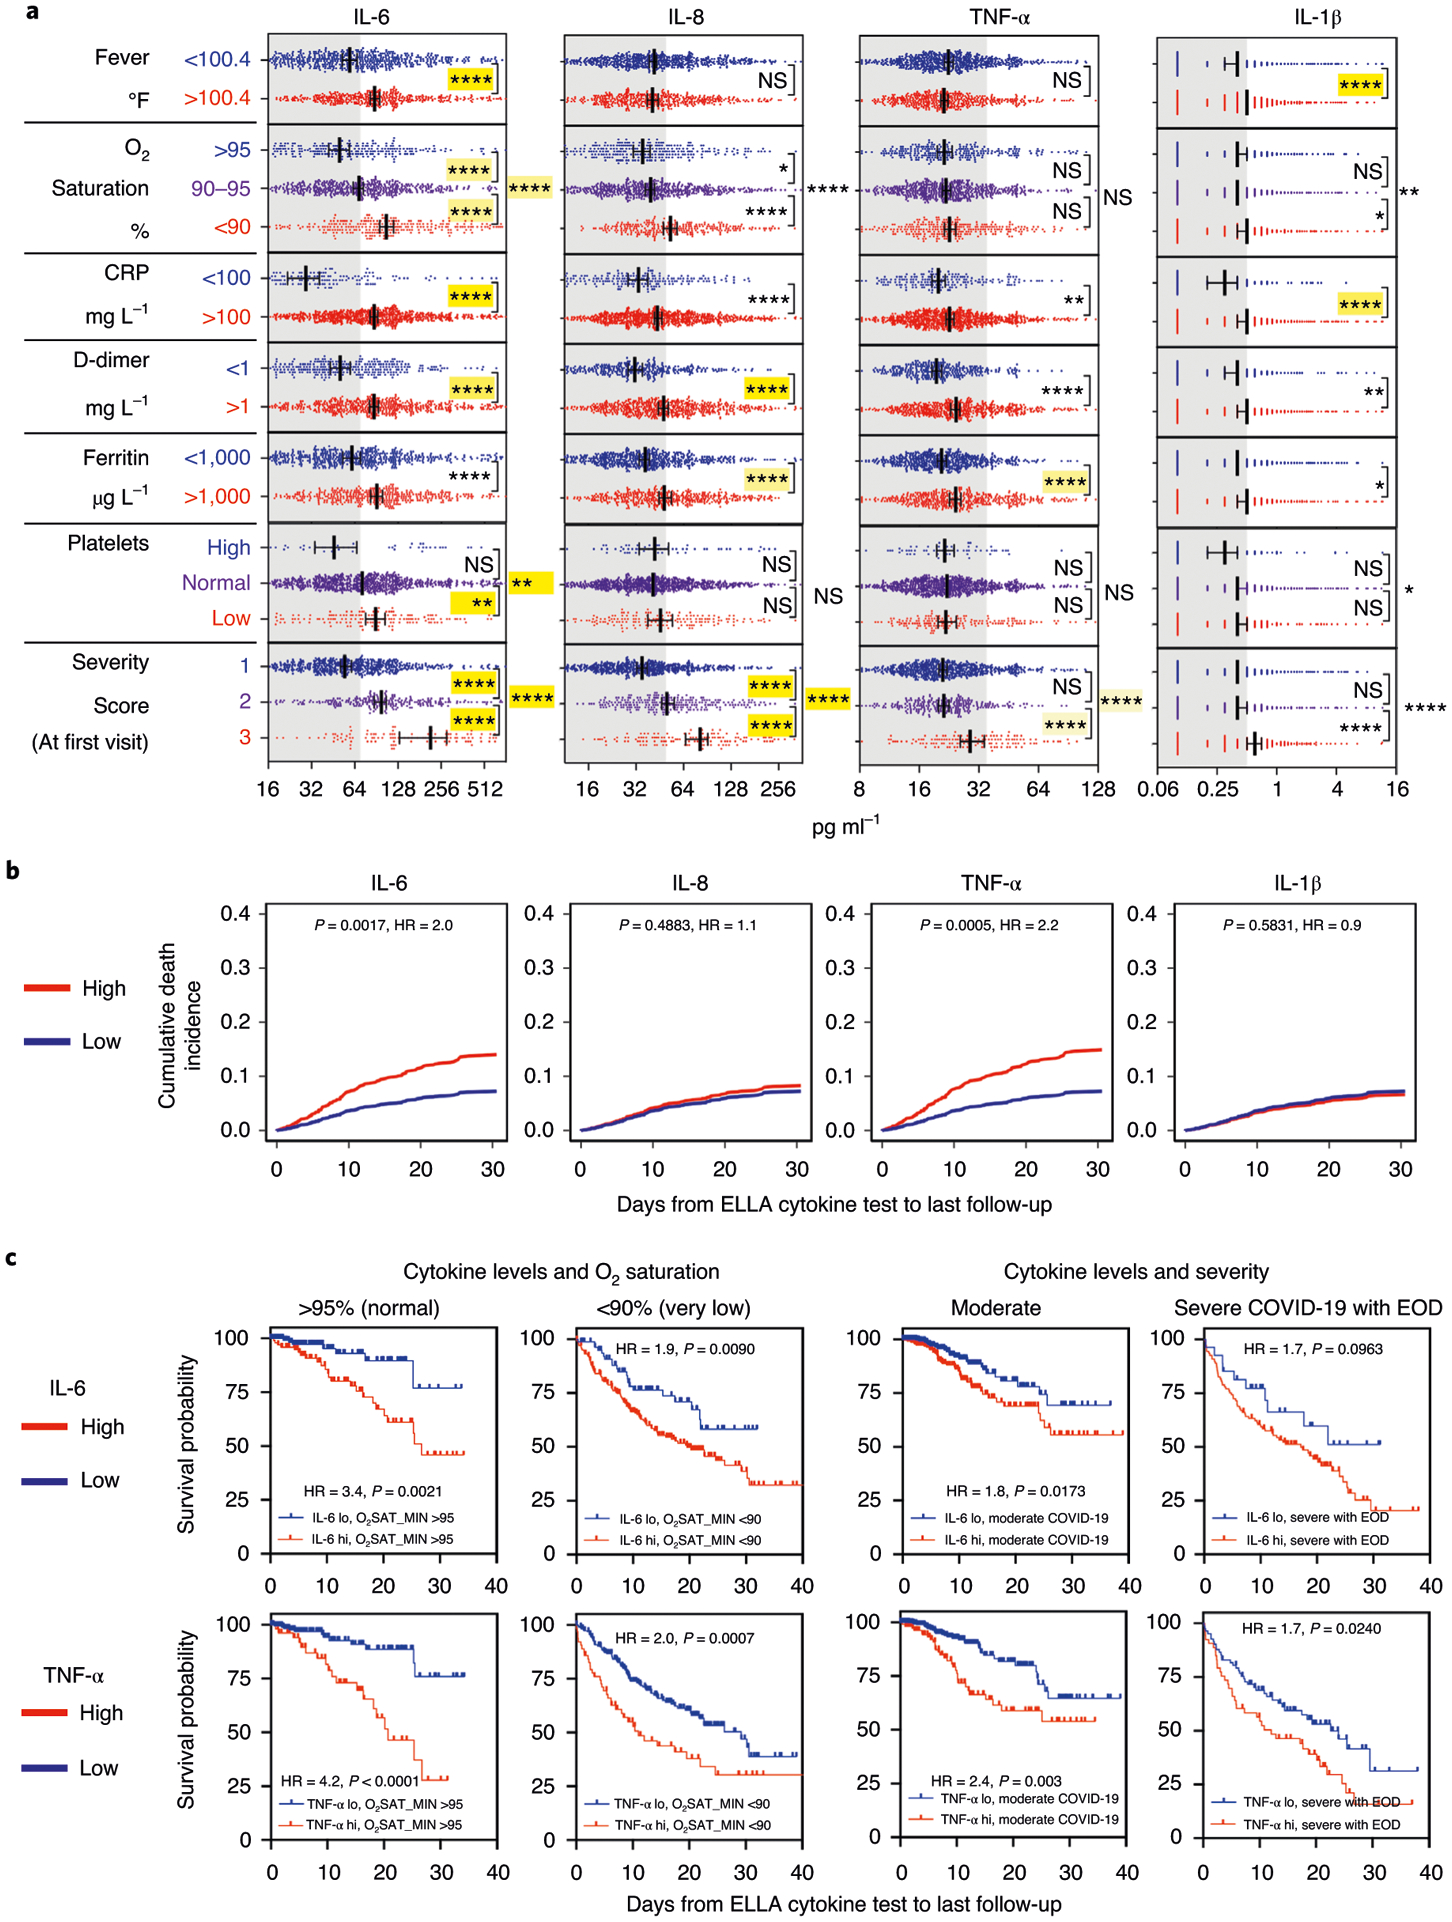
Several studies have revealed that the hyper-inflammatory response induced by severe acute respiratory syndrome coronavirus 2 (SARS-CoV-2) is a major cause of disease severity and death. However, predictive biomarkers of pathogenic inflammation to help guide targetable immune pathways are critically lacking. We implemented a rapid multiplex cytokine assay to measure serum interleukin (IL)-6, IL-8, tumor necrosis factor (TNF)-α and IL-1β in hospitalized patients with coronavirus disease 2019 (COVID-19) upon admission to the Mount Sinai Health System in New York. Patients (n = 1,484) were followed up to 41 d after admission (median, 8 d), and clinical information, laboratory test results and patient outcomes were collected. We found that high serum IL-6, IL-8 and TNF-α levels at the time of hospitalization were strong and independent predictors of patient survival (P < 0.0001, P = 0.0205 and P = 0.0140, respectively). Notably, when adjusting for disease severity, common laboratory inflammation markers, hypoxia and other vitals, demographics, and a range of comorbidities, IL-6 and TNF-α serum levels remained independent and significant predictors of disease severity and death. These findings were validated in a second cohort of patients (n = 231). We propose that serum IL-6 and TNF-α levels should be considered in the management and treatment of patients with COVID-19 to stratify prospective clinical trials, guide resource allocation and inform therapeutic options.


Figures

Extended Data Fig. 1 |
Extended Data Fig. 1 |. Sensitivity, specificity, and reproducibility testing of the ELLA platform and cytokine levels and correlation observed in COVID-19 specimens.
a, Spearman r correlation between IL-6 tested by two other platforms for soluble analyte detection, Olink (n = 18) and LabCorp (n = 142), using plasma or serum specimens from CAR-T CRS or COVID-19. b, Interassay and intraassay coefficient of variation (CV) of replicates for two recombinant controls used at high or low concentration in each assay for IL-6 and TNF-α using a first set of controls, and for the ELLA panel used in this study using Randox recombinant antigens at three dilution levels over 28 dates tested. c, Reproducibility testing replicates of the same biological specimen from CAR-T samples, with Spearman r indicated for 40 paired samples for IL-6 and 8 paired samples for TNF-α. d, Distribution of each cytokine in all COVID-19 samples tested as shown in Fig. 1. e, Correlation matrix of IL-1β, IL-6, IL-8, and TNF-β levels in COVID-19 plasma specimens (n = 1,949) and in E. multiple myeloma specimens during immunotherapy-related CRS (n = 121). Scale indicates value of Spearman r correlation. Cytokines levels are less coordinated in COVID-19 than in CAR-T CRS.
Extended Data Fig. 2 |
Extended Data Fig. 2 |. Flow chart to determine severity.
HFNC: high flow nasal cannula; NRB: non-rebreather mask; BiPAP: bilevel positive airway pressure; CPAP: continuous positive airway pressure; SpO2: oxygen saturation; CrCl: creatinine clearance. ALT: alanine aminotransferase; ULN: upper level of normal; HD/CVVH: hemodialysis / continuous venovenous hemofiltration; EOD: end organ damage.
Extended Data Fig. 3 |
Extended Data Fig. 3 |. Correlations of clinical and laboratory measurements in individual patients.
a, Unsupervised clustering of laboratory measurements in a subset of 1,069 patients with sufficient available information. On the y axis are vitals and laboratory values after z-scoring, and on the x axis are individual patients, using metrics measured from the time point corresponding to the first ELLA cytokine test. Grey bars on the side of the plot indicate clusters of patients or analytes, where cytokines co-cluster with known severity metrics, such as LDH, CRP, ferritin, D-dimer, but also high neutrophil, platelet and white blood counts. Annotations show patients who died in orange, and maximum severity score achieved in gray shades. b, Similarity matrix of patients based on analytes and measurements, showing two major clusters, with enrichment in patients who died and had more severe COVID-19 on the upper left. c, Similarity matrix of cytokines, lab measurements and vitals, showing IL-6, IL-8, and IL-1β co-clustering with known inflammatory markers such as LDH, CRP, ferritin, and D-dimer, while TNF-α co-clusters with organ damage markers.
Extended Data Fig. 4 |
Extended Data Fig. 4 |. Validation of the models in an independent cohort.
Performance of the model including demographics and comorbidities (a-c) or additionally including laboratory metrics (d-f) in a validation cohort of 231 patients. a and d, Pointwise time-dependent area under the curve (AUC) along with the 95% confidence interval were computed to assess the discrimination of the model from cytokine test to last follow-up, with values well above 0.5. b and e, Calibration was assessed by plotting Kaplan-Meier curves using the actual survival probabilities in the validation cohort and by comparing it with the corresponding predicted survival probabilities. Closeness of these two curves is a sign of good calibration. c and f, The distribution of the prognostic index in the original cohort (red) and the validation cohort (green) shown as histogram displays a similar spread, providing evidence towards the appropriateness of the validation cohort. Median (IQR) for primary model without labs: original cohort: 0.2401 (−0.3874, 0.8168), validation cohort: 0.0697 (−0.4785, 0.7722). Median (IQR) for model including labs: original cohort: −0.3671 (−1.3246, 0.5021), validation cohort: −0.6642 (−1.5348, 0.3444).
Fig. 1 |
Fig. 1 |. Range of measured cytokines.
Detection range of cytokines in all tested serum samples from patients with COVID-19 hospitalized at the Mount Sinai Health System (orange, n = 1,959), in comparison with serum samples from healthy donors (black, n = 9) and plasma samples from patients with multiple myeloma prior to (blue, n = 151) and during (red, n = 121) CRS induced by CAR T cell therapy. Heavy bars indicate median, and error bars represent 95% CI, each value indicated by a dot. Pairwise comparisons by the two-sided Mann–Whitney t-test show significantly higher levels of IL-6, IL-8 and TNF-α in COVID-19 samples compared to samples from healthy donors of patients with non-CRS cancer (****P < 0.0001, ***P < 0.001, **P < 0.01 and *P < 0.05; NS, not significant). Median, mean and range are shown in Extended Data Fig. 1d (error band indicates the median with 95% CI). HD, hemodialysis.
Fig. 2 |
Fig. 2 |. Cytokine levels by PCR status, demographics and comorbidity.
Cytokine levels observed in relation to a, SARS-CoV-2 PCR status (negative indicates patients with COVID-19-like respiratory symptoms with a negative SARS-CoV-2 PCR test) (n = 1,422 independent patient samples); b, demographics (excluding PCR negative, with data available for sex, age, BMI and race/ethnicity for 1,298, 1,307, 1,174 and 1,131 patients, respectively); and c, comorbidities (excluding PCR negative, data available for smoking and comorbidity diagnoses, respectively, for 964 and 1,266 individual patients). Scatter plots indicating individual measurements (dots); thick line is median; error bars representing 95% CI; and statistical analyses by two-sided Mann–Whitney univariate t-test (****P < 0.0001, ***P < 0.001, **P < 0.01 and *P < 0.05; NS, not significant). Not shown here are COPD, HIV, sleep apnea and active cancer, which did not show any significant difference for cytokine levels. In yellow highlights are the statistical values that were still significant after adjustment of all demographic and comorbidity variables, with shade of yellow indicating adjusted P value (light: *, mid: **, high: *** and saturated: ****). Gray area indicates cytokine levels below the respective cutoff.
Fig. 3 |
Fig. 3 |. Cytokine levels and survival.
Survival curves based on each cytokine measured, after multiple variable adjustments for sex, age, race/ethnicity, smoking, CKD, hypertension, asthma and CHF (n = 1,246). Cox regression model showing overall survival with CIs for each cytokine based on time from ELLA cytokine test to last follow-up date (discharge, death or still in hospital, whichever comes last), with significance indicated by P value and HR. There was worse survival if cytokines were high (red, above cutoffs of 70 pg ml for IL-6, 50 pg ml for IL-8, 35 pg ml for TNF-α and 0.5 pg ml for IL-1β) versus low (blue, below cutoffs). Each line indicates the predicted survival probability over follow-up time, with the error band indicating the corresponding two-sided 95% CI.
Fig. 4 |
Fig. 4 |. Cytokine levels correlate with severity and independently predict survival.
Correlation of cytokine levels with established inflammatory and severity measurements. a, Correlation of each cytokine with each metric (n = 1,106 for fever, n = 1,112 for O2 saturation, n = 1,023 for CRP, n = 926 for D-dimer, n = 1,017 for ferritin, n = 1,038 for platelets and n = 1,023 for disease severity score), using the same univariate and multivariate analyses as in the Fig. 2 legend. Error bar indicates the median ± 95% CI. b, Competing risk analysis (n = 671) showing survival differences by IL-6 and TNF-α levels, after adjusting the following variables: IL-6, IL-8, TNF-α, IL-1β, age, sex, race/ethnicity, smoking status, asthma, atrial fibrillation, cancer, CHF, CKD, COPD, diabetes, hypertension, sleep apnea, severity, systolic blood pressure max, O2 saturation min, D-dimer, albumin, calcium, chloride and platelet count. c, Kaplan–Meier univariate analyses of survival by IL-6 and TNF-α levels in patients with normal (n = 257), low (n = 258) or very low (n = 287) O2 saturation, or in patients with moderate (n = 588) versus severe COVID-19 with end organ damage (n = 136), as measured at the first available test. EOD, end organ damage.
Fig. 5 |
Fig. 5 |. Treatment effect on cytokine levels.
a, Effect of treatments on IL-6 (top row), IL-8 (middle row) and TNF-α (bottom row). Lines (in red: with indicated treatment; in blue: without indicated treatment) represent the best fit curve by smoothed spline of the longitudinal and unique time point distribution of each cytokine level based on time from either first encounter or treatment start. Of 1,670 samples representing various time points of 1,315 patients with available information, the number of those from patients who received tocilizumab, corticosteroids (any of prednisone, methylprednisolone or dexamethasone), remdesivir, acetaminophen, hydroxychloroquine and/or anticoagulants (apixaban, enoxaparin, heparin or rivaroxaban) was 73, 305, 76, 620, 1,333, and 1,113, respectively. b, Effect of different corticosteroids on IL-6.

Update of

Comment in

  • COVID 19: in the eye of the cytokine storm.
    Liuzzo G, Patrono C. Liuzzo G, et al. Eur Heart J. 2021 Jan 7;42(2):150-151. doi: 10.1093/eurheartj/ehaa1005. Eur Heart J. 2021. PMID: 33462598 Free PMC article. No abstract available.

References

    1. Richardson S et al. Presenting characteristics, comorbidities, and outcomes among 5700 patients hospitalized with COVID-19 in the New York City area. JAMA 323, 2052–2059 (2020). - PMC - PubMed
    1. Paranjpe I et al. Clinical characteristics of hospitalized COVID-19 patients in New York City. Preprint at 10.1101/2020.04.19.20062117 (2020). - DOI
    1. Wang B et al. A tertiary center experience of multiple myeloma patients with COVID-19: lessons learned and the path forward. J. Hematol. Oncol 13, 94 (2020). - PMC - PubMed
    1. Merad M & Martin JC Pathological inflammation in patients with COVID-19: a key role for monocytes and macrophages. Nat. Rev. Immunol 20, 355–362 (2020). - PMC - PubMed
    1. Vabret N et al. Advancing scientific knowledge in times of pandemics. Nat. Rev. Immunol 20, 338 (2020). - PMC - PubMed

Publication types

MeSH terms