

Analysis of the electricity demand trends amidst the COVID-19 coronavirus pandemic
- PMID: 32839701
- PMCID: PMC7331303
- DOI: 10.1016/j.erss.2020.101682
Analysis of the electricity demand trends amidst the COVID-19 coronavirus pandemic
Abstract
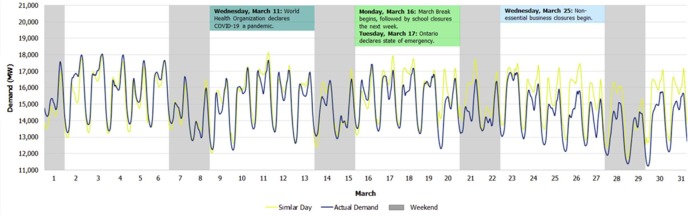
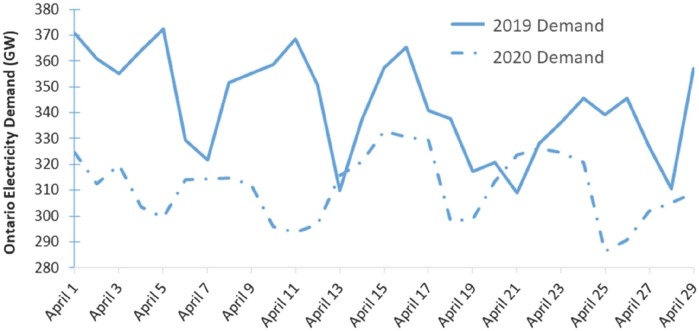
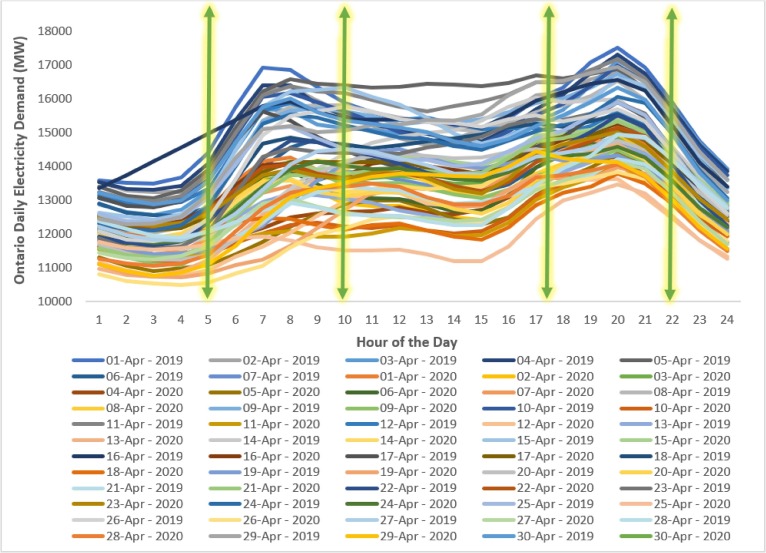
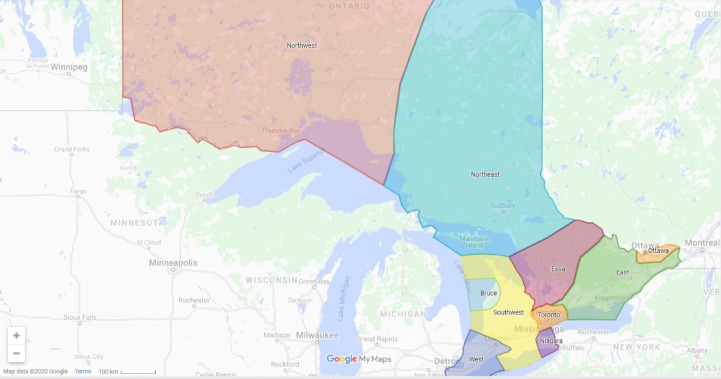
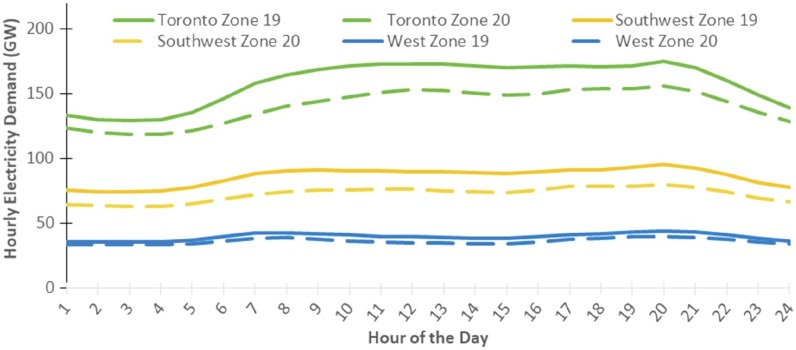
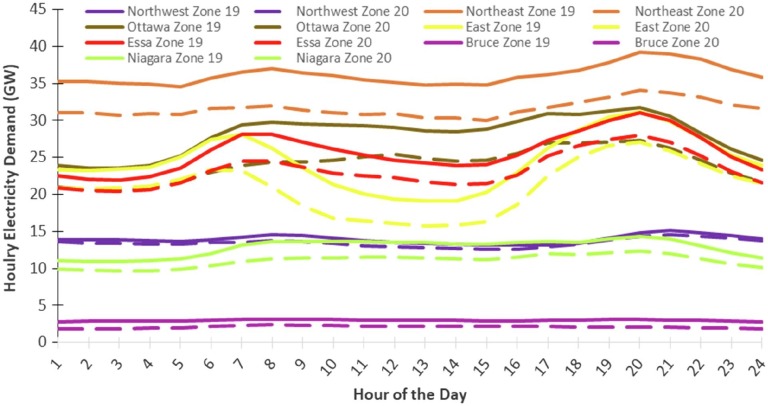
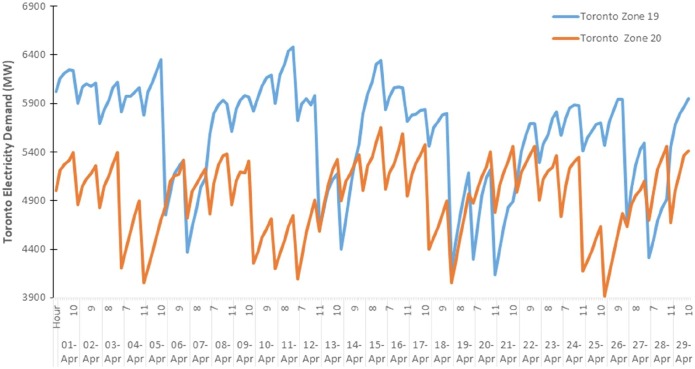
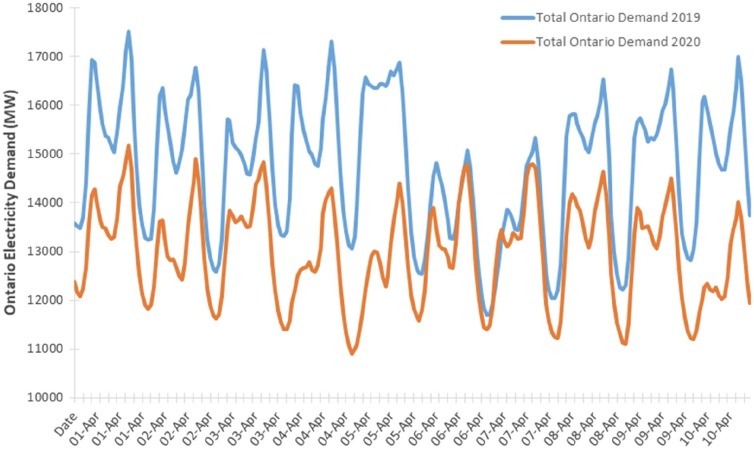
This paper investigates the impact of COVID-19 and the global pandemic on the energy sector dynamics. Hourly electricity demand data was collected and analyzed for the province of Ontario. It is evident that health-related pandemics have a detrimental and direct influence on the concept of the smart city. This is manifested through various social, economic, environmental, technological and energy-related changes. The overall electricity demand of the province for the month of April of this year amidst pandemic conditions declined by 14%, totaling 1267 GW. A unique trend of reciprocating energy demand exists throughout the week. The post-COVID-19 indicates higher energy demand in the earlier part of the week and a lower demand in the latter part of the week. Pre-pandemic, the days of highest electricity demand were in the latter part of the work week (Wed-Fri) in addition to the weekend. Post-pandemic, the highest electricity demand occurred in the earlier part of the week (Mon-Tue). Hourly electricity demand shows a clear curve flattening during the pandemic, especially during peak hours of 7-11 in the morning and 5-7 in the evening, resulting in significant demand reductions during these periods. Lastly, due to COVID-19, GHG emission reductions of 40,000 tonnes of CO2e were achieved along with savings of $131,844 for the month of April.
Keywords: COVID-19 pandemic; Electricity demand reduction; Energy conservation; Smart city.
© 2020 Elsevier Ltd. All rights reserved.
Conflict of interest statement
The authors declare that they have no known competing financial interests or personal relationships that could have appeared to influence the work reported in this paper.
Figures
References
-
- International Civil Aviation Organization (ICAO), “Effects of Novel Coronavirus (COVID‐19) on Civil Aviation: Economic Impact Analysis,” Montreal, 2020.
-
- Kesicki F., Anandarajah G. The role of energy-service demand reduction in global climate change mitigation: Combining energy modelling and decomposition analysis. Energy Policy. 2011;39(11):7224–7233.
-
- [3] UN, “Everyone Included: Social Impact of COVID-19,” 2020. [Online]. Available: https://www.un.org/development/desa/dspd/everyone-included-covid-19.html.
-
- [4] Amanda Jackson, “A crisis mental-health hotline has seen an 891% spike in calls,” CNN, 10-Apr-2020.
-
- Fell M.J., Chiu L.F. Children, parents and home energy use: Exploring motivations and limits to energy demand reduction. Energy Policy. 2014;65:351–358.
Publication types
LinkOut - more resources
Full Text Sources
Miscellaneous