

Analysis of mobility trends during the COVID-19 coronavirus pandemic: Exploring the impacts on global aviation and travel in selected cities
- PMID: 32839706
- PMCID: PMC7365059
- DOI: 10.1016/j.erss.2020.101693
Analysis of mobility trends during the COVID-19 coronavirus pandemic: Exploring the impacts on global aviation and travel in selected cities
Abstract
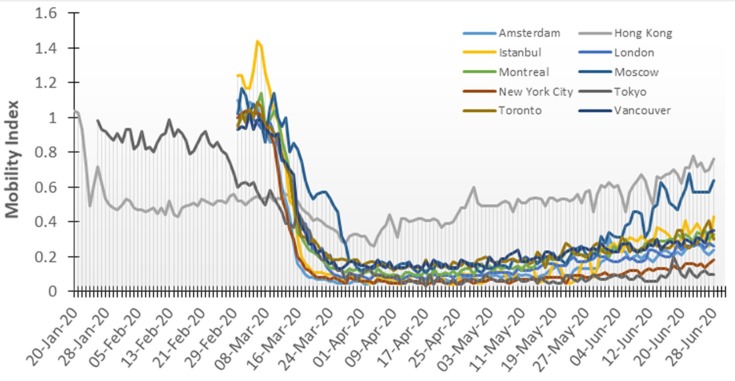
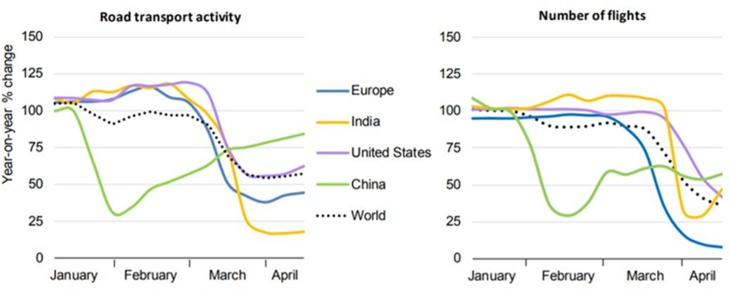
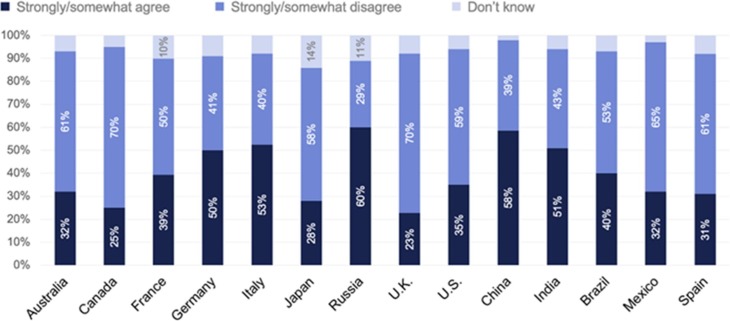
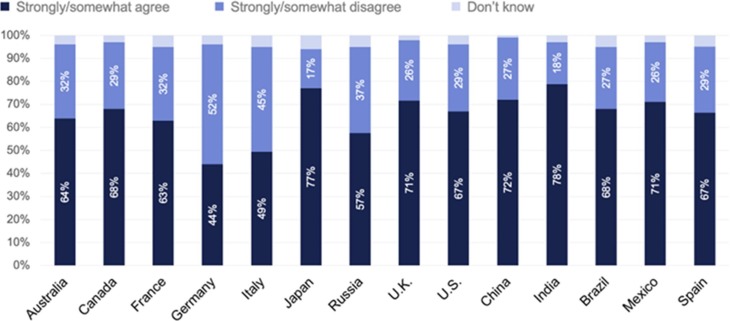
This paper analyzes the impact of COVID-19 on the transportation sector and subsequent implications on the sectoral energy savings and greenhouse gas emissions in some selected cities worldwide. A model for smart transportation is proposed by considering four indicators, including transport efficiency, technology integration, traffic congestion rate, and accessibility ratio. While prior health crises, such as SARS, impacted the transportation sector, the COVID-19 pandemic is unprecedented, resulting in exceptional impacts on this sector. Canadian Civil Aviation activities dropped by 71%, compared to business as usual, whereas military aviation activities declined by 27%. As of the end of June 2020, cities with higher than 50% mobility index include Brussels, Singapore, Stockholm, Lyon, Paris, Moscow, and Hong Kong with the highest mobility index of 76%. American cities have the lowest mobility indexes as of the end of June with mobility indexes lower than 20%. It is expected and reasonable to assume that the public's response to COVID-19 will exceed that of SARS. While Britons and Canadians are the biggest supporters of keeping the economy and businesses shut until COVID-19 is fully contained, the Chinese, Russians, Indians, and Italians find it vital to restart the economy regardless. Results show that the majority of the world is in a state of mental distress and will face nervousness and anxiety issues post-COVID-19. This sentiment is strongest in India, Japan, China, the U.K., Brazil and Canada, ranging between 68% and 78%. The trucking industry is the main contributor to the greenhouse gas (GHG) emissions of the Canadian transportation sector, accounting for more than 62% of the total emissions in 2019. Given the impact of COVID-19, forecasted GHG emissions of the Canadian transportation sector for 2020is evaluated to be 93 megatonnes of carbon dioxide equivalents.
Keywords: COVID-19 pandemic; Energy research; Energy sustainability; Environment; Social behavior; Transportation.
© 2020 Elsevier Ltd. All rights reserved.
Conflict of interest statement
The authors declare that they have no known competing financial interests or personal relationships that could have appeared to influence the work reported in this paper.
Figures


References
-
- IEA, “Global Energy Review 2020,” Report, International Energy Agency, Paris, 2020.
-
- T. Ramos Alfaro, “Transport for London to Place a Quarter of Its Staff on Furlough,” London, p. 1, Apr-2020.
-
- J. Sung, Y. Monschauer, “Changes in transport behaviour during the Covid-19 crisis,” 2020.
-
- Environment and Climate Change Canada, “Greenhouse gas emissions – Transportation sector greenhouse gas emissions, Canada,” Report, Ottawa, 2017.
Publication types
LinkOut - more resources
Full Text Sources
Miscellaneous