. 2020 Sep 22;1(6):100081.
doi: 10.1016/j.xcrm.2020.100081. Epub 2020 Aug 19.

SARS-CoV-2-Specific T Cells Exhibit Phenotypic Features of Helper Function, Lack of Terminal Differentiation, and High Proliferation Potential

Affiliations

SARS-CoV-2-Specific T Cells Exhibit Phenotypic Features of Helper Function, Lack of Terminal Differentiation, and High Proliferation Potential

Jason Neidleman et al. Cell Rep Med. .

Abstract

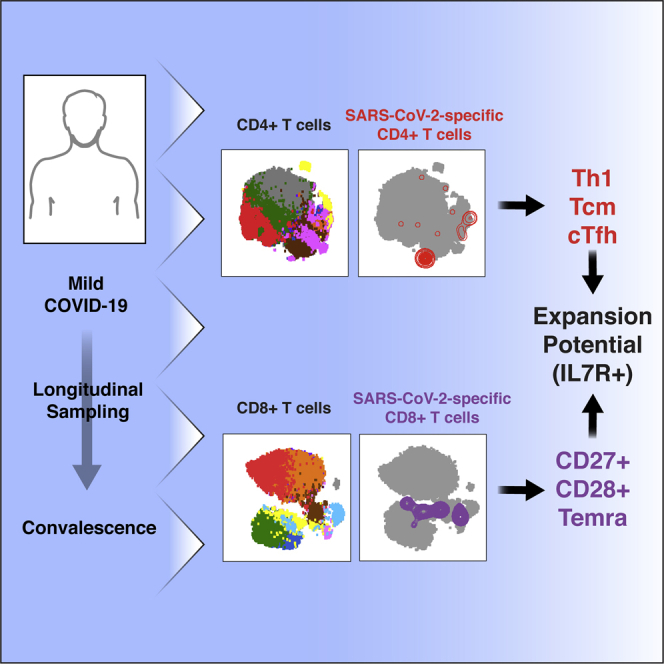
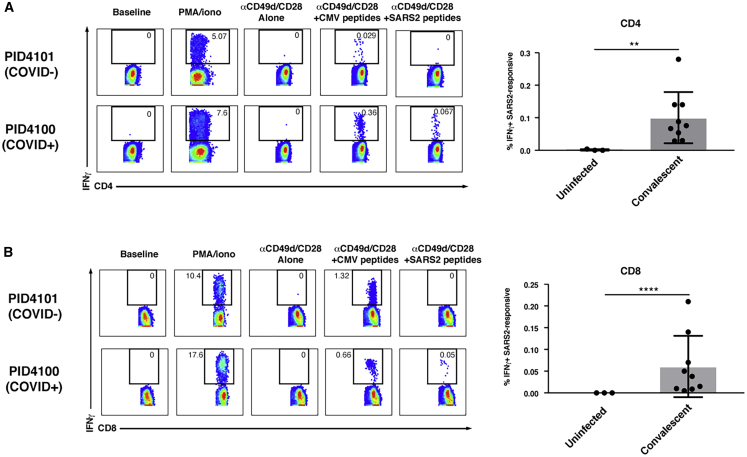
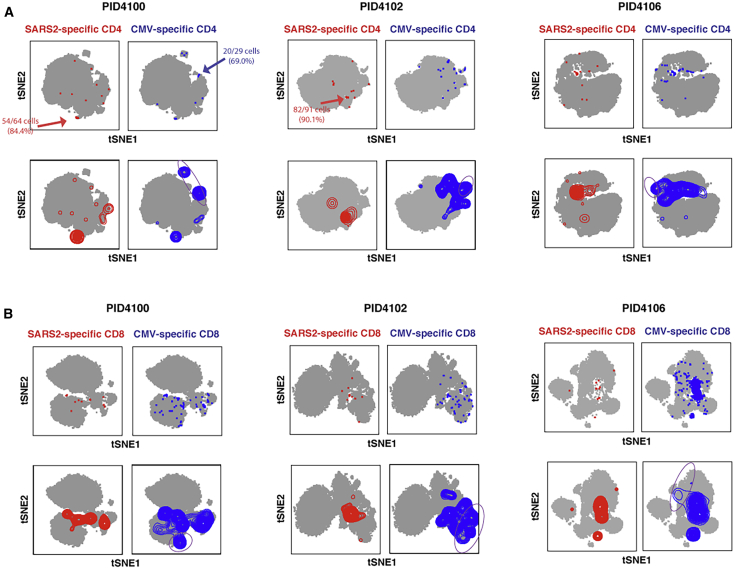
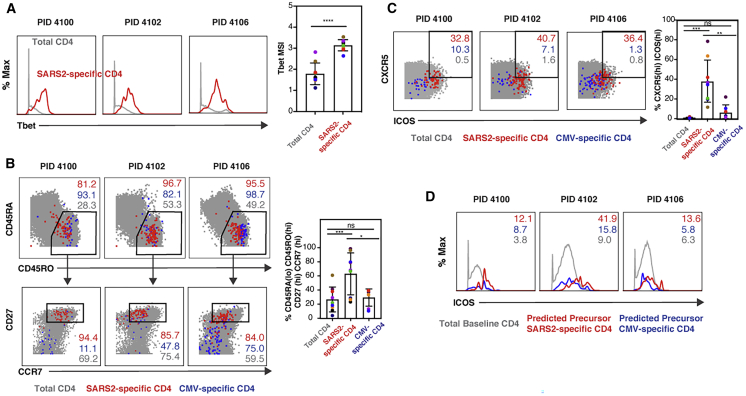
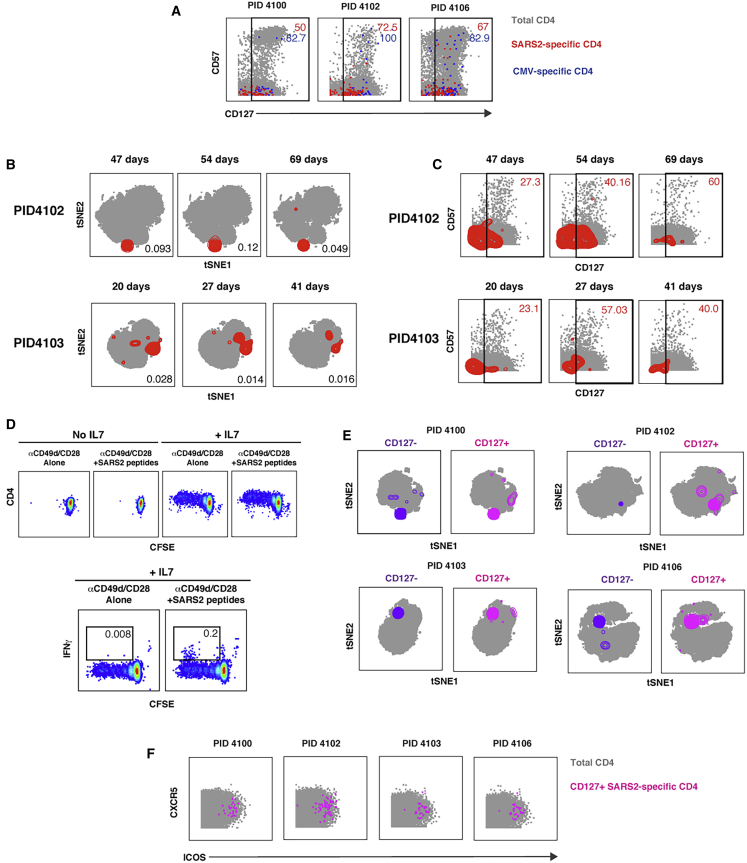
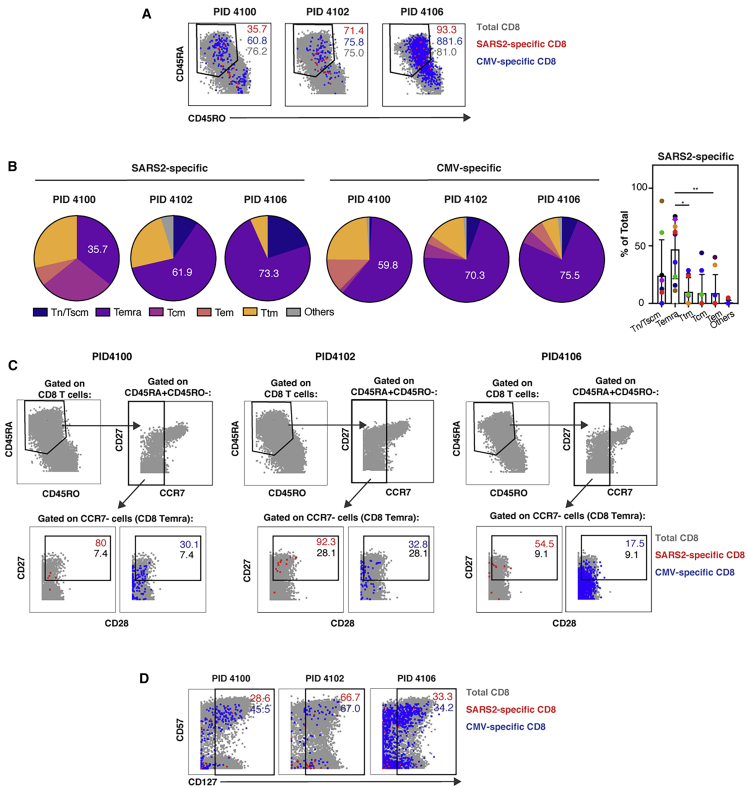
Convalescing coronavirus disease 2019 (COVID-19) patients mount robust T cell responses against SARS-CoV-2, suggesting an important role of T cells in viral clearance. To date, the phenotypes of SARS-CoV-2-specific T cells remain poorly defined. Using 38-parameter CyTOF, we phenotyped longitudinal specimens of SARS-CoV-2-specific CD4+ and CD8+ T cells from nine individuals who recovered from mild COVID-19. SARS-CoV-2-specific CD4+ T cells were exclusively Th1 cells and predominantly Tcm cells with phenotypic features of robust helper function. SARS-CoV-2-specific CD8+ T cells were predominantly Temra cells in a state of less terminal differentiation than most Temra cells. Subsets of SARS-CoV-2-specific T cells express CD127, can proliferate homeostatically, and can persist for over 2 months. Our results suggest that long-lived and robust T cell immunity is generated following natural SARS-CoV-2 infection and support an important role of SARS-CoV-2-specific T cells in host control of COVID-19.

Keywords: CD127; COVID-19; CyTOF; IL7; SARS-CoV-2; T cells; convalescent individuals; homeostatic proliferation; mild COVID-19.


Conflict of interest statement

The authors declare no competing interests.

Figures

None
Graphical abstract
Figure 1
Figure 1
Antigen-Specific CD4+ and CD8+ T Cells against SARS-CoV-2 Spike Secrete IFNγ (A and B) Shown on the left are pseudocolor plots of CyTOF datasets reflecting the percentage of CD4+ (A) or CD8+ (B) T cells producing IFNγ in response to the indicated treatment condition for one representative uninfected (COVID−) and recovered convalescent (COVID+) donor. Numbers correspond to the percentage of cells within the gates. The baseline condition corresponds to cells phenotyped by CyTOF immediately following isolation of PBMCs from freshly drawn blood, whereas for all other treatment conditions, cells were cultured for 6 h prior to phenotyping by CyTOF. PMA/ionomycin treatment was used as a positive control. Anti-CD49d/CD28 was used to provide co-stimulation during peptide treatment. Shown on the right are cumulative data from three uninfected individuals and nine recovered convalescent individuals (Table S1). Results are gated on live singlet CD4+ or CD8+ T cells. ∗∗p < 0.01, ∗∗∗∗p < 0.0001, as assessed using Student’s unpaired t test. See also Figures S1 and S2.
Figure 2
Figure 2
SARS-CoV-2 Spike-Specific CD4+ and CD8+ T Cells Are Diverse and Not Phenotypically Identical to Their CMV-Specific Counterparts (A and B) Shown are t-SNE plots of CyTOF datasets reflecting CD4+ (A) or CD8+ (B) T cells from three representative COVID-19 convalescent donors who had also sustained a previous CMV infection. Cells shown in gray correspond to CD4+ or CD8+ T cells from specimens stimulated with anti-CD49d/CD28 in the absence of any peptides. The top pairs of plots show SARS-CoV-2 spike-specific (red) or CMV pp65-specific (blue) cells as individual dots, with some regions concentrated in antigen-specific cells indicated. The bottom pairs of plots show the same data but with antigen-specific cells shown as contours instead of dots to better visualize regions with the highest densities of antigen-specific cells. Purple ovals outline examples of regions harboring CMV-specific but not SARS-CoV-2-specific cells. See also Figures S3–S6.
Figure 3
Figure 3
SARS-CoV-2-Specific CD4+ Th1 Cells Are Tcm and cTfh Cells (A) SARS-CoV2-specific CD4+ T cells are Th1 cells. Shown are the expression levels of Tbet, a transcription factor that directs Th1 differentiation, in total (gray) or SARS-CoV2-specific (red) CD4+ T cells from the blood of 3 representative convalescent individuals. Shown on the right are cumulative data from all 9 convalescent individuals analyzed in this study. ∗∗∗∗p < 0.0001 as assessed using Student’s paired t test. (B) SARS-CoV-2-specific but not CMV-specific CD4+ T cells are predominantly Tcm cells. The phenotypes of total (gray), SARS-CoV-2-specific (red), and CMV-specific (blue) CD4+ T cells are shown as dot plots for 3 representative donors. Top: SARS-CoV-2-specific and CMV-specific CD4+ T cells are predominantly CD45RA−CD45RO+, characteristic of canonical memory cells. Bottom: most memory (CD45RA−CD45RO+) SARS-CoV-2-specific CD4+ T cells are CD27+CCR7+, characteristic of Tcm cells, whereas most CMV-specific memory CD4+ T cells are CD27−CCR7−, characteristic of Tem cells. The percentage of total, SARS-CoV-2-specific, and CMV-specific cells within the indicates gates are shown in gray, red, and blue, respectively. Shown on the right are cumulative data from all 9 convalescent individuals analyzed in this study. ∗p < 0.05, ∗∗∗p < 0.001, as assessed using Student’s unpaired t test. (C) SARS-CoV-2-specific CD4+ T cells express high levels of CXCR5 and ICOS relative to total and CMV-specific CD4+ T cells. Numbers correspond to the percentages of SARS-CoV-2-specific (red), CMV-specific (blue), and total (gray) CD4+ T cells in the gates for 3 representative donors. Shown on the right are cumulative data from all 9 convalescent individuals analyzed in this study. ∗∗p < 0.01, ∗∗∗p < 0.001, as assessed using Student’s unpaired t test. (D) ICOS is expressed at high levels on predicted precursors of IFNγ-producing SARS-CoV-2-specific CD4+ T cells. PP-SLIDE, was conducted to predict the original phenotypic features of SARS-CoV-2-specific (red) and CMV-specific (blue) cells prior to IFNγ induction. The expression levels of ICOS on these cells were compared with those on total CD4+ T cells phenotyped by CyTOF immediately following PBMC isolation. Numbers correspond to mean signal intensity (MSI) of ICOS expression for the populations indicated at the bottom.
Figure 4
Figure 4
SARS-CoV-2-Specific CD4+ T Cells Express CD127 and Can Persist for Over 2 Months (A) A subset of SARS-CoV-2-specific CD4+ T cells express CD127. The indicated cell populations were examined for expression levels of the terminal differentiation marker CD57 and the IL-7 receptor CD127. Numbers correspond to the percentages of the corresponding populations within the gates. (B) SARS-CoV-2-specific CD4+ T cells can persist for over 2 months. Shown are t-SNE plots of CyTOF datasets of CD4+ T cells from two COVID-19 convalescent donors who were sampled longitudinally at the indicated time points post-infection (infection was defined as the time of testing positive for SARS-CoV-2). Cells shown in gray correspond to total CD4+ T cells from specimens stimulated with anti-CD49d/CD28 in the absence of any peptides. The locations of SARS-CoV-2-specific cells are shown as red contours. The percentage of CD4+ T cells that are SARS-CoV-2 specific is indicated at the bottom right of each plot. (C) Persistent SARS-CoV-2-specific CD4+ T cells retain CD127 expression. Longitudinal specimens characterized in (B) were analyzed for expression levels of CD57 and CD127. SARS-CoV-2-specific CD4+ T cells are shown as red contours, whereas total CD4+ T cells are shown as gray dots. The percent of SARS-CoV-2-specific CD4+ T cells in the gates is shown at the top right of each plot. Note that the proportions of CD127+ SARS-CoV-2-specific CD4+ T cells do not decrease over time. (D) SARS-CoV-2-specific CD4+ T cells can proliferate homeostatically in response to IL-7. PBMCs from convalescent donor PID4102 were labeled with CFSE and cultured for 5 days in the absence or presence of IL-7. Thereafter the cells were treated for 6 h with co-stimulation alone or in the presence of overlapping peptides from SARS-CoV-2 spike and then analyzed by flow cytometry. Homeostatic proliferation, as assessed by CFSE dye dilution, only occurred in the presence of IL-7 (top). A subpopulation of CFSElow cells produced IFNγ in response to peptide stimulation (bottom), demonstrating that cells driven to proliferate by IL-7 treatment included SARS-CoV-2-specific CD4+ T cells. Results are gated on live singlet CD3+CD4+CD8− cells and are representative of one of two donors. (E) CD127+ SARS-CoV-2-specific CD4+ T cells are distributed similarly as their CD127- counterparts. Shown are t-SNE plots of CD127− (purple) and CD127+ (pink) SARS-CoV-2-specific CD4+ T cells overlaid on total CD4+ T cells treated with co-stimulation alone (gray). Note that, for each donor, CD127+ cells occupy similar regions of t-SNE space as CD127− cells. (F) CD127+ SARS-CoV-2-specific CD4+ T cells express CXCR5 and ICOS.
Figure 5
Figure 5
SARS-CoV-2-Specific CD8+ T Cells Are Predominantly a Less Differentiated Subset of Temra Cells and Include Long-Lived CD127-Expressing Cells (A) SARS-CoV2-specific CD8+ T cells include CD45RA+CD45RO− and CD45RA−CD45RO+ cells. The phenotypes of total (gray), SARS-CoV-2-specific (red), and CMV-specific (blue) CD8+ T cells are shown as dot plots for three representative donors. (B) SARS-CoV-2-specific CD8+ T cells are predominantly Temra cells. The proportions of SARS-CoV-2-specific and CMV-specific CD8+ T cells belonging to each subset are depicted as pie graphs. Numbers correspond to the percentages of cells belonging to the Temra cell subset. Shown on the right are cumulative data for SARS-CoV-2-specific CD8+ T cells from all 9 convalescent individuals analyzed in this study. ∗p < 0.05, ∗*p < 0.01, as assessed using Student’s paired t test. (C) Compared with CMV-specific and total CD8+ Temra cells, SARS-CoV-2-specific CD8+ Temra cells express high levels of CD27 and CD28. Top: Temra cells were defined as CD45RA+CD45RO− cells expressing low levels of CCR7. Bottom: CD8+ Temra cells were further assessed for expression levels of CD27 and CD28. Numbers correspond to the percentage of total (gray), SARS-CoV-2-specific (red), and CMV-specific (blue) cells within the gate. (D) A subset of SARS-CoV-2-specific CD8+ T cells express CD127. The indicated cell populations were examined for expression levels of CD57 and CD127. See also Figure S7.

Update of

References

    1. Lu R., Zhao X., Li J., Niu P., Yang B., Wu H., Wang W., Song H., Huang B., Zhu N. Genomic characterisation and epidemiology of 2019 novel coronavirus: implications for virus origins and receptor binding. Lancet. 2020;395:565–574. - PMC - PubMed
    1. Johns Hopkins Coronavirus Resource Center 2020. https://coronavirus.jhu.edu/map.html
    1. Zhang X., Tan Y., Ling Y., Lu G., Liu F., Yi Z., Jia X., Wu M., Shi B., Xu S. Viral and host factors related to the clinical outcome of COVID-19. Nature. 2020;583:437–440. - PubMed
    1. Thevarajan I., Nguyen T.H.O., Koutsakos M., Druce J., Caly L., van de Sandt C.E., Jia X., Nicholson S., Catton M., Cowie B. Breadth of concomitant immune responses prior to patient recovery: a case report of non-severe COVID-19. Nat. Med. 2020;26:453–455. - PMC - PubMed
    1. Huang L., Shi Y., Gong B., Jiang L., Liu X., Yang J., Tang J., You C., Jiang Q., Long B. Blood single cell immune profiling reveals the interferon-MAPK pathway mediated adaptive immune response for COVID-19. medRxiv. 2020 doi: 10.1101/2020.03.15.20033472. - DOI