. 2020 Aug 25:9:e56664.
doi: 10.7554/eLife.56664.

Atomic structure of a mitochondrial complex I intermediate from vascular plants

Affiliations

Atomic structure of a mitochondrial complex I intermediate from vascular plants

Maria Maldonado et al. Elife. .

Abstract

Respiration, an essential metabolic process, provides cells with chemical energy. In eukaryotes, respiration occurs via the mitochondrial electron transport chain (mETC) composed of several large membrane-protein complexes. Complex I (CI) is the main entry point for electrons into the mETC. For plants, limited availability of mitochondrial material has curbed detailed biochemical and structural studies of their mETC. Here, we present the cryoEM structure of the known CI assembly intermediate CI* from Vigna radiata at 3.9 Å resolution. CI* contains CI's NADH-binding and CoQ-binding modules, the proximal-pumping module and the plant-specific γ-carbonic-anhydrase domain (γCA). Our structure reveals significant differences in core and accessory subunits of the plant complex compared to yeast, mammals and bacteria, as well as the details of the γCA domain subunit composition and membrane anchoring. The structure sheds light on differences in CI assembly across lineages and suggests potential physiological roles for CI* beyond assembly.

Keywords: Vigna radiata; assembly; biochemistry; chemical biology; complex I; electron microscopy; mitochondria; molecular biophysics; respiration; structural biology.

Plain language summary

Respiration is the process used by all forms of life to turn organic matter from food into energy that cells can use to live and grow. The final stage of this process relies on an intricate chain of protein complexes which produce the molecule that cells use for energy. Complexes in the chain are made up of specific proteins that are carefully assembled, often into discrete modules or intermediate complexes, before coming together to form the full protein complex. Understanding how these complexes are assembled provides important insights into how respiration works. The precise three-dimensional structure of these complexes has been identified for bacteria, yeast and mammals. However, less is known about how these respiration complexes form in plants. For this reason, Maldonado et al. studied the structure of an intermediate complex that is only found in plants, called Cl*. This intermediate structure goes on to form complex I – the largest complex in the respiration chain. A technique called cryo-electron microscopy was used to obtain a structure of Cl* at a near-atomic level of detail. This structure revealed how the proteins that make up Cl* fit together, highlighting differences and similarities in how plants assemble complex I compared to bacteria, yeast and mammals. Maldonado et al. also studied the activity of Cl*, leading to the suggestion that this complex may be more than just a stepping stone towards building the full complex I and could have its own role in the cell. The structure of this complex provides new insights into the respiration mechanism of plants and could help scientists improve crop production. For instance, new compounds may be able to block respiration in pests, while leaving the crop unharmed; or genetic modifications could create plants that respire more efficiently in different environments.


Conflict of interest statement

MM, AP, LZ, FG, JL No competing interests declared

Figures

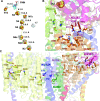
Figure 1.
Figure 1.. The structure of CI* from Vigna radiata.
(A) An overview of the conserved modular structure of CI using the Thermus thermophilus bacterial core subunits as a simple model (PDB: 4HEA) (Baradaran et al., 2013). (B) CryoEM density map of CI* from V. radiata highlighting its modular architecture. N, NADH-binding module; Q, quinone-binding module; PP, proximal-pump module; PD, distal-pump module; γCA, carbonic anhydrase domain, see also Video 1). (C) Atomic model of V. radiata CI* with all 30 assigned subunits labeled. The additional N-terminal helix of NDUS8 is indicated with an asterisk (*).
Figure 1—figure supplement 1.
Figure 1—figure supplement 1.. Schematic CI assembly pathways in metazoans and plants.
(A) CI assembly in metazoans. N-module is added at the last step of assembly. (B) CI assembly in plants. CI* intermediate is assembled before the PD domain is added last. N, NADH-binding module; Q, quinone-binding module; PP, proximal-pumps module; PD, distal-pumps module; γCA, carbonic anhydrase domain. Based on Formosa et al., 2018; Guerrero-Castillo et al., 2017; Garcia et al., 2017; Stroud et al., 2016; Ligas et al., 2019.
Figure 1—figure supplement 2.
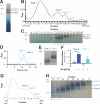
Figure 1—figure supplement 2.. Purification and characterization of CI*.
(A-F) Representative preparation of CI* sample. (A) Digitonin-extracted, amphipol-stabilized mitochondrial membrane complexes were run on a 3–12% blue-native polyacrylamide gel electrophoresis (BN-PAGE) and subjected to in-gel NADH dehydrogenase activity assay to detect CI activity (purple bands). The band labeled Peak 2 corresponds to CI*. (B) The digitonin-extracted, amphipol-stabilized sample was separated by a 10–45% (w:v) linear sucrose (suc) gradient and fractionated. (C) Samples of the sucrose gradient fractions from (B) were run on BN-PAGE gels and subjected to in-gel NADH-dehydrogenase activity assay. Relevant fractions as indicated by the dashed boxes were separately pooled and concentrated. (D) The pooled fractions from (C) were furthered purified using size-exclusion chromatography. The trace for the absorbance at 280 nm is shown. Relevant peak fractions were pooled and concentrated. (E) The activity of the purified fractions from (D) was re-tested with an NADH-dehydrogenase in-gel activity assay. (F) The activity of the purified samples from (D) was further tested with a spectroscopic NADH-decylubiquinone (DQ) activity assay in the presence or absence of 100 µM DQ. Four independent repeat measurements were done for each sample. The background-corrected average of the repeats is shown, together with the standard deviation (error bars). Significance (**, p<0.01) was tested with a two-tailed t-test. p-values: 0.0005 (peak 2) and 0.0063 (peak 3). (G-H) Preparation of CI* for the cryoEM dataset presented in this paper. (G) The digitonin-extracted, amphipol-stabilized mitochondrial membrane complexes were separated by a 15–45% (w:v) linear sucrose gradient and fractionated. (H) Sucrose gradient fractions from (G) were subjected to in-gel NADH-dehydrogenase activity assay. Fractions 10–11 were pooled, concentrated, buffer-exchanged and used as the sample for the cryoEM grid used in the determination of the structure of CI* presented here.
Figure 1—figure supplement 3.
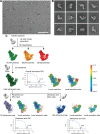
Figure 1—figure supplement 3.. CryoEM processing steps.
(A) A representative micrograph of the 8541 used for further processing (9816 collected). Scale bar, 100 nm. (B) Representative 2D class averages from reference-free classification in Relion. (C) Classification and refinement procedures used. The local refinement map, a local refinement slice and the gold-standard FSC curves are shown next to their respective final reconstructions.
Figure 1—figure supplement 4.
Figure 1—figure supplement 4.. CryoEM model-to-map correlation.
(A) Representative density from the composite map showing the fit between the model and thee map for elements of secondary structure from the peripheral and membrane arms of CI*. (B–D) Map-Model FSC curves are shown for the peripheral arm focused refinement (B), the membrane arm focused refinement (C) and the composite map (D). (E) Low contour of filtered cryoEM density for CI* colored by module (N, tan; Q, green; PP blue; and γCA pink). The lipid membrane density is shown in grey.
Figure 2.
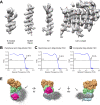
Figure 2.. Key differences in CI accessory subunits between V. radiata and opisthokonts.
Accessory subunits NDUS6 and NDUA12, NDUA8 and NDUC2 of V. radiata (this study), Y. lipolytica (PDB:6RFR) and O. aries (PDB: 6QA9) are shown as surface for comparison. (A) NDUS6 (green) and NDUA12 (orange), with an additional label for NDUA9. (B) NDUA8 (maroon), with additional label for the V. radiata’s carbonic anhydrase domain (CA). (C) NDUC2 (blue), with additional label for the V. radiata’s CA.
Figure 3.
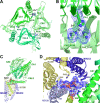
Figure 3.. V. radiata γ-carbonic-anhydrase (γCA) domain, Zn2+ coordination and associated lipid cavity.
(A) Top view of the carbonic anhydrase domain with its CA1 (green), CA2 (lime) and CAL2 (lime green). Key residues at subunit interfaces for Zn2+ coordination shown as sticks; Zn2+ shown as grey sphere. Only the CA1-CA2 interface has all three key Zn2+ coordinating histidines in place. (B) Zoom-in of Zn2+ coordination site in (A), with map density for the three histidines and Zn2+ shown as blue meshes. (C) Two phosphatidylcholines (spheres) are placed in the lipid cavity between the γCA and the PP-module. Asterisk indicates the N-terminal amphipathic helices of CA1 and CA2. (D Zoom-in of the lipid cavity in C), with lipid density shown as blue mesh and key interacting residues shown as sticks.
Figure 3—figure supplement 1.
Figure 3—figure supplement 1.. Schematic representation of the γ-carbonic-anhydrase (γCA) domain interfaces and potential active sites in V. radiata.
The Zn2+-adjacent amino acids, as per sequence alignment with CamH γCA homologue subunits, are shown. A red cross indicates amino acids that are incapable of coordinating Zn2+. A green tick indicates the potential active sites that are capable of coordinating Zn2+. CA1, carbonic-anhydrase-1 subunit; CA2, carbonic-anhydrase-2 subunit; CAL-2, carbonic-anhydrase-like-2 subunit.
Figure 4.
Figure 4.. Unassigned density in V. radiata CI* map.
Four stretches of unassigned, continuous densities in the map are shown with their positions on CI* indicated. Insets (A-D) show the density (blue mesh) and the poly-alanine chains (red) (A, C, D) or the putative NDUS6 C-terminal residues (B).
Figure 5.
Figure 5.. Structure of the redox centers, Q cavity and the hydrophilic axis of V. radiata CI*.
(A) V. radiata’s FMN (stick) and iron-sulfur clusters (spheres) are labeled by nearest-atom center-to-center distances, overlaid with those from T. thermophilus (transparent grey). (B) Key residues (stick) delineating the Q cavity and the nearby N2 iron-sulfur cluster (spheres). Unassigned density in the Q cavity, potentially corresponding to quinone, shown as blue mesh. (C) Key CI* residues constituting the hydrophilic axis within the membrane domain shown as sticks.
Appendix 1—figure 1.
Appendix 1—figure 1.. The Gibbs energy change of the CI reaction (ΔGCI) as a function of the redox poise of the mitochondrial NADH pool.
The Gibbs energy change was calculated using equation 10 and the values presented in Table A1, for reactions in which CI pumps 4 H+ (blue; representative of the standard, full-length CI pumping with a 4H+:2e- ratio) or 2 H+ (red; representative of a putative CI* pumping with a 2H+/2e- ratio). The horizontal dashed line indicates equilibrium state (ΔGCI = 0) for the different [NAD+]/[NADH] ratios. The vertical dashed line indicates the [NAD+]/[NADH] ratio at which full-length CI (blue) attains equilibrium (ϵ = 1). The highlighted orange region corresponds to conditions in which thermodynamics would favor reverse electron transport (RET) by full-length CI (ϵ > 1).

Similar articles

Cited by

References

    1. Agip AA, Blaza JN, Bridges HR, Viscomi C, Rawson S, Muench SP, Hirst J. Cryo-EM structures of complex I from mouse heart mitochondria in two biochemically defined states. Nature Structural & Molecular Biology. 2018;25:548–556. doi: 10.1038/s41594-018-0073-1. - DOI - PMC - PubMed
    1. Amthor JS, Bar-Even A, Hanson AD, Millar AH, Stitt M, Sweetlove LJ, Tyerman SD. Engineering strategies to boost crop productivity by cutting respiratory carbon loss. The Plant Cell. 2019;31:297–314. doi: 10.1105/tpc.18.00743. - DOI - PMC - PubMed
    1. Angerer H, Radermacher M, Mańkowska M, Steger M, Zwicker K, Heide H, Wittig I, Brandt U, Zickermann V. The LYR protein subunit NB4M/NDUFA6 of mitochondrial complex I anchors an acyl carrier protein and is essential for catalytic activity. PNAS. 2014;111:5207–5212. doi: 10.1073/pnas.1322438111. - DOI - PMC - PubMed
    1. Babot M, Birch A, Labarbuta P, Galkin A. Characterisation of the active/de-active transition of mitochondrial complex I. Biochimica Et Biophysica Acta (BBA) - Bioenergetics. 2014;1837:1083–1092. doi: 10.1016/j.bbabio.2014.02.018. - DOI - PMC - PubMed
    1. Baradaran R, Berrisford JM, Minhas GS, Sazanov LA. Crystal structure of the entire respiratory complex I. Nature. 2013;494:443–448. doi: 10.1038/nature11871. - DOI - PMC - PubMed

MeSH terms