. 2020 Aug 25:9:e61238.
doi: 10.7554/eLife.61238.

Sensory experience during early sensitive periods shapes cross-modal temporal biases

Affiliations

Sensory experience during early sensitive periods shapes cross-modal temporal biases

Stephanie Badde et al. Elife. .

Abstract

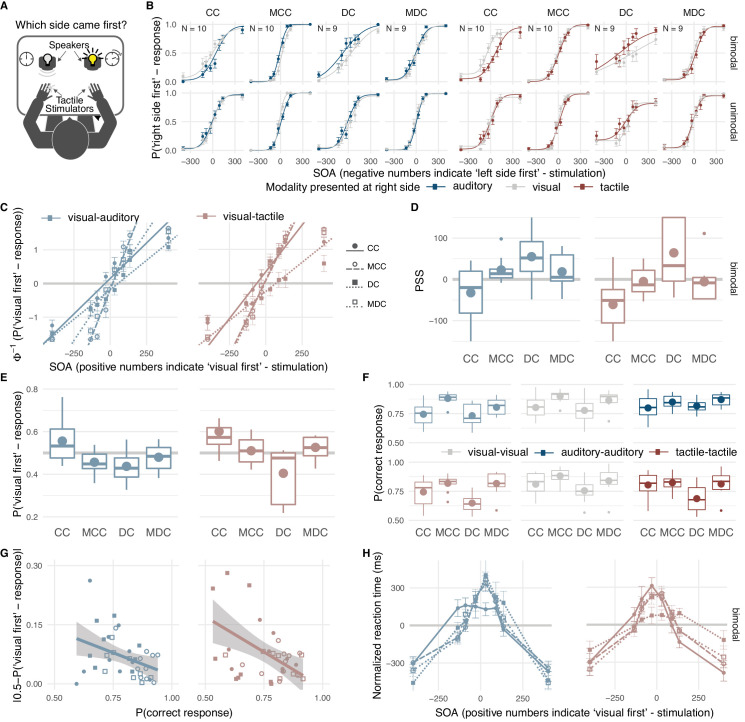
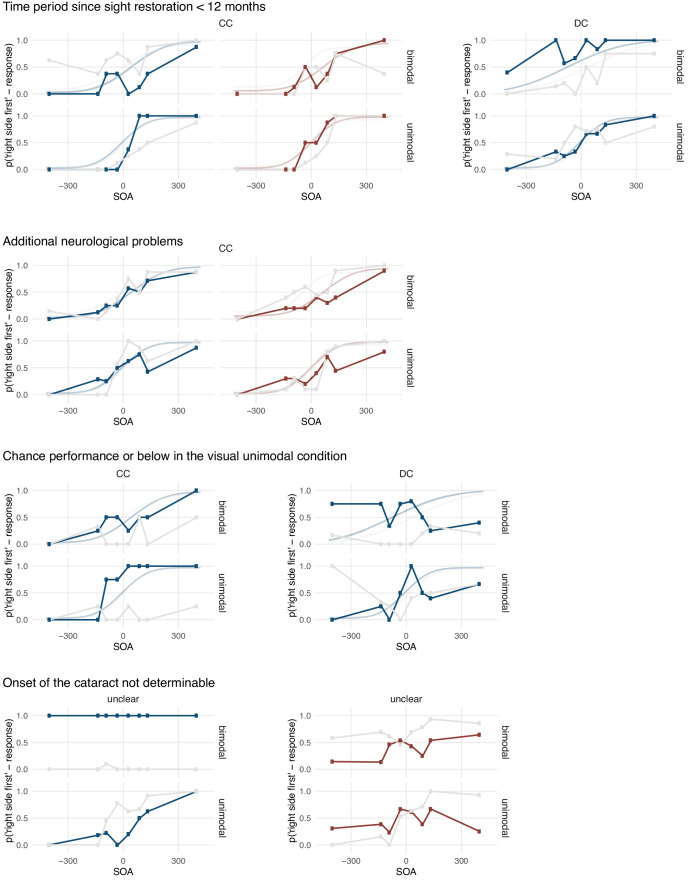
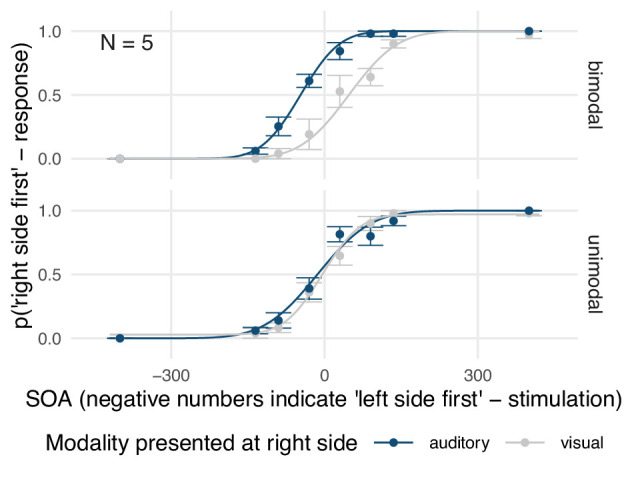
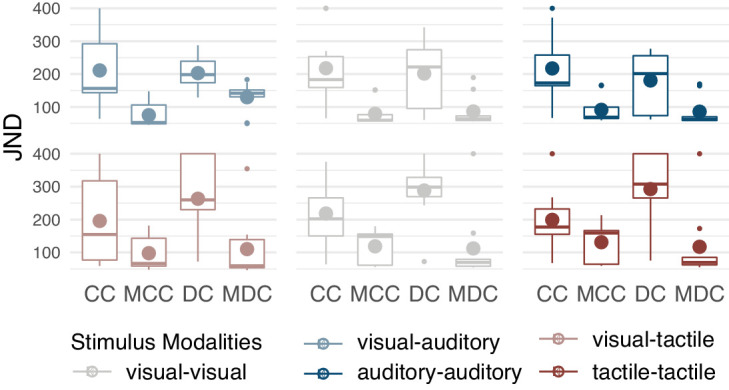
Typical human perception features stable biases such as perceiving visual events as later than synchronous auditory events. The origin of such perceptual biases is unknown. To investigate the role of early sensory experience, we tested whether a congenital, transient loss of pattern vision, caused by bilateral dense cataracts, has sustained effects on audio-visual and tactile-visual temporal biases and resolution. Participants judged the temporal order of successively presented, spatially separated events within and across modalities. Individuals with reversed congenital cataracts showed a bias towards perceiving visual stimuli as occurring earlier than auditory (Expt. 1) and tactile (Expt. 2) stimuli. This finding stood in stark contrast to normally sighted controls and sight-recovery individuals who had developed cataracts later in childhood: both groups exhibited the typical bias of perceiving vision as delayed compared to audition. These findings provide strong evidence that cross-modal temporal biases depend on sensory experience during an early sensitive period.

Keywords: cataract; crossmodal; human; neuroscience; perception; perceptual biases; sensitive period; temporal order.


Conflict of interest statement

SB, PL, SR, IS, RK, BR No competing interests declared

Figures

Figure 1.
Figure 1.. Effects of early visual experience on spatio-temporal order biases and resolution within and across vision, audition, and touch.
Thirteen individuals with surgically removed congenital, bilateral dense cataracts (CC) and sixteen individuals whose reversed cataracts had developed later in life (DC) as well as normally sighted individuals matched for age, gender, and handedness (MCC, MDC) took part in the study (see Table 1 for details about the samples). (A) Participants judged the spatio-temporal order of two successive stimuli –one presented in each hemifield– by indicating the location of the first stimulus. In Expt. 1, visual-visual, auditory-auditory, and visual-auditory stimulus pairs were presented, in Expt. 2, visual-visual, tactile-tactile, and visual-tactile stimulus pairs. (B) Psychometric curves: group average probabilities of a ‘right side first’-response as a function of SOA (negative values indicate ‘left side first’-stimulation). Data are split by the modality presented at the right side (visual = grey, auditory = dark blue, tactile = dark red) and the modality at the other side (rows, bimodal = different modality, unimodal = same modality). Curves display cumulative Gaussian distributions fitted to the group data for illustrative purposes. Error bars indicate standard errors of the mean in all panels. (C) Probit analysis: Group mean probits (CC = filled circle, MCC = open circle, DC = filled square, MDC = open square) of the probability for a ‘visual first’-response as a function of SOA (positive values indicate ‘visual first’-stimulation) in bimodal trials (visual-auditory = light blue, visual-tactile = light red). Lines show group averages of linear regression lines fitted to individual participant’s data. The longest SOA was excluded from the linear regression, if a participant’s performance had reached an asymptote. (D) Point of cross-modal subjective simultaneity (PSS): Box-and-whisker plots show the distribution (median, quartiles, minimum and maximum bounded at 1.5 x interquartile range, outliers) of individual PSS values; big circles indicate group mean values. Positive PSS values indicate that stimulus pairs in which the visual stimulus was presented first were perceived as simultaneous. (E) ‘Visual first’-bias: Box-and-whisker plots show the distribution of the proportion of ‘visual first’-responses per participant; big circles indicate group mean values. All SOAs were presented equally often, thus, a PSS of zero and a proportion of ‘visual first’-responses equal to 0.5 would have been correct. A positive PSS corresponds to a proportion of ‘visual first’-responses below 0.5 and vice versa. (F) Temporal order judgment accuracy: Distribution and group average probabilities of correct responses separately for each group and modality condition for each of three different modality combinations per experiment (light blue: visual-auditory, light red: visual-tactile, grey: visual-visual, dark blue: auditory-auditory, dark red: tactile-tactile). (G) Bias-accuracy relation: Single participants’ proportion of correct responses (x-axis) plotted against the absolute value of their ‘visual first’-bias (y-axis; markers as in (C)). Lines show linear regressions and 95% confidence intervals. (H) Reaction time (RT) distributions: Individually normalized RT in bimodal trials as a function of SOA (positive values indicate ‘visual first’-stimulation) per group. Markers and lines show group mean values (markers and line styles as in (C)).
Figure 1—figure supplement 1.
Figure 1—figure supplement 1.. Excluded data.
Participant-level mean proportions of ‘right side first’-responses are shown as a function of the stimulus onset asynchrony (SOA) of the two stimuli, with negative values indicating ‘left side first’-stimulation. The data are split into responses to bimodal (top row) and unimodal (bottom row) stimulus pairs and according to the modality presented at the right side (visual = grey, auditory = dark blue, tactile = dark red). Sigmoid curves fitted to the group mean data reported in Figure 1B are shown as a reference for participants for whom the onset of the cataract could be identified.
Figure 1—figure supplement 2.
Figure 1—figure supplement 2.. Visual-auditory temporal order judgments in typically sighted individuals in an additional experiment controlling for the effects of visual stimulus brightness.
Five additional, typically sighted participants (all female and right-handed, 23–50 years old, mean age 34 years) completed the visual-auditory experiment. Here, a visual stimulus consisted of three activated LEDs whereas in the main experiment for typically sighted controls only one LED had been activated. Group mean proportions of ‘right side first’-responses are shown as a function of the stimulus onset asynchrony (SOA) of the two stimuli, with negative values indicating ‘left side first’-stimulation. The data are split into responses to bimodal (top row) and unimodal (bottom row) stimulus pairs and according to the modality presented at the right side (visual = grey, auditory = dark blue). Participants showed a typical bias of perceiving visual stimuli as delayed compared to auditory stimuli.
Figure 1—figure supplement 3.
Figure 1—figure supplement 3.. Just noticeable differences (JND).
Box-and-whisker plots show the distribution (median, quartiles, minimum and maximum bounded at 1.5 x interquartile range, outliers) of individual JND values; big circles indicate group mean values.

References

    1. Aghdaee SM, Battelli L, Assad JA. Relative timing: from behaviour to neurons. Philosophical Transactions of the Royal Society B: Biological Sciences. 2014;369:20120472. doi: 10.1098/rstb.2012.0472. - DOI - PMC - PubMed
    1. Alais D, Carlile S. Synchronizing to real events: subjective audiovisual alignment scales with perceived auditory depth and speed of sound. PNAS. 2005;102:2244–2247. doi: 10.1073/pnas.0407034102. - DOI - PMC - PubMed
    1. Alais D, Cass J. Multisensory perceptual learning of temporal order: audiovisual learning transfers to vision but not audition. PLOS ONE. 2010;5:e11283. doi: 10.1371/journal.pone.0011283. - DOI - PMC - PubMed
    1. Badde S, Ley P, Rajendran SS, Shareef I, Kekunnaya R, Röder B. Resources of sensory experience during early sensitive periods shapes cross-modal temporal biases. Open Science Framework. 2019;1:CQN48. doi: 10.17605/OSF.IO/CQN48. - DOI - PMC - PubMed
    1. Basharat A, Adams MS, Staines WR, Barnett-Cowan M. Simultaneity and temporal order judgments are coded differently and change with age: an event-related potential study. Frontiers in Integrative Neuroscience. 2018;12:15. doi: 10.3389/fnint.2018.00015. - DOI - PMC - PubMed

Publication types